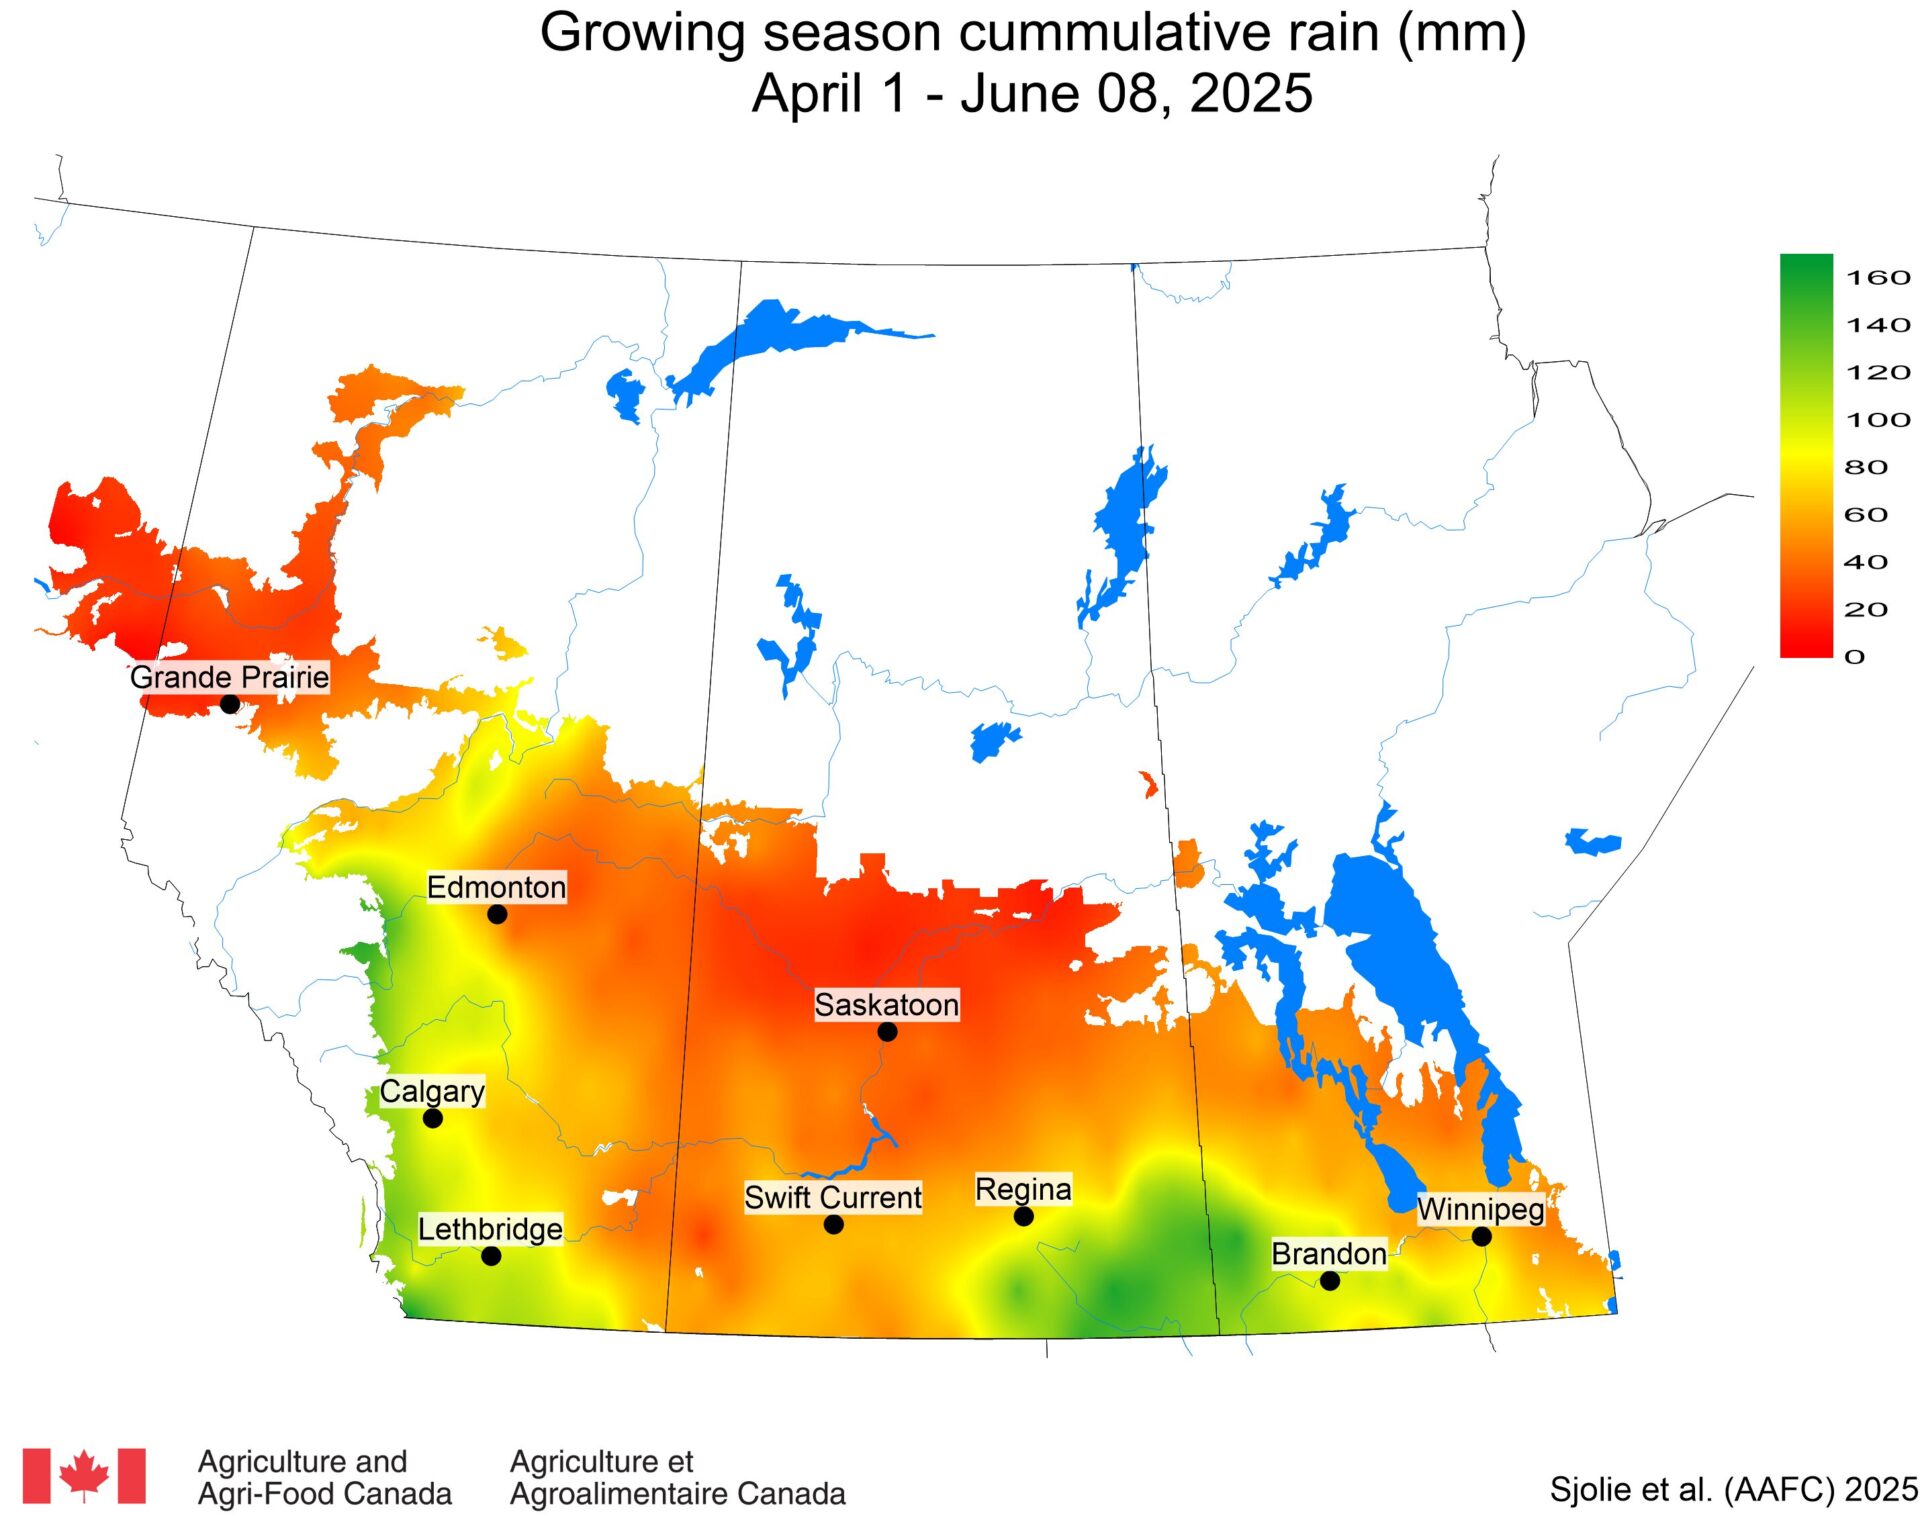
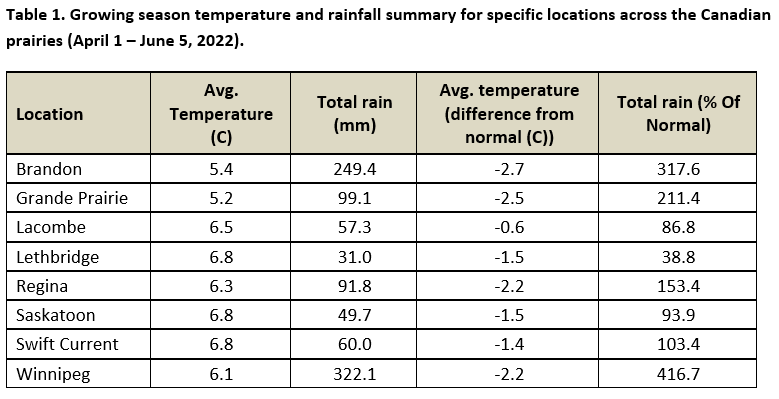
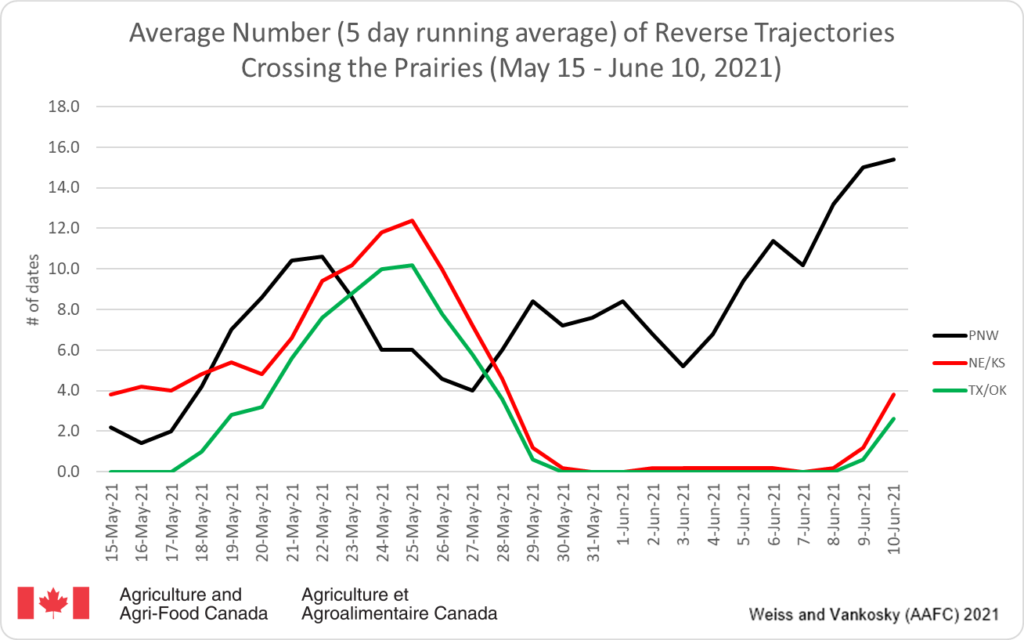
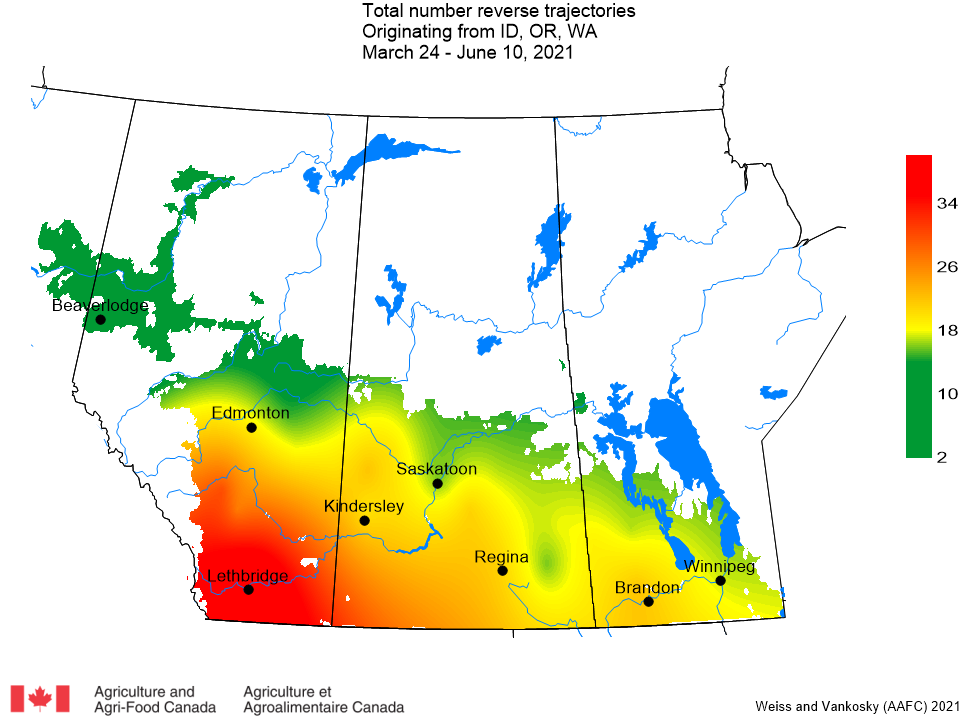
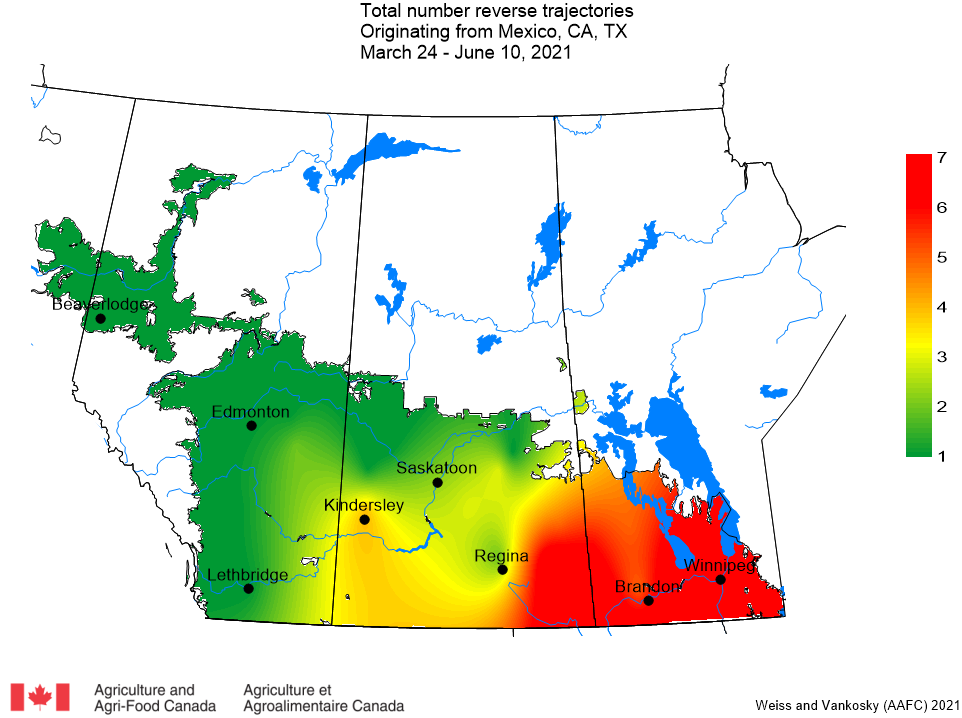
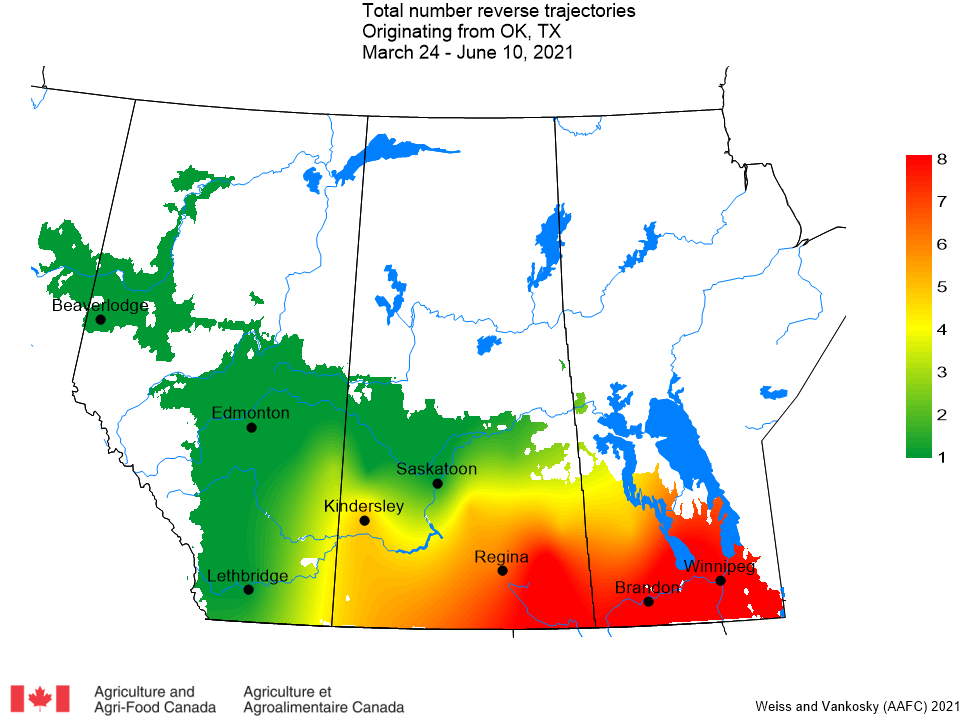
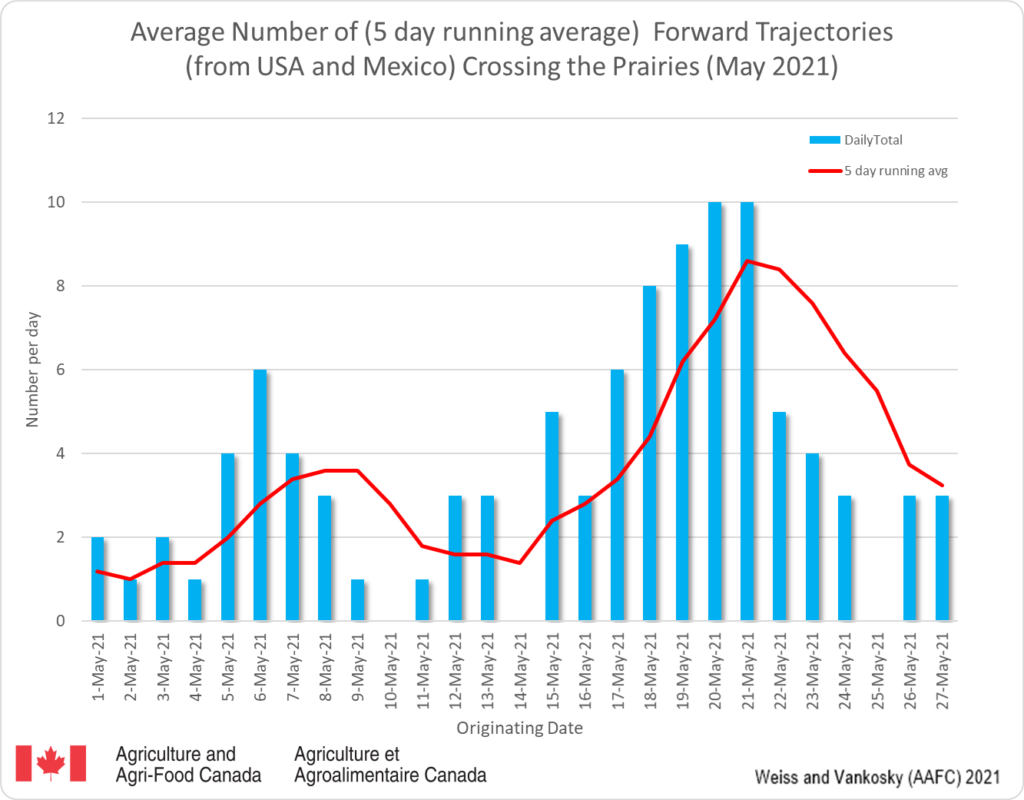
Many of Canada’s economically important species of insect pests originated as invasive species that managed to relocate and establish self-sustaining populations. Over time, they became increasingly widespread and so frequently abundant that they became part of the annual list of species we monitor and attempt to manage.
Examples of invasive species that now exist as part of our field crop landscape include wheat midge, cereal leaf beetle, cabbage seedpod weevil, pea leaf weevil, swede midge – in fact, the list of invasive species is far longer! It’s important to consider the impact of invasive species AND recognize that a growing list of species will likely affect field crops in Canada. Globalization, adaptation, and the development of new cultivars suited to Canada’s growing regions, climate change, plus many other factors will contribute to the reality: we can expect more invasive species to continue to arrive.
Where can you play a role??? Early detection and accurate identification are key steps involved in mitigating the risks associated with new invasive species. Many levels of government are active in the ongoing battle against invasive species. Even so, initial detections often arise from keen in-field scouting by producers or agrologists so access these resources to help identify the “that’s weird” or “I haven’t seen that before”. And be sure to thank the many entomologists – regional, provincial, federal, and some amazing amateurs PLUS the folks at Canadian Food Inspection Agency (CFIA) who ALL work to stand on guard for thee!
• Canadian Food Inspection Agency’s (CFIA) main Plant Health section can be accessed here.
• More specifically, CFIA’s Plant Pests and Invasive Species information is accessible here.
• Did you know…. CFIA’s top field crop invasive species include anything falling under the List of Pests Regulated by Canada which is accessible here. Caveats are that (i) some species may be on the list (e.g., codling moth) that are not necessarily a high priority but remain to maintain regulatory policy or (ii) list may include species yet to be removed.
• Anyone can access diagnostic information for invasive species at CFIA’s Plant Pest Surveillance section accessible here.
• HERE’S WHERE YOU CAN HELP – Experienced producers and agrologists make important discoveries every day! Keep Canadian agriculture strong and support the detection of invasive species using this important information and the three options when encountering unusual damage symptoms or unknown insect species:
Important details to be ready to report: Be ready to include details to make a “report” – Sightings need to be validated so providing as much detail as possible will help the expert confirm identifications and relocate the site, if the issue demands urgent attention.
◦ Date of observation
◦ Nearest town and province
◦ Latitude x longitude values
◦ Host plant(s)
◦ Good photo(s) – lateral, dorsal, damage symptoms, host plant, etc., with some sort of size reference is ideal
◦ Chronological photos (i.e., that tell the story of detection and how and when symptoms or specimen came to your attention)
◦ A specimen may be needed by your provincial entomologist or CFIA
Option 1: Contact your provincial entomologist to confirm identifications and details – they are able to help and historically have acted to triage reports then direct relevant information to CFIA counterparts:
◦ Manitoba (John.Gavloski@gov.mb.ca )
◦ Saskatchewan (james.tansey@gov.sk.ca)
◦ Alberta (shelley.barkley@gov.ab.ca)
Option 2: Alternatively, reports can be sent directly using one of the following paths:
◦ Using CFIA’s Report A Pest website form
◦ Contact a local CFIA office
◦ Or contact CFIA’S general surveillance account email at cfia.surveillance-surveillance.acia@canada.ca
◦ Or contact CFIA’s Survey Biologist for the Western Area (david.holden@canada.ca)
Option 3: Another alternative is to consider documenting your query using iNaturalist.ca (read more here). The basic steps involved are:
◦ Create an account at iNaturalist.ca (https://inaturalist.ca/signup)
◦ Watch your Inbox for a basic how-to guide.
◦ Upload photos or videos (e.g., bird calls) to create an “Observation”
◦ iNaturalist subscribers considered to be experts will help identify your observation.


