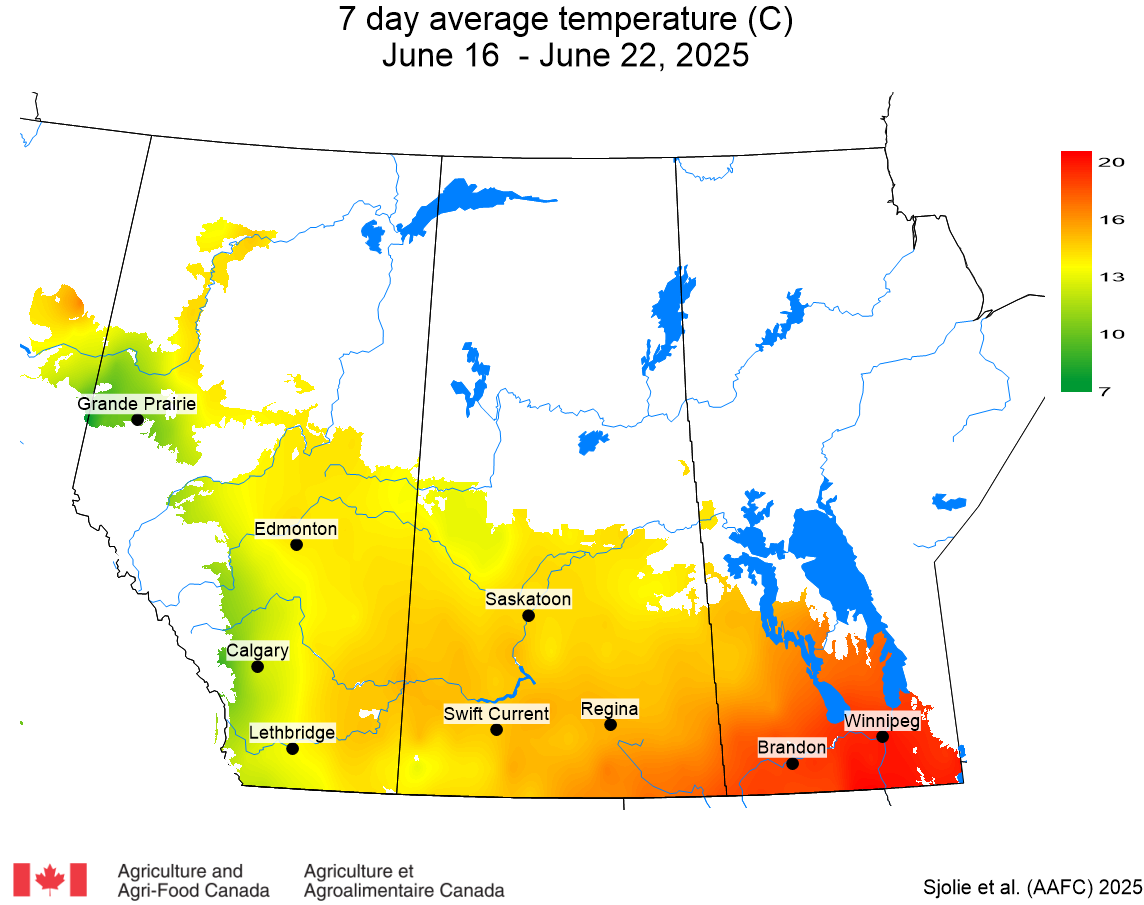
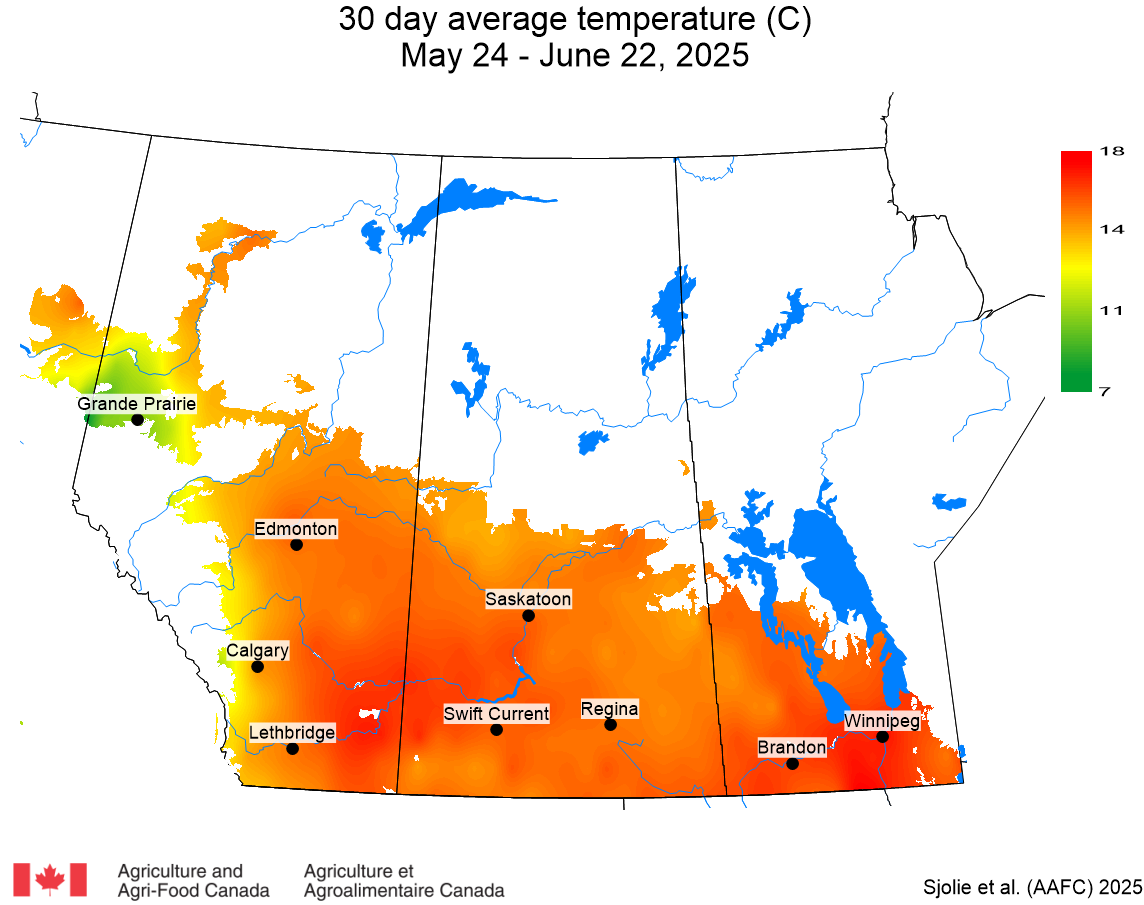
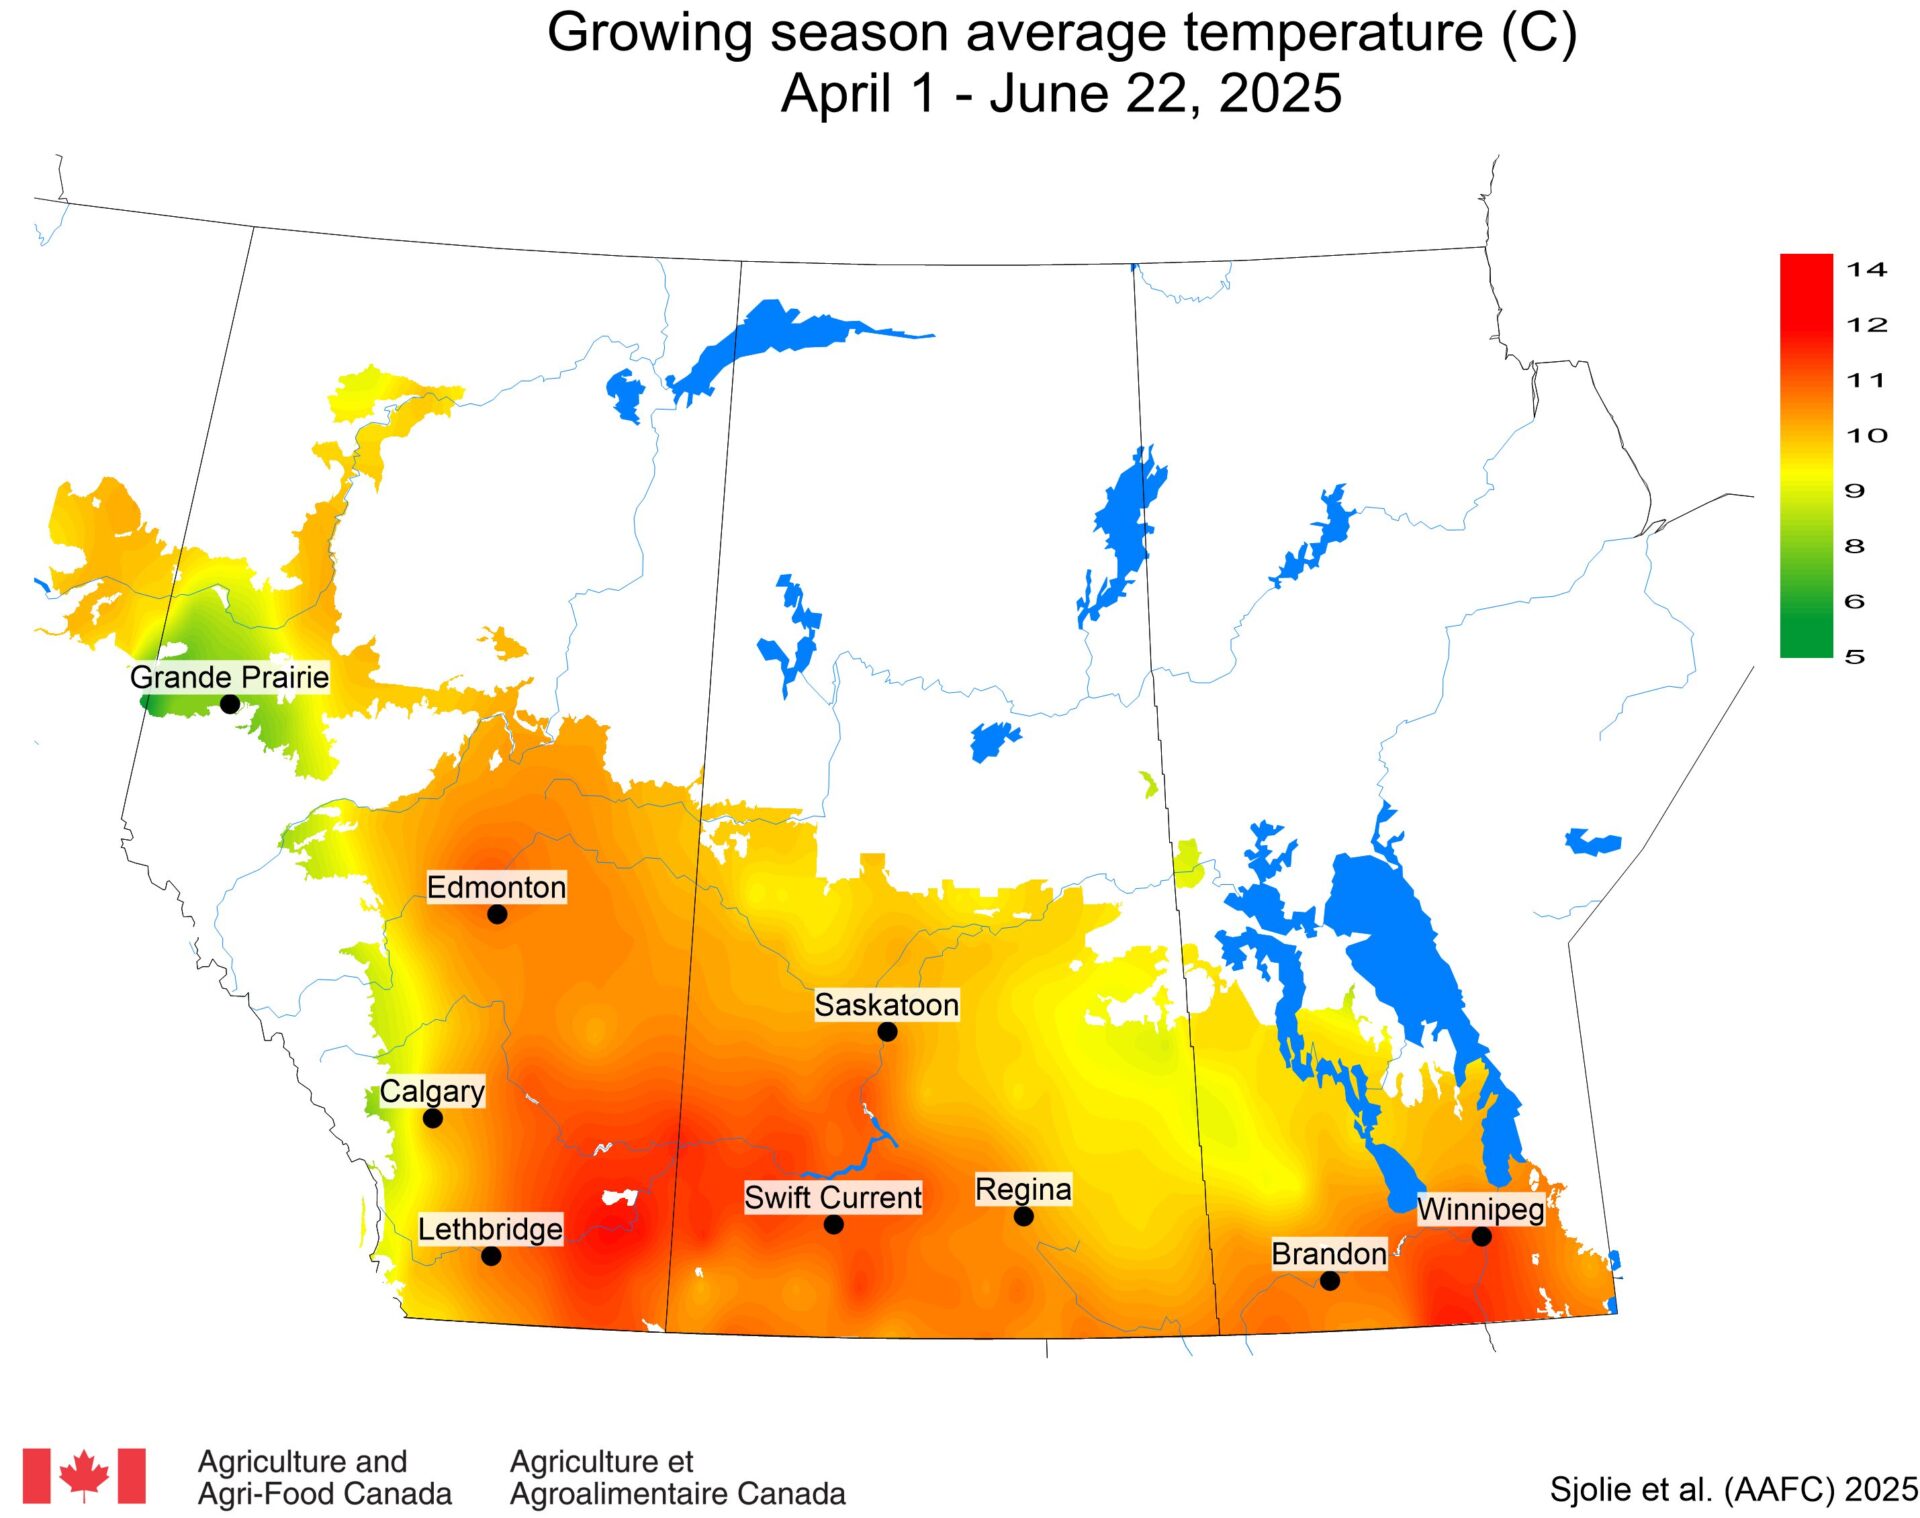
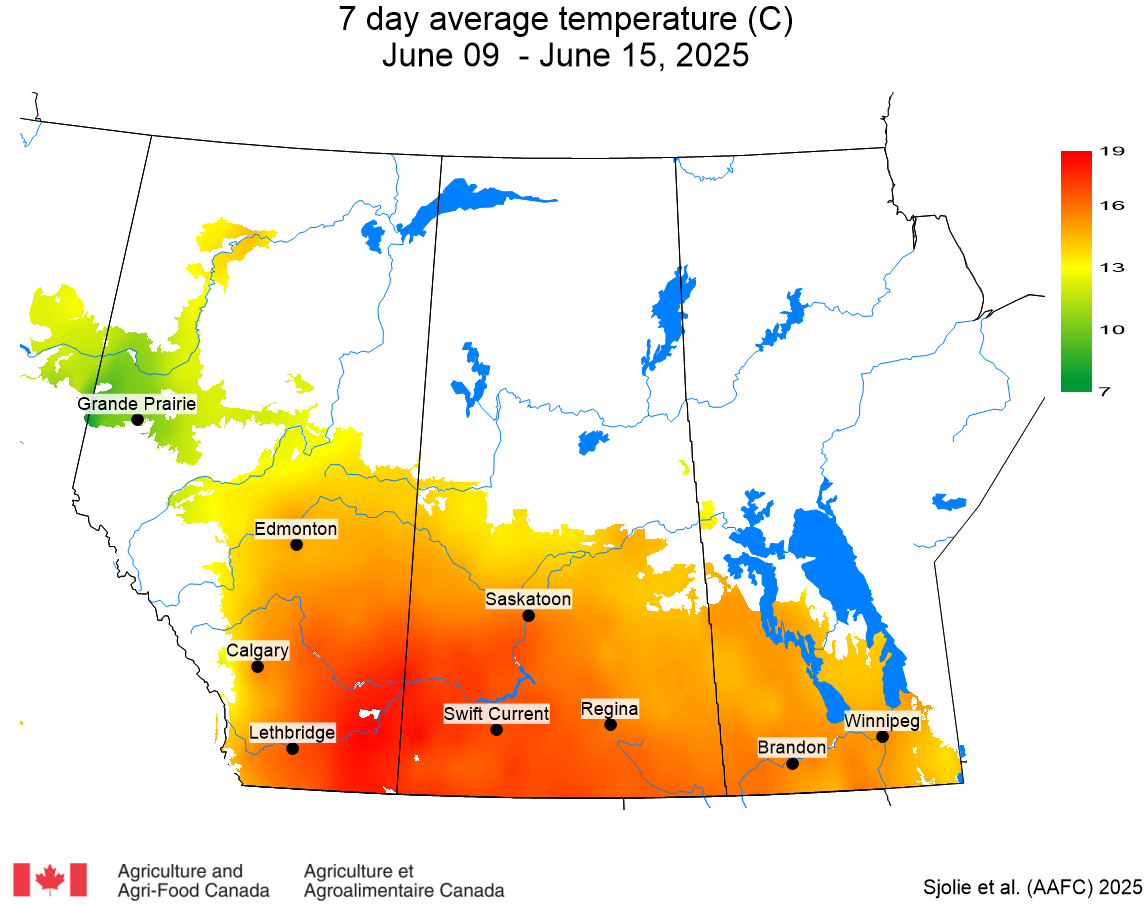
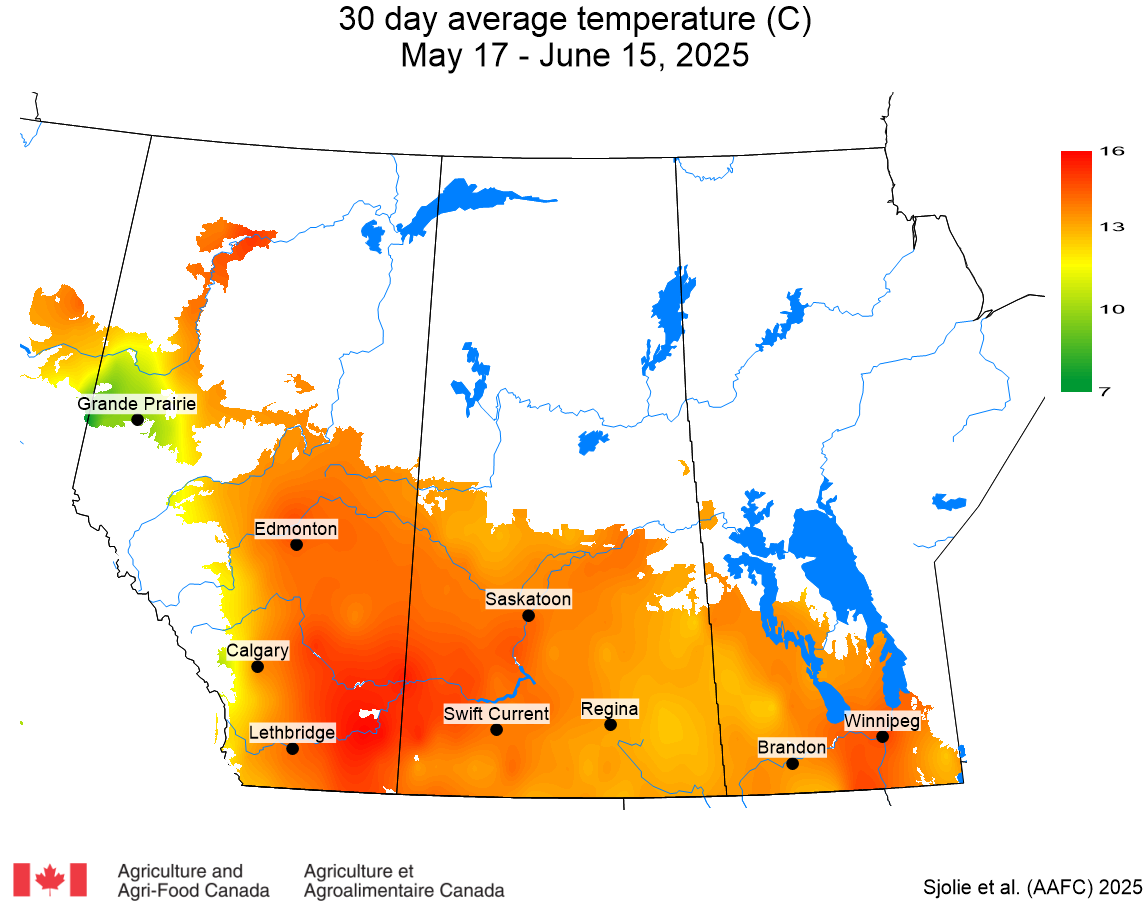
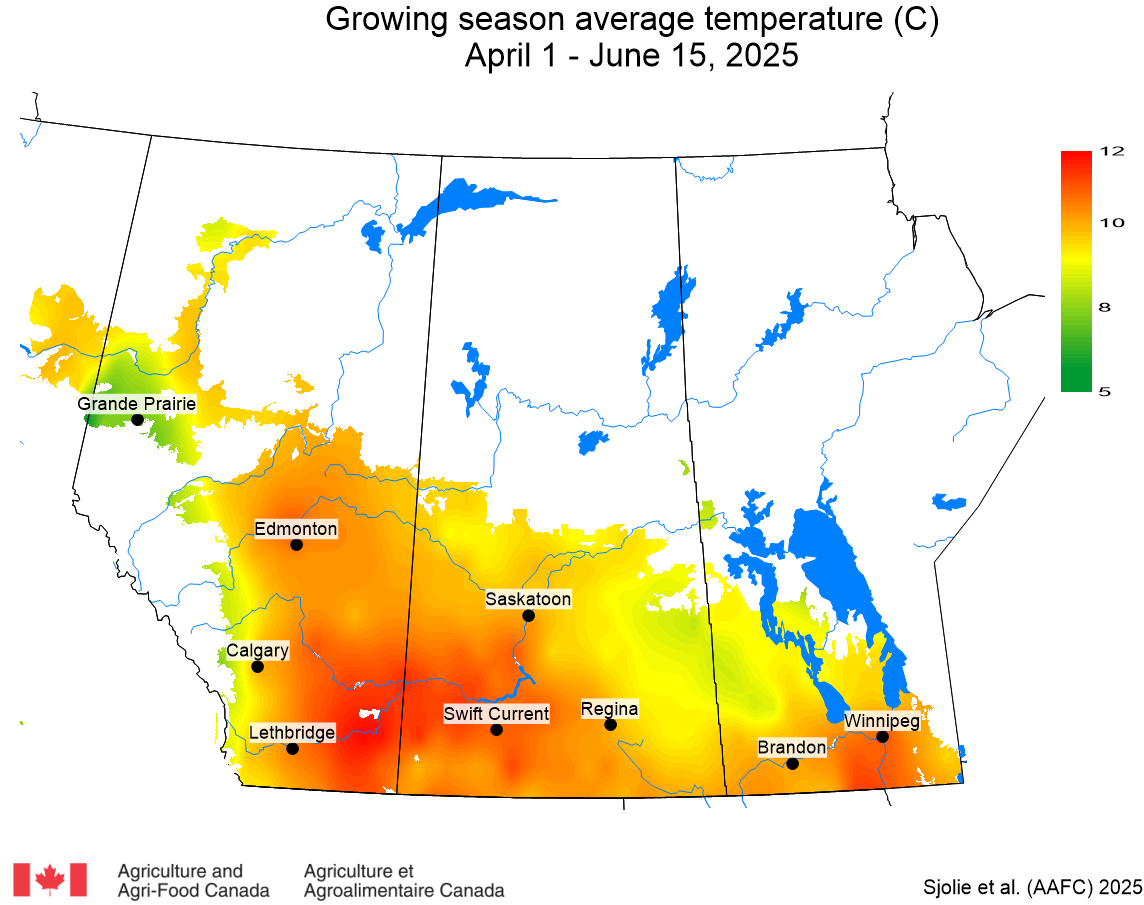
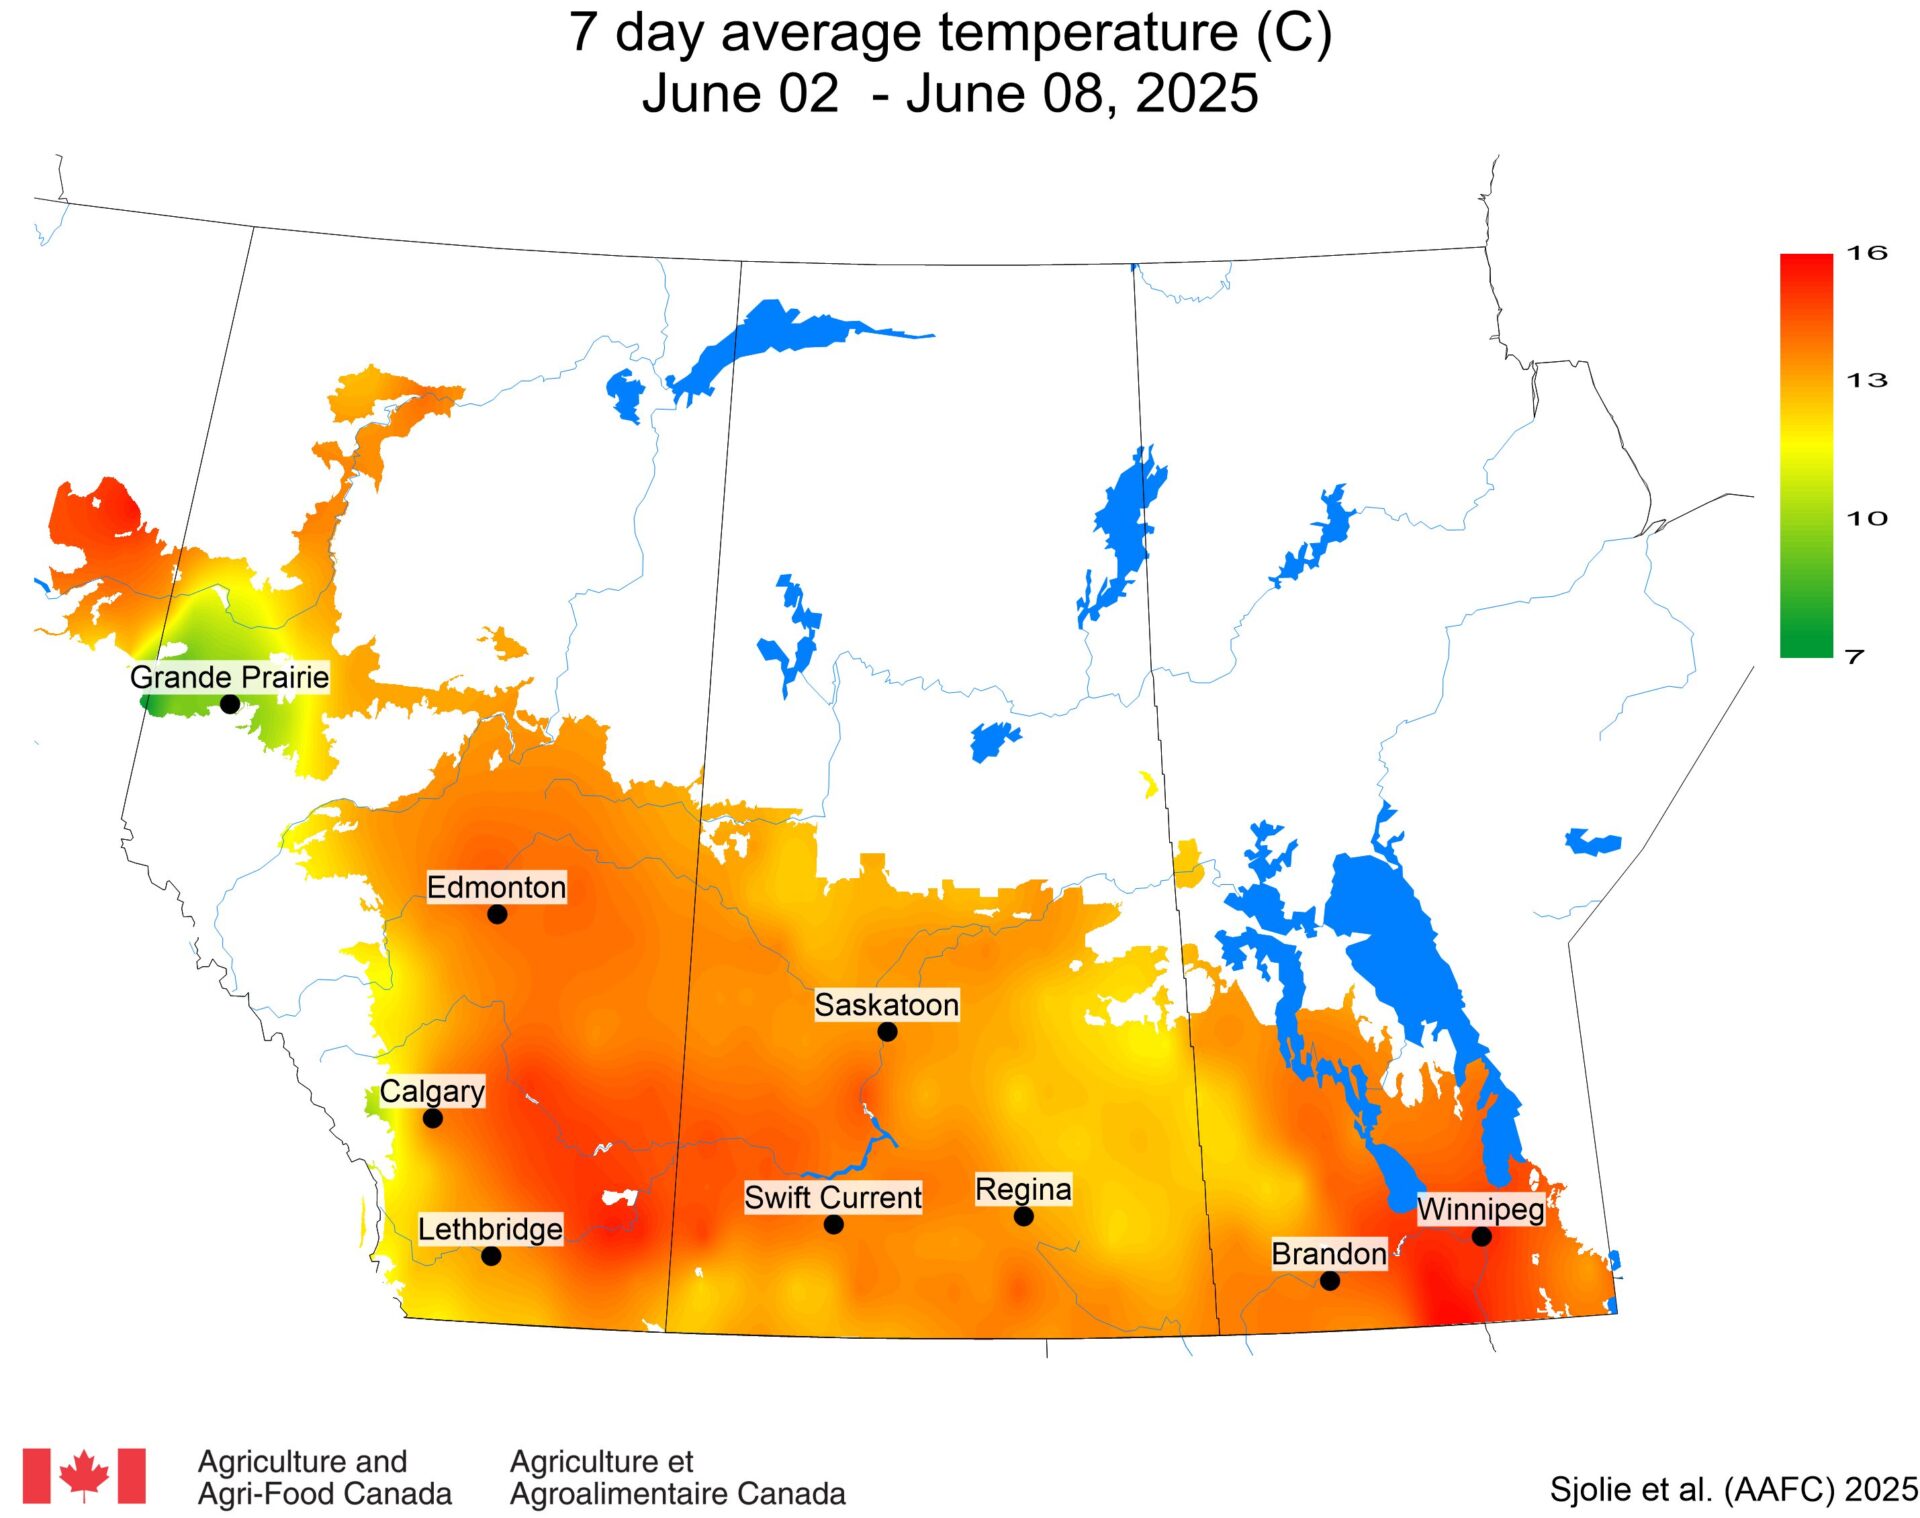
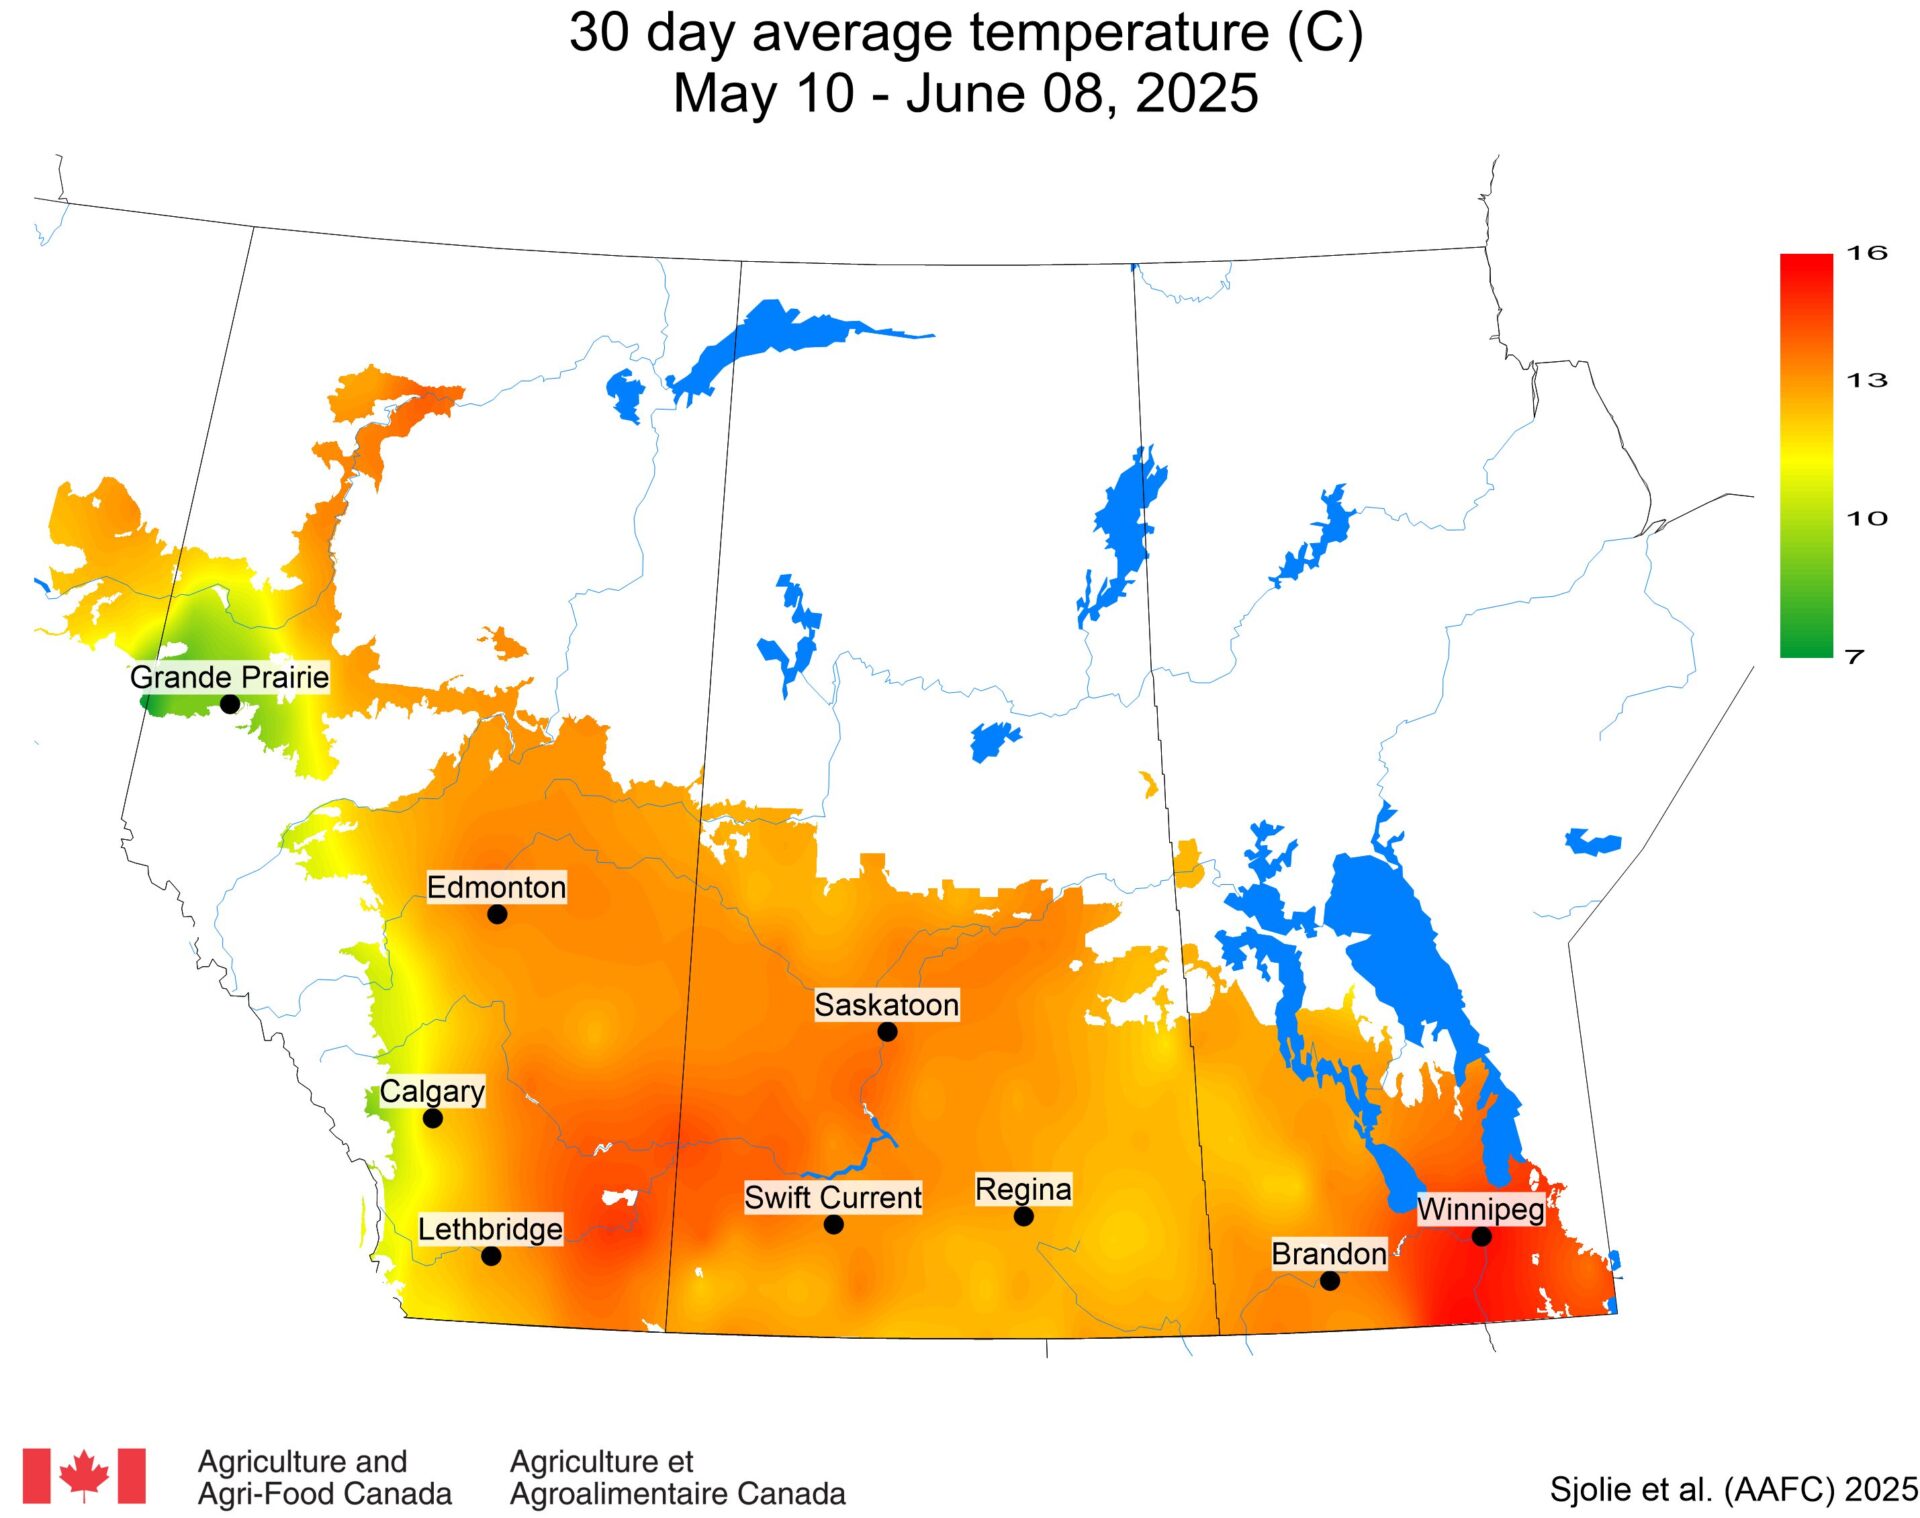
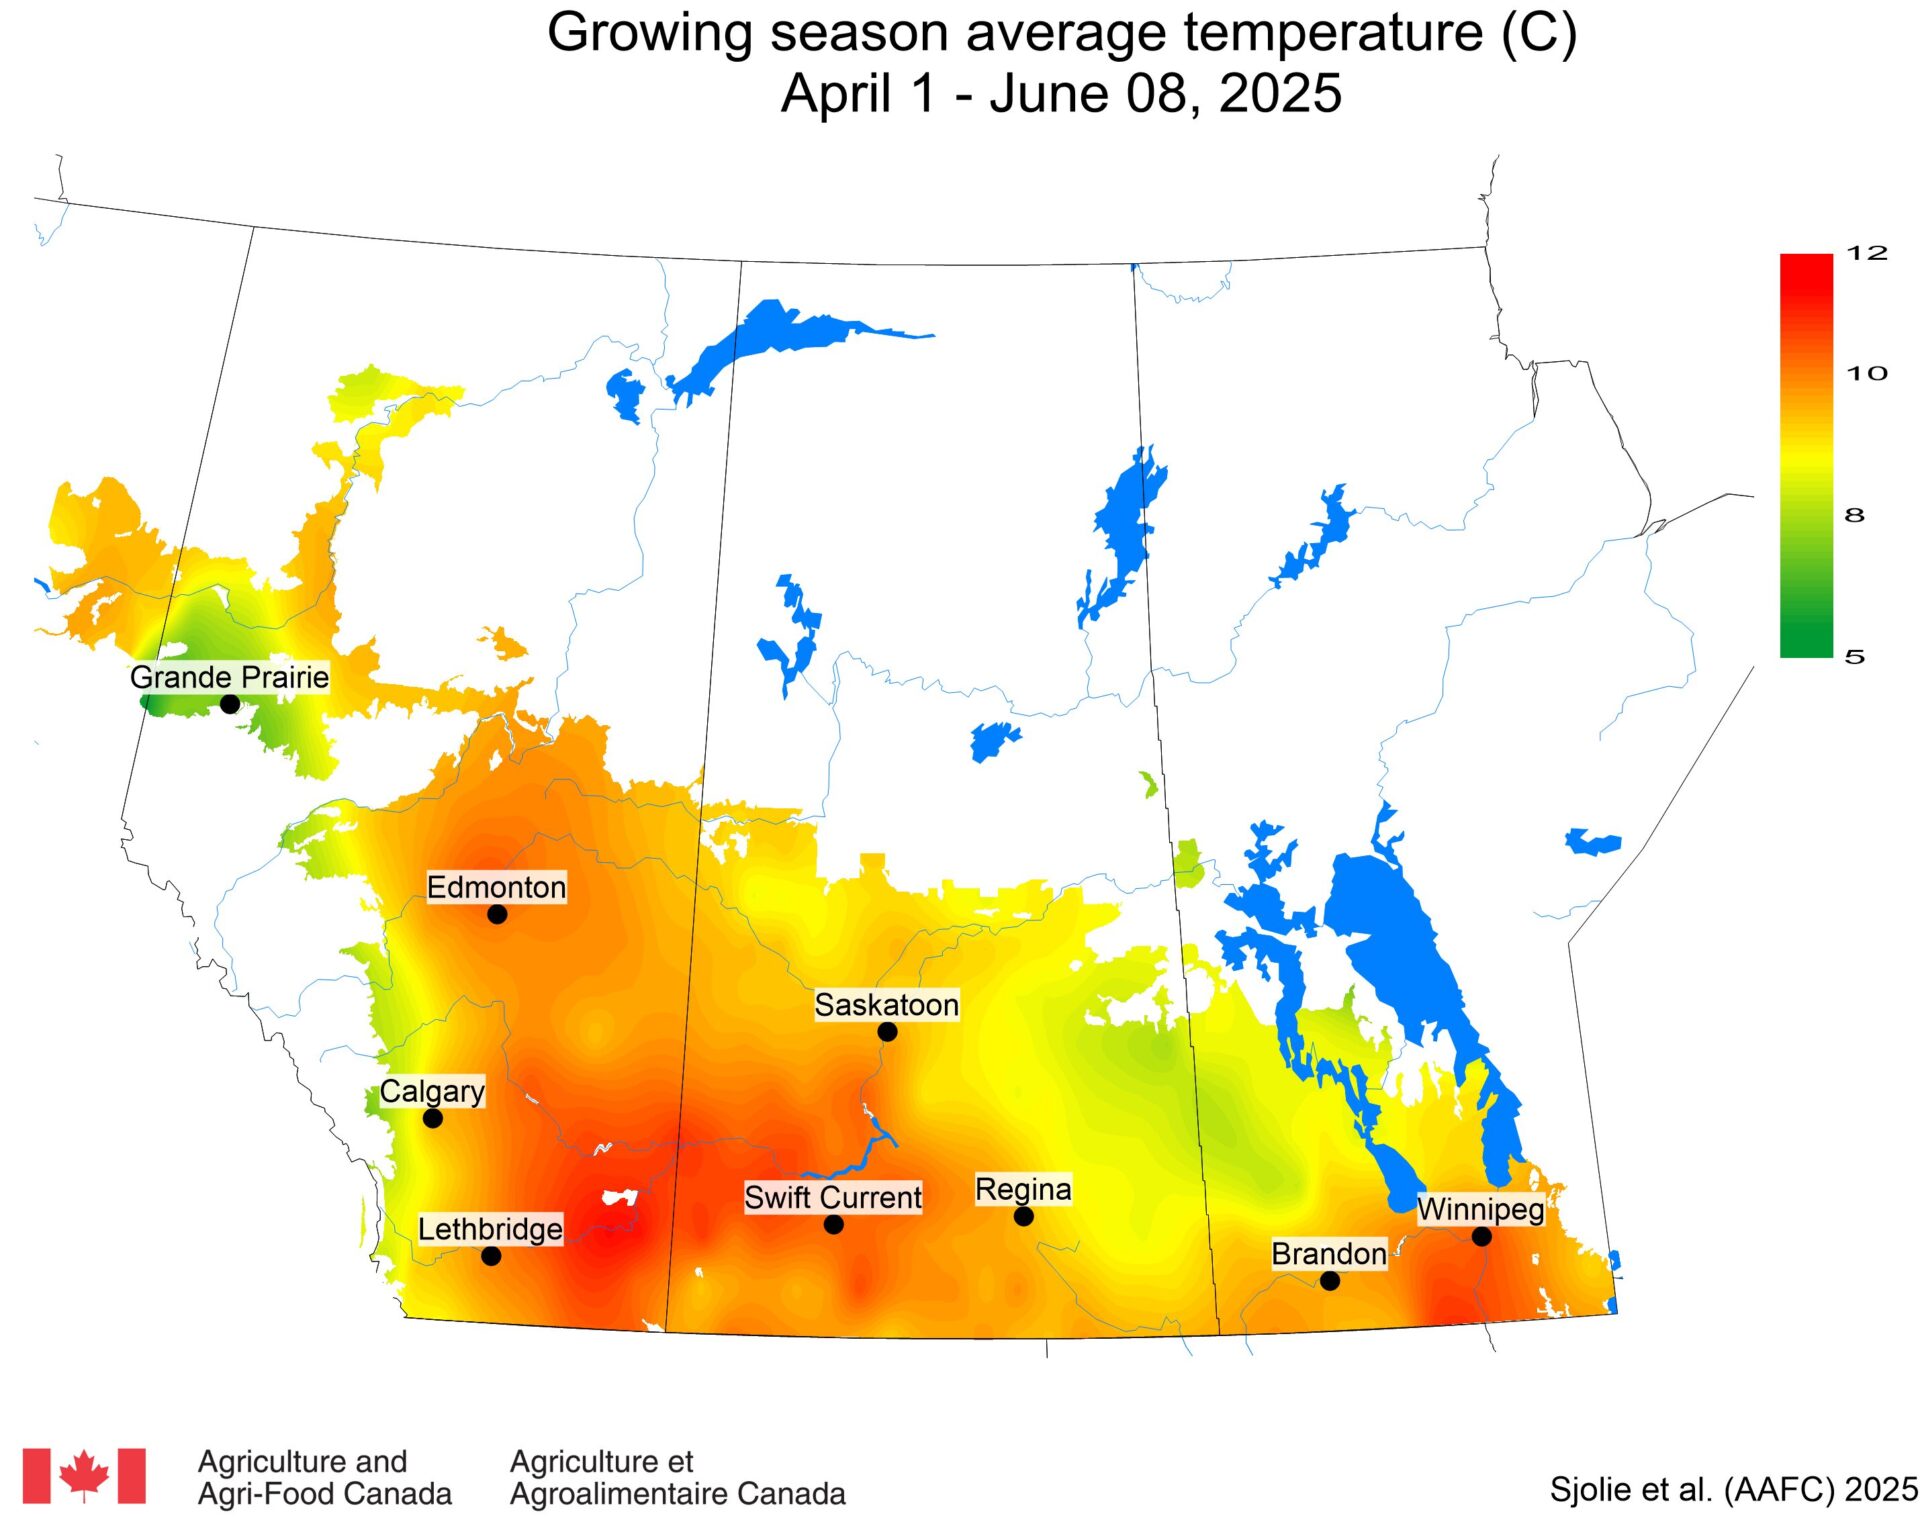
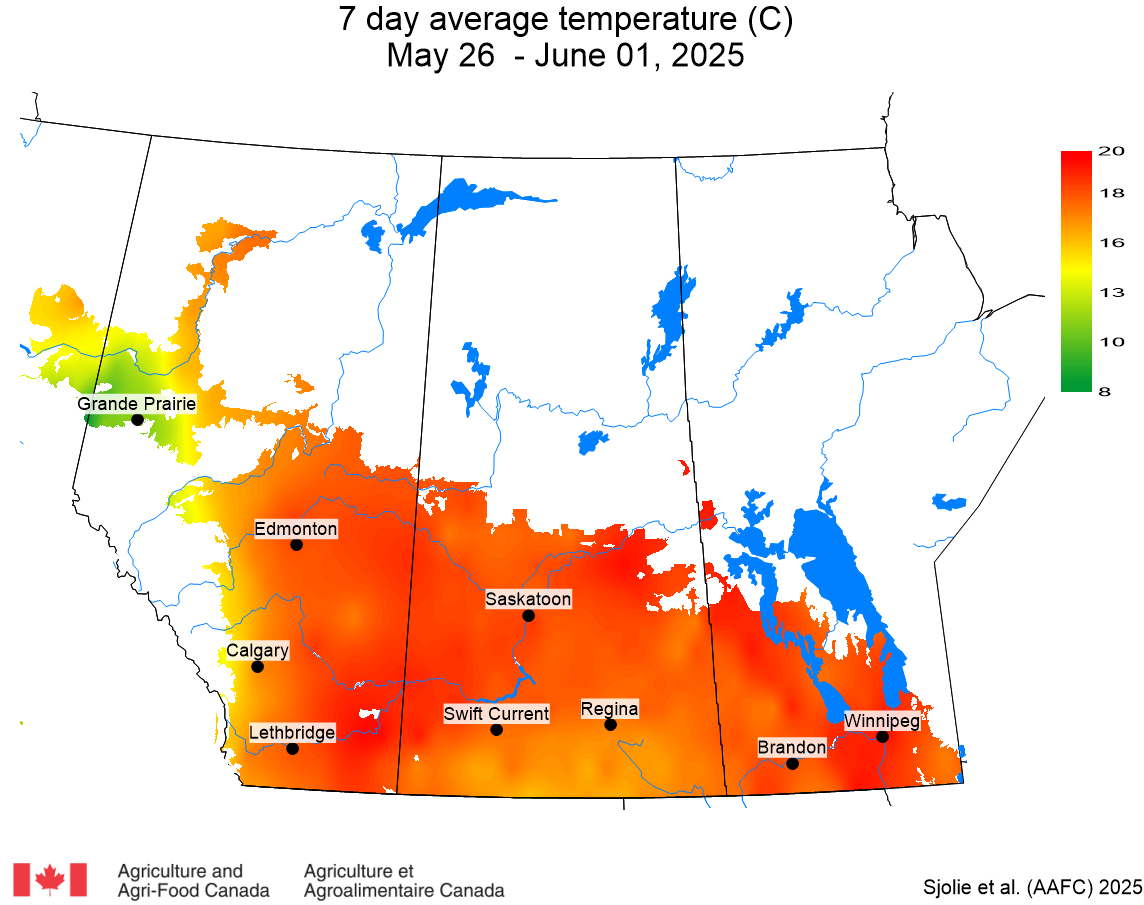
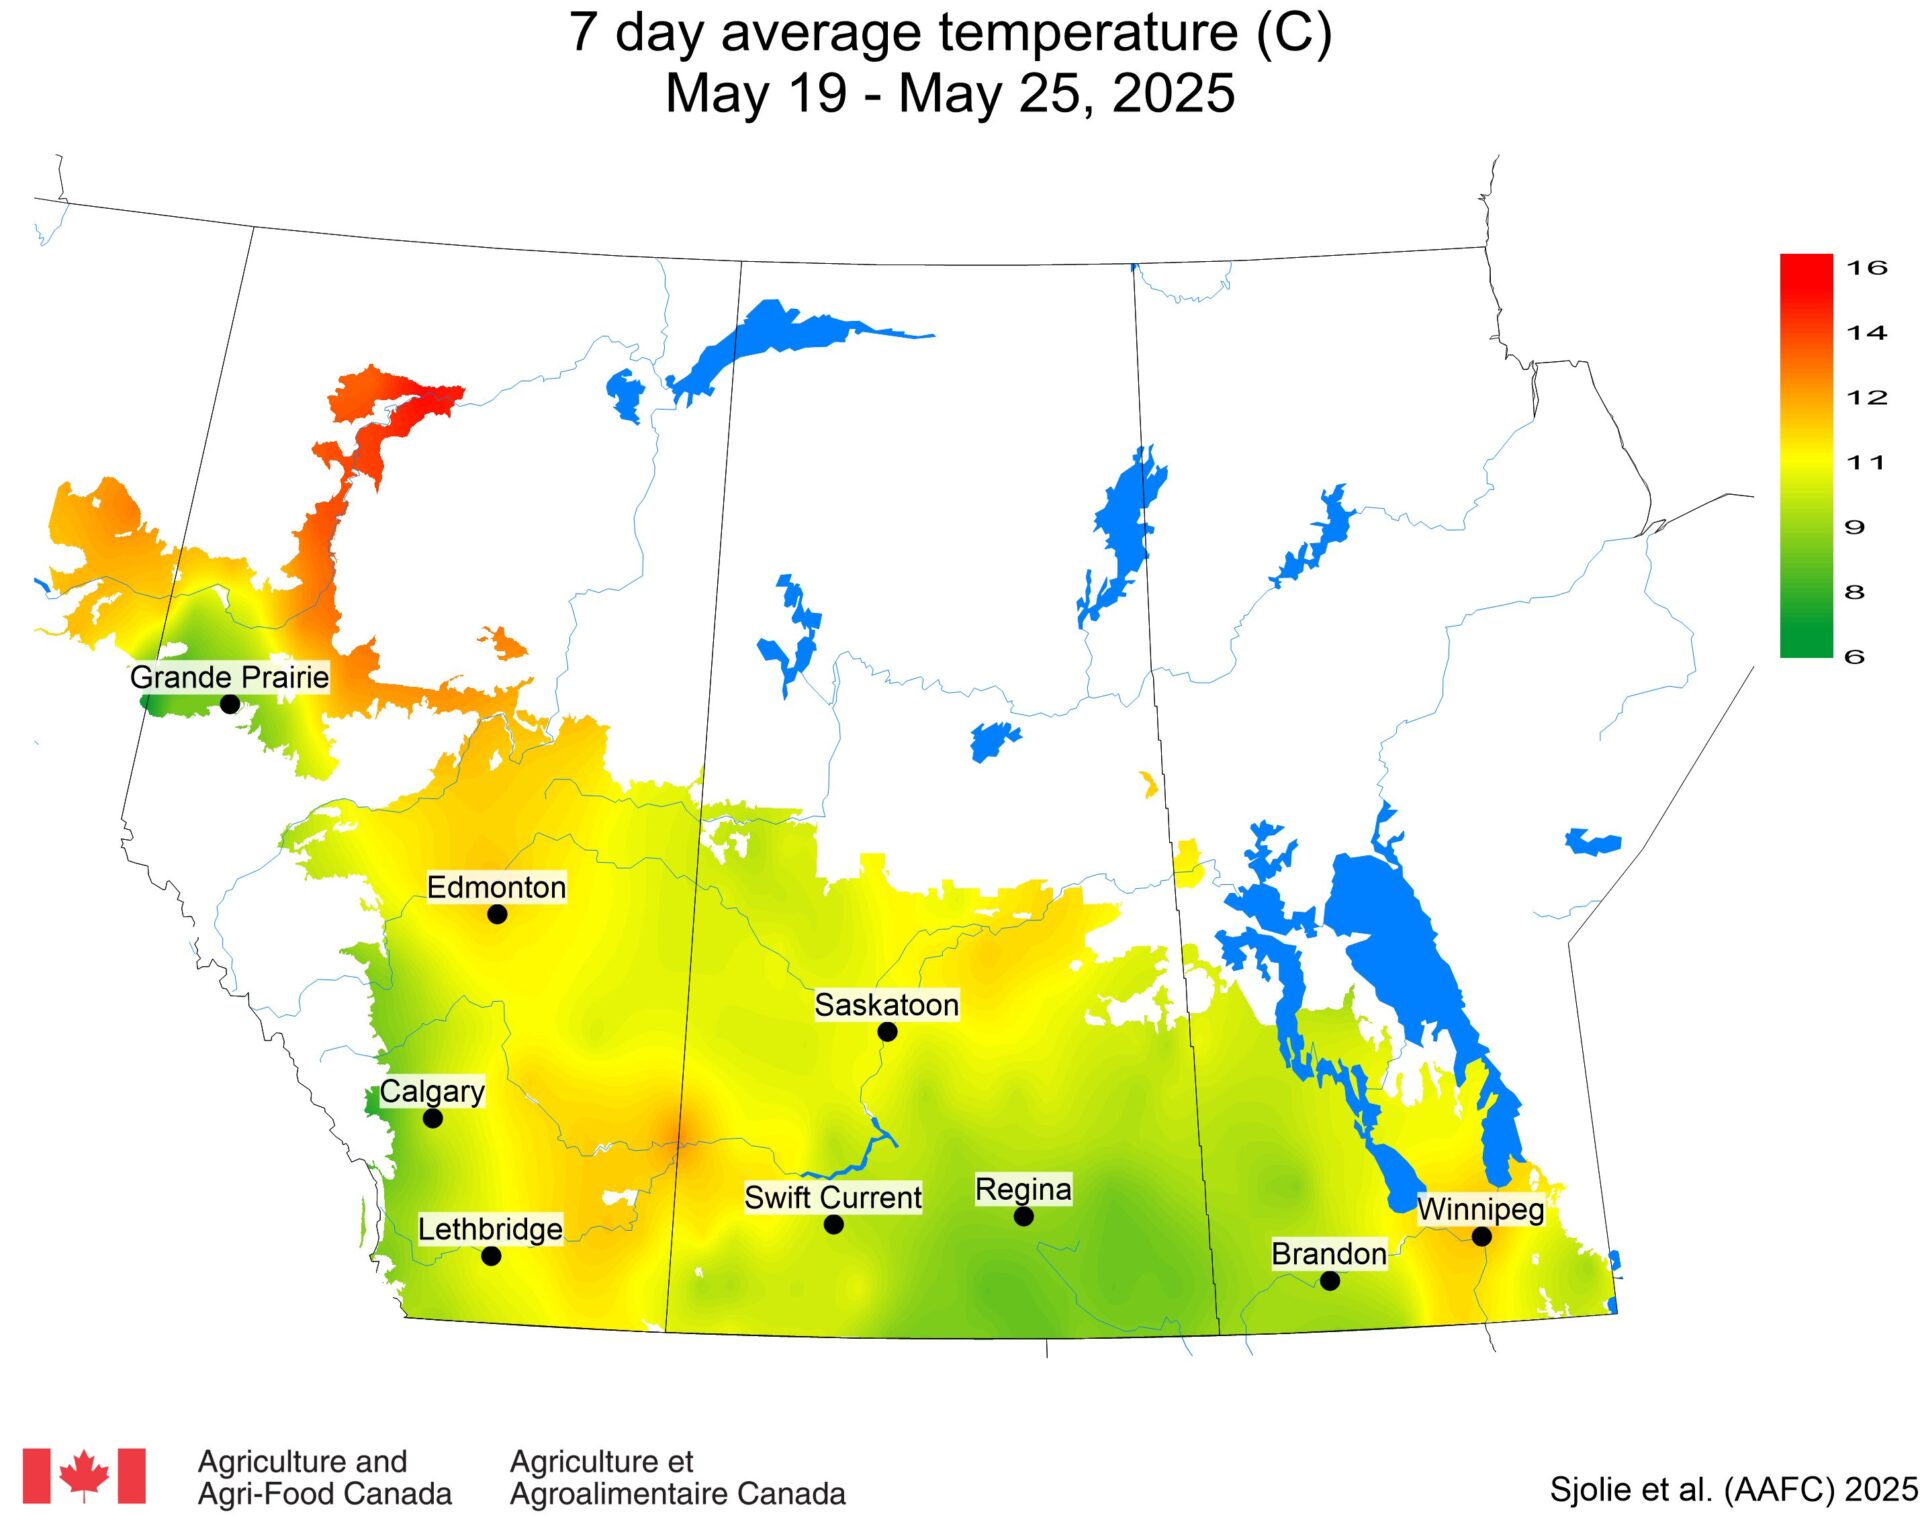
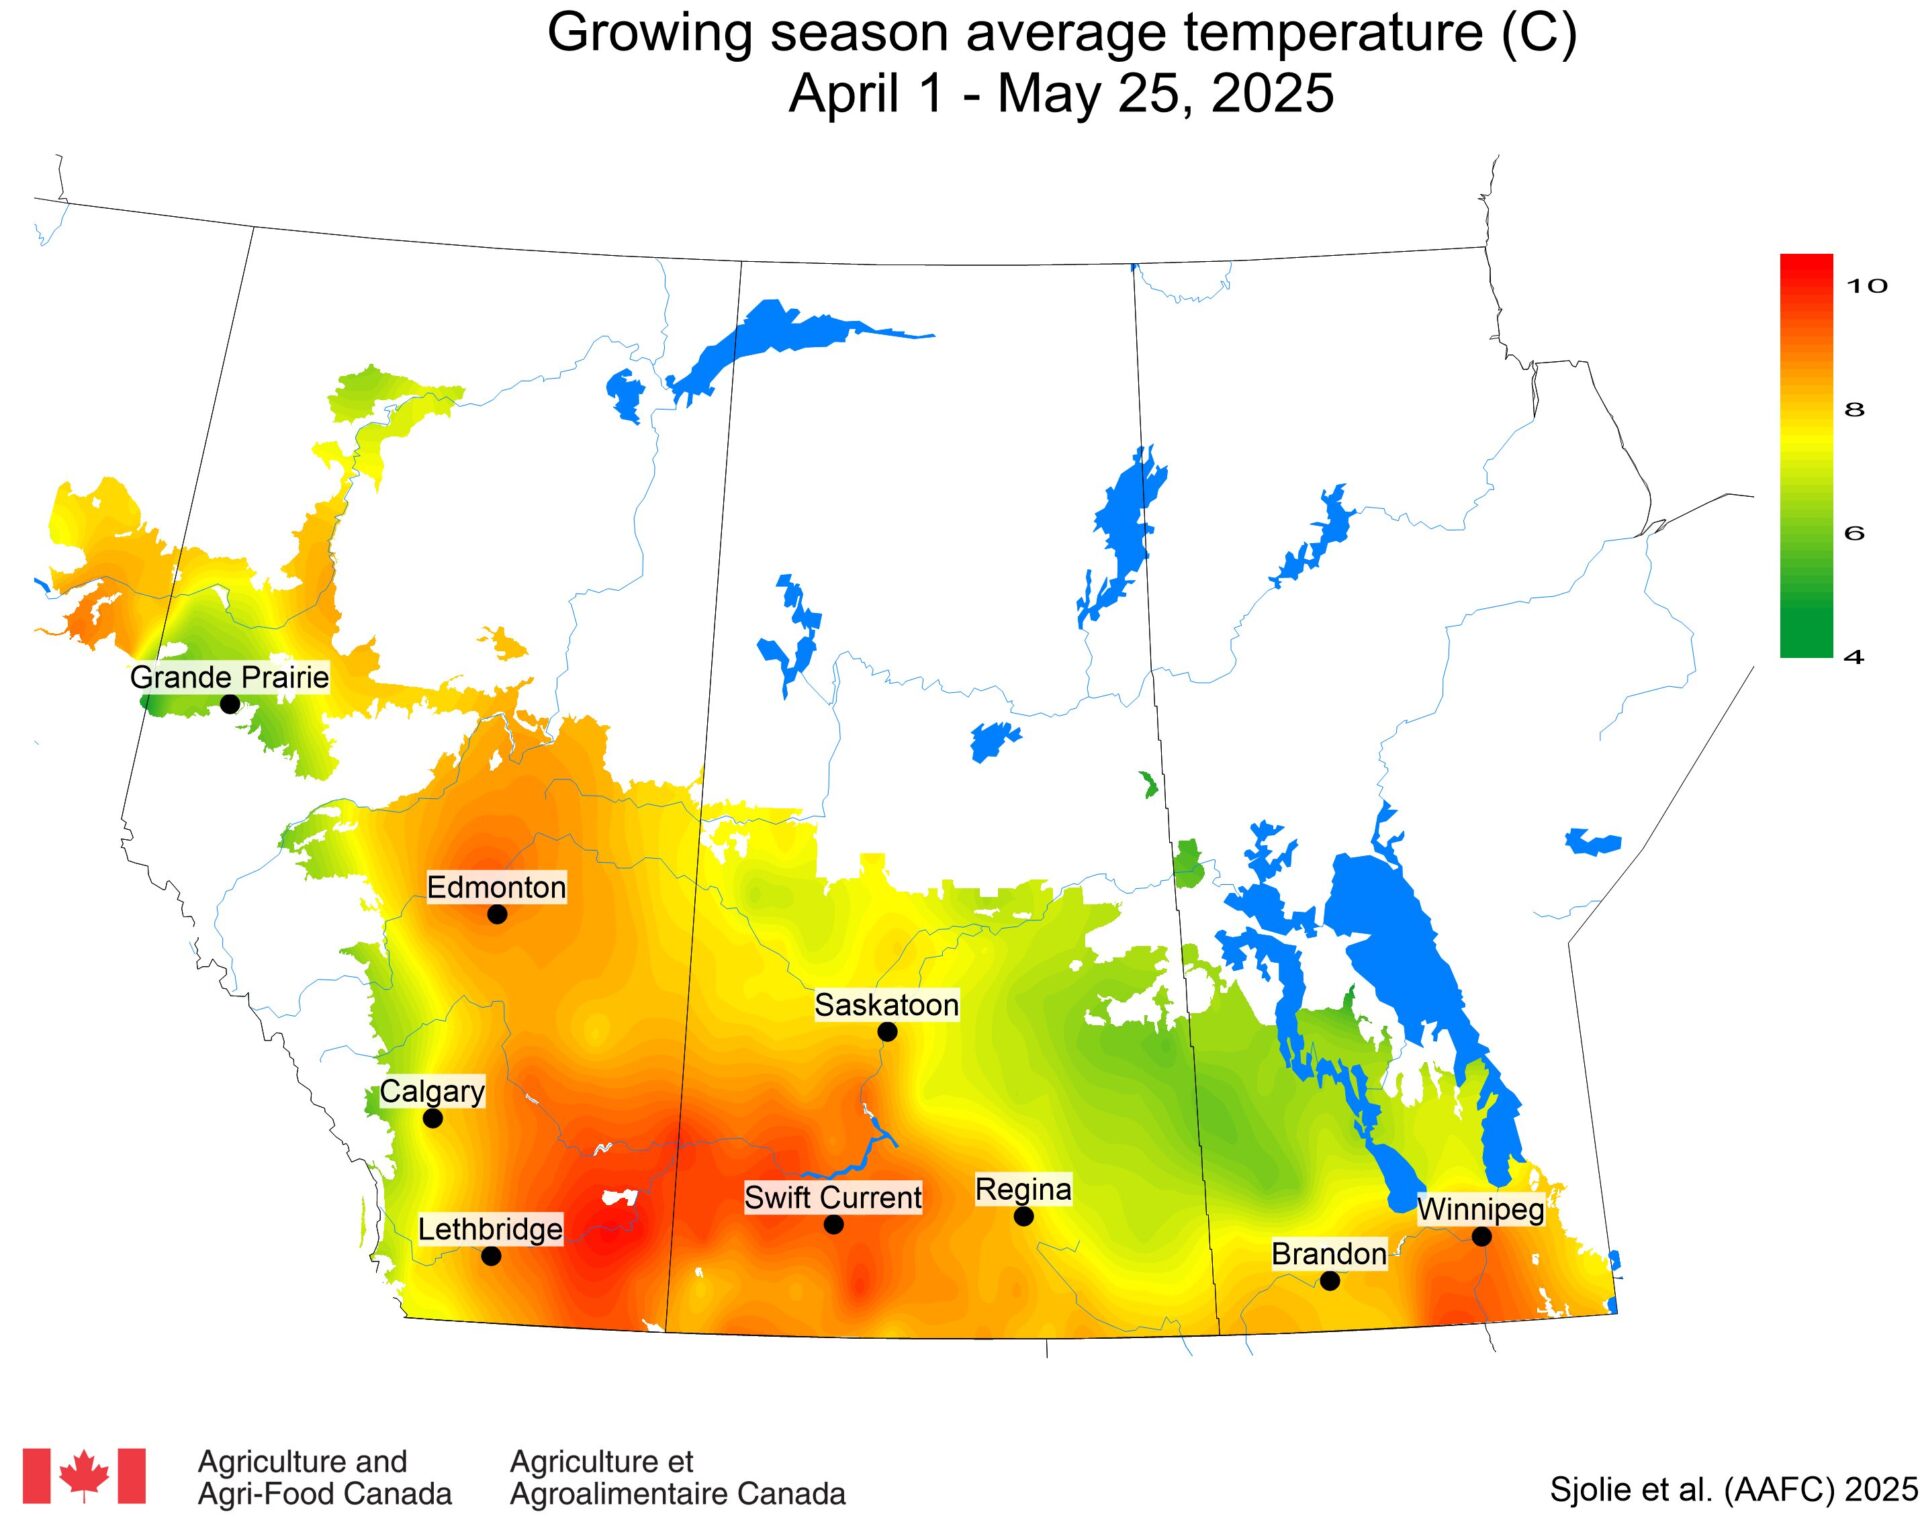
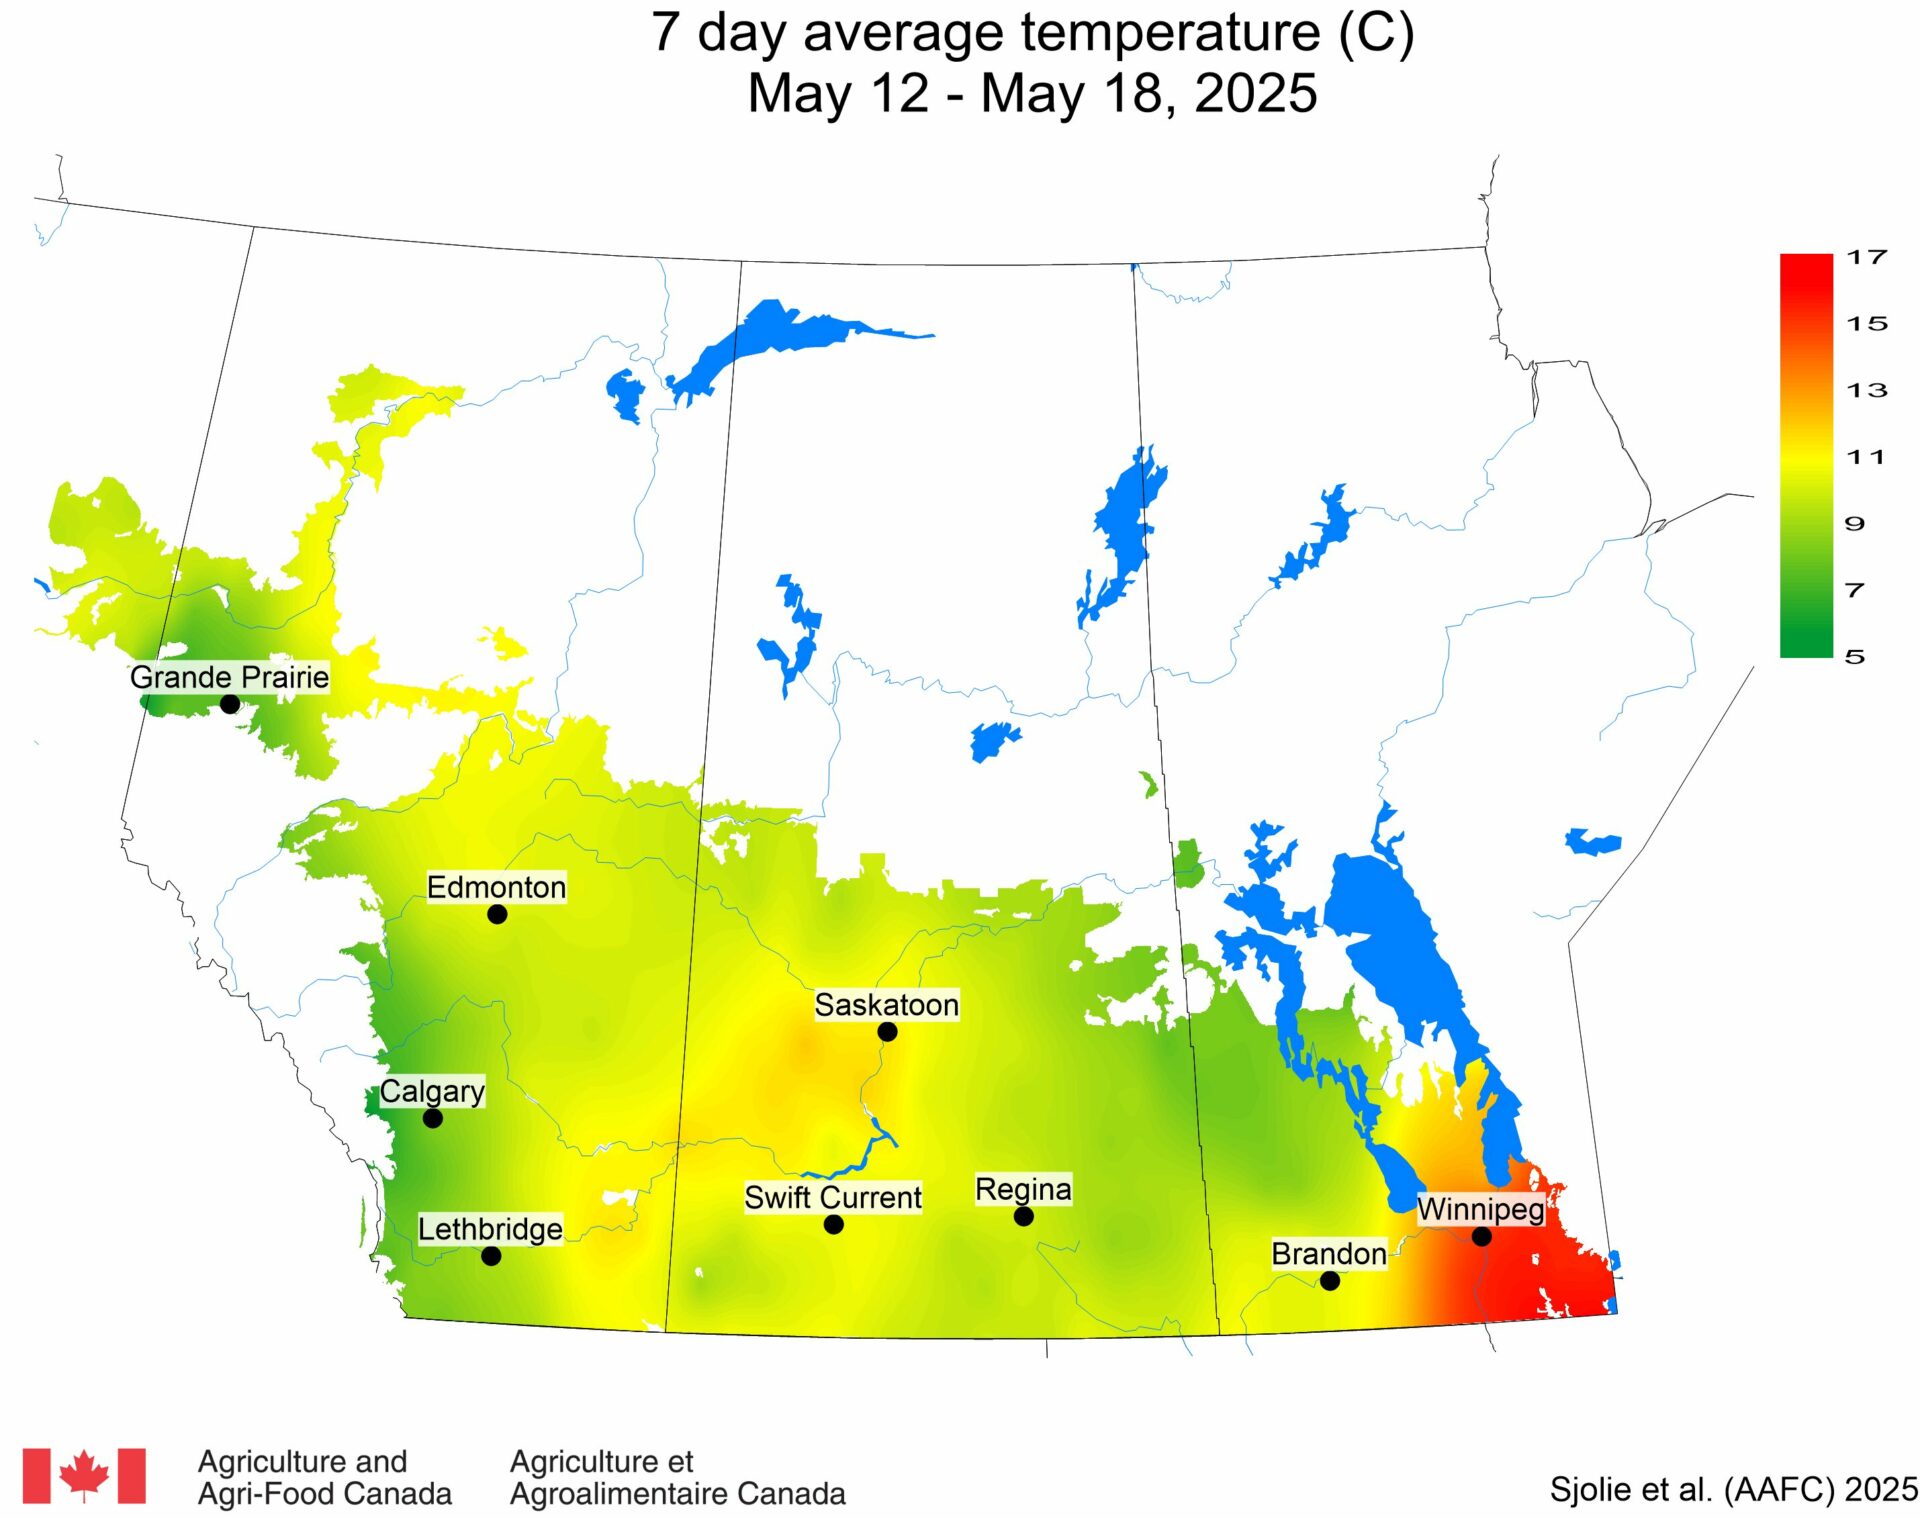
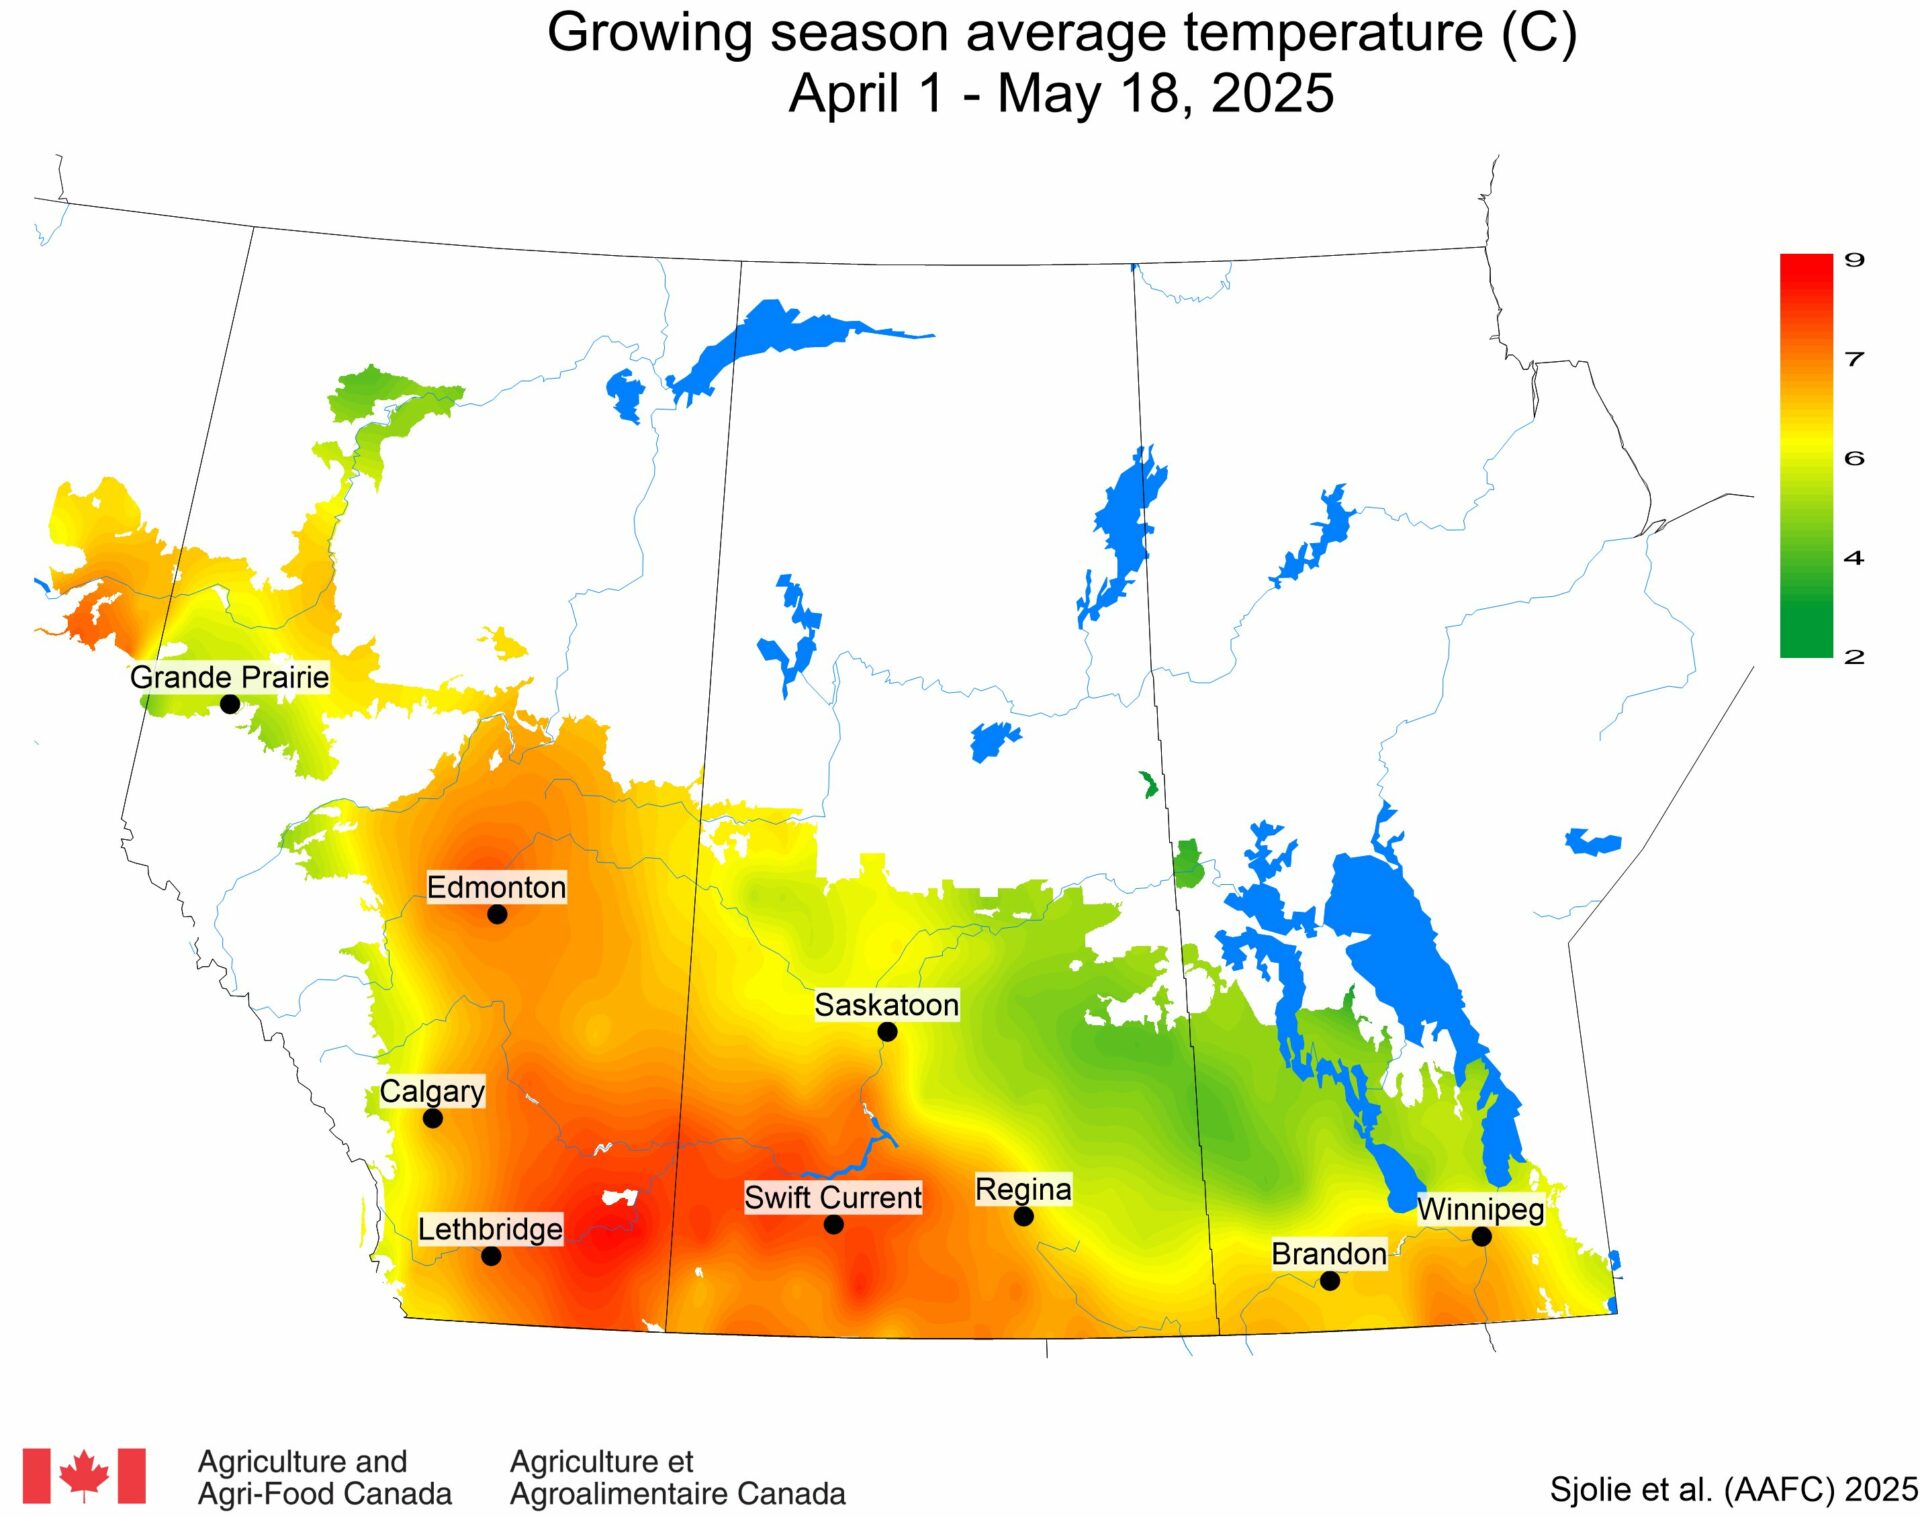
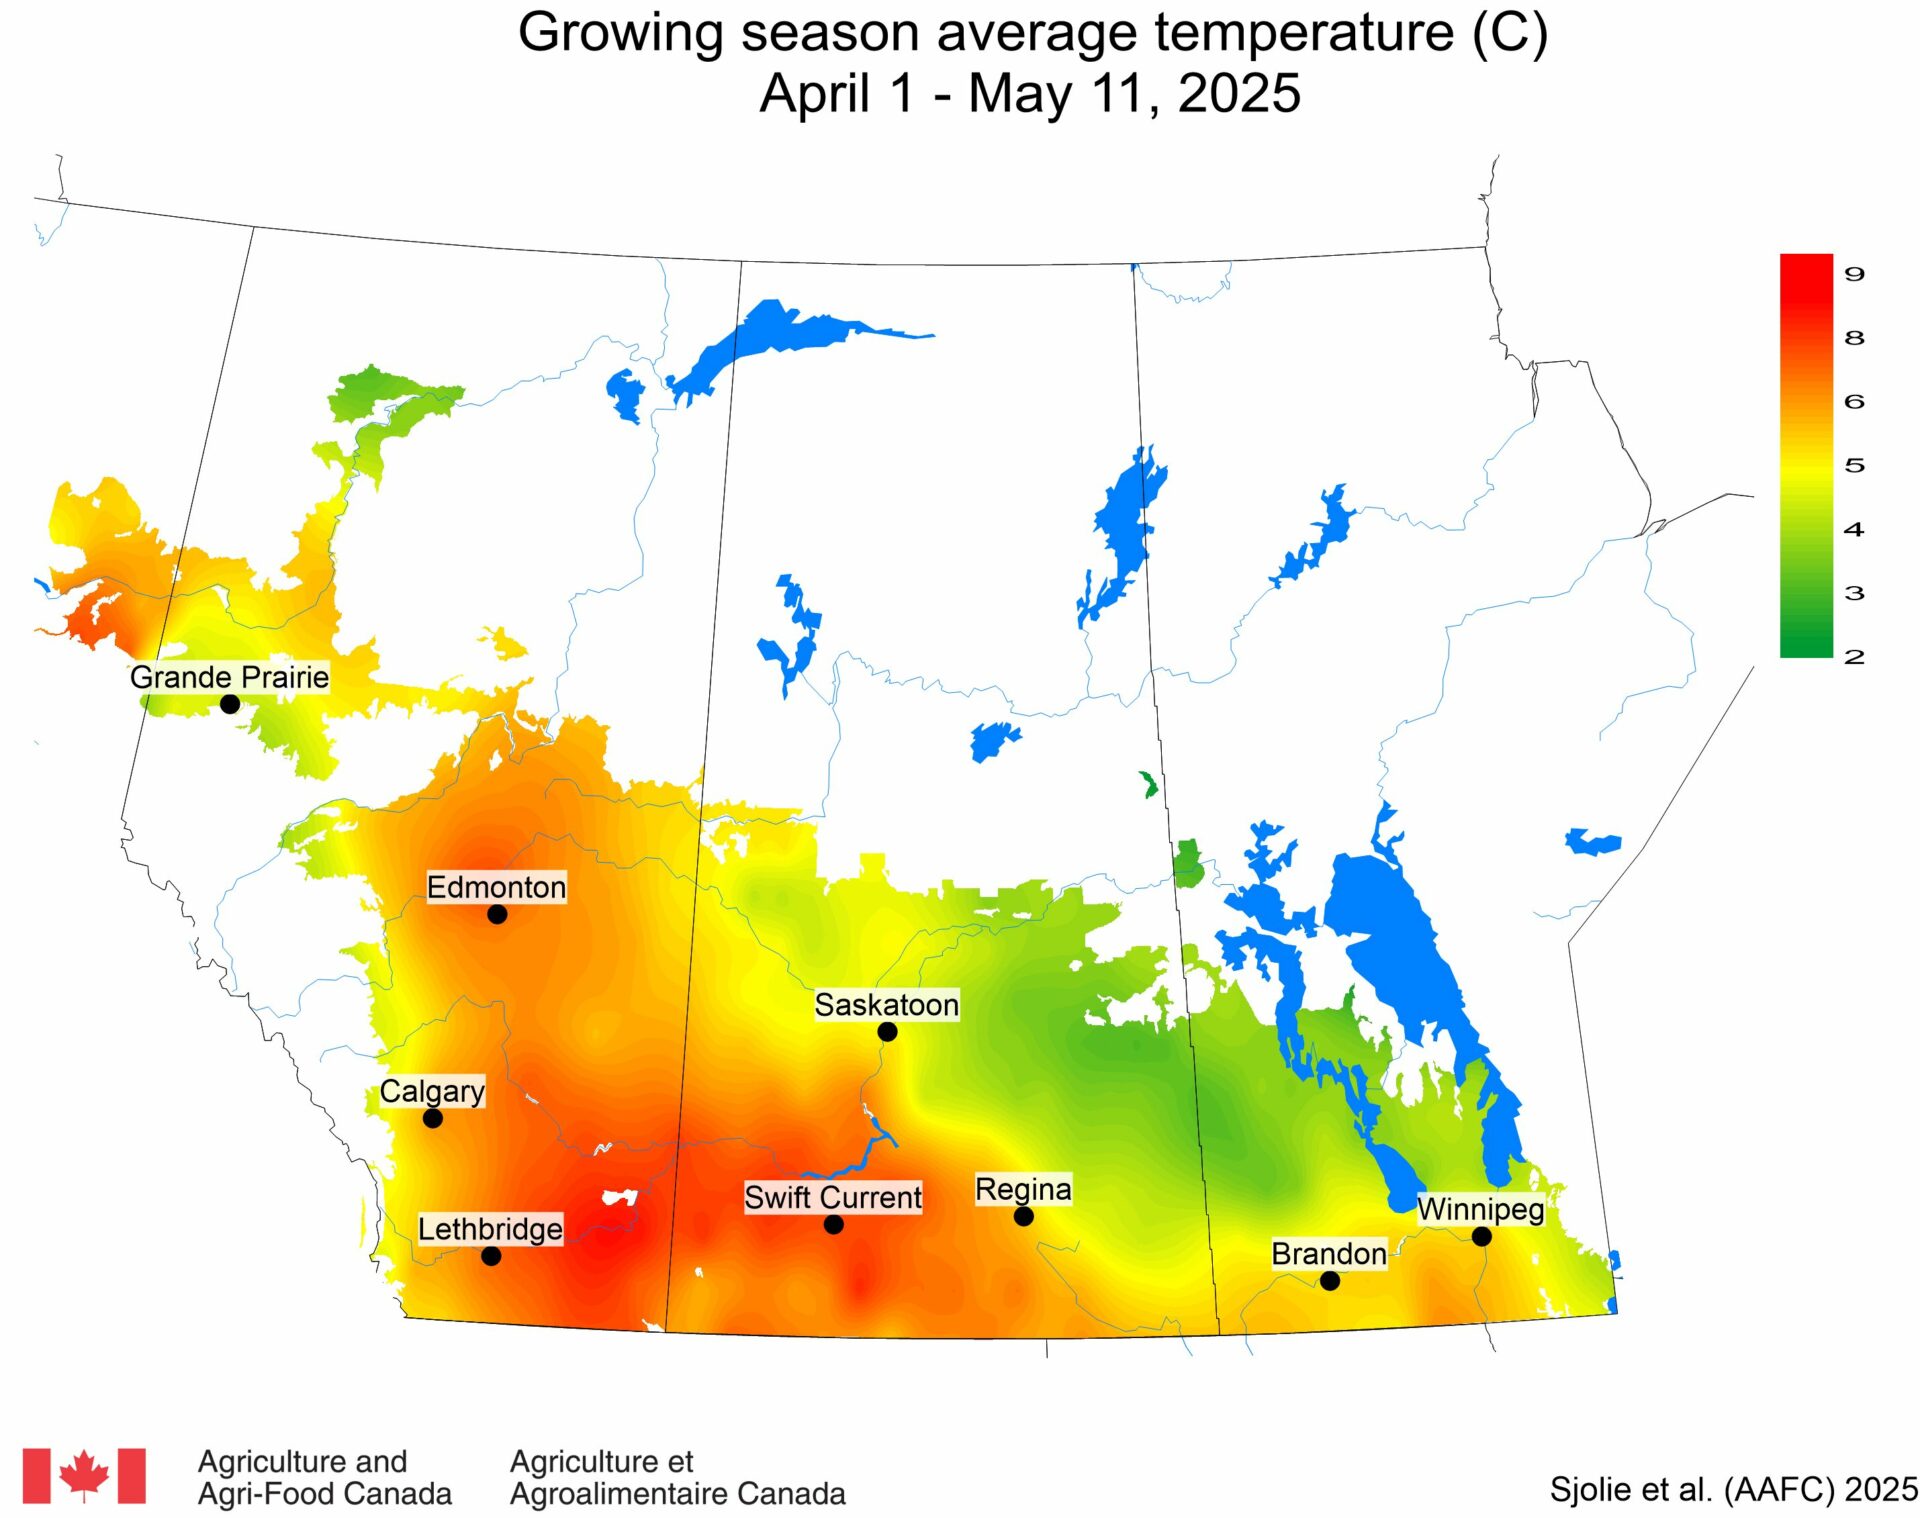
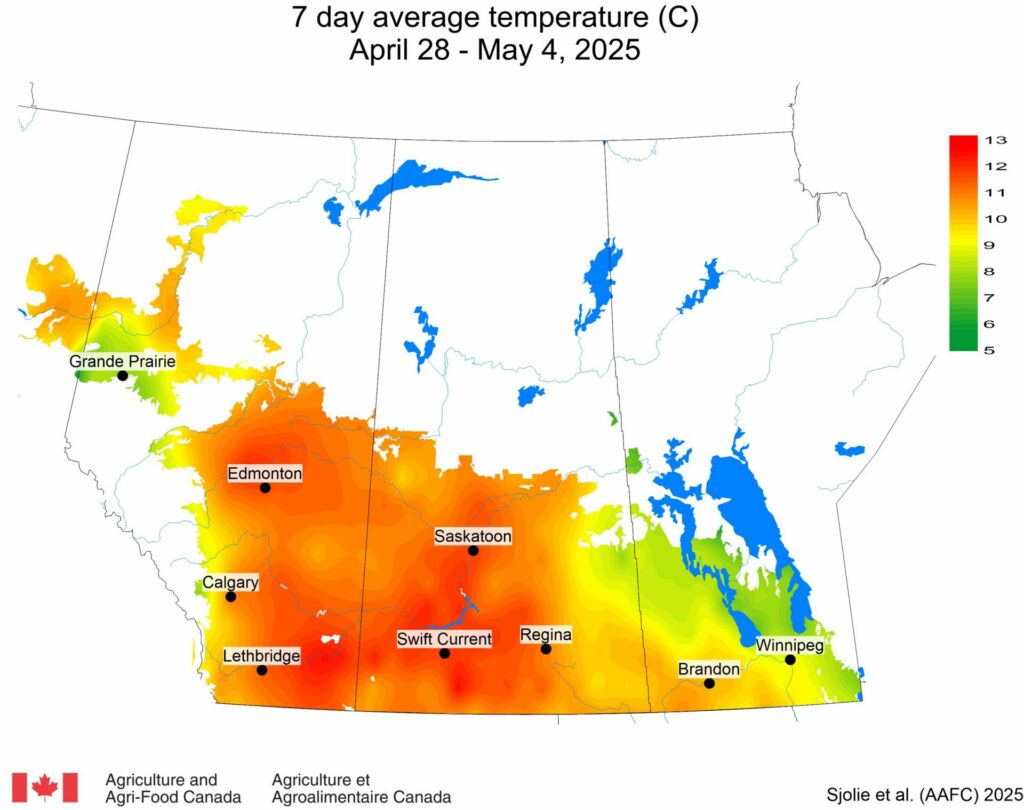
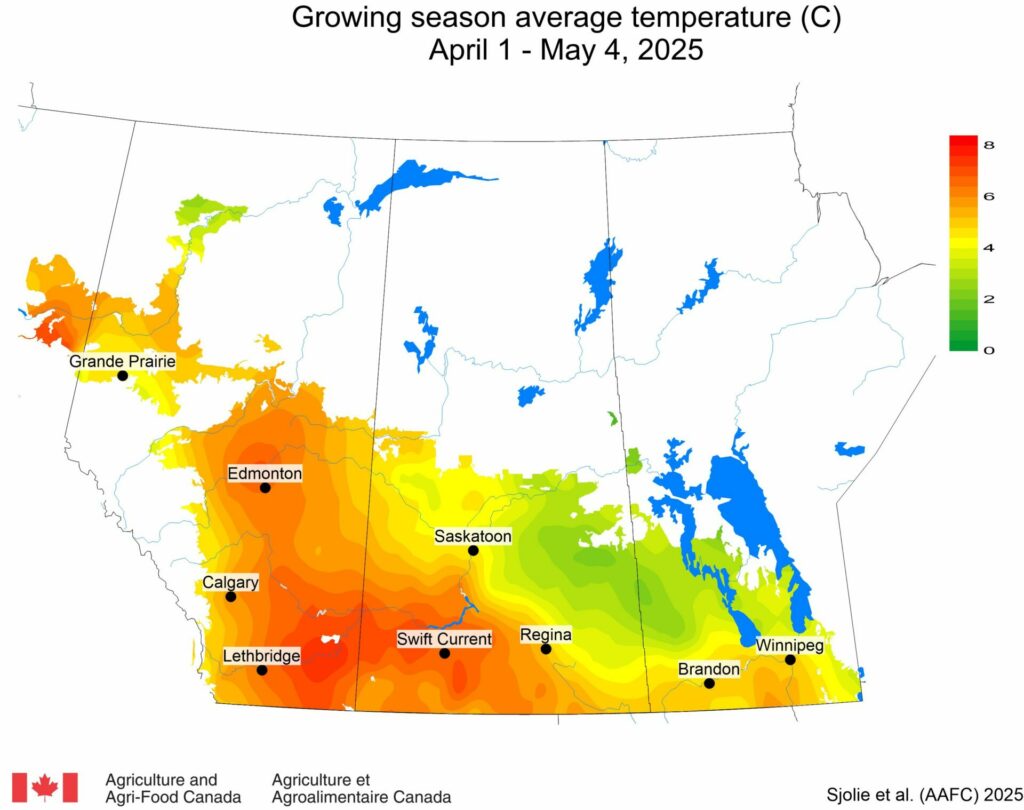
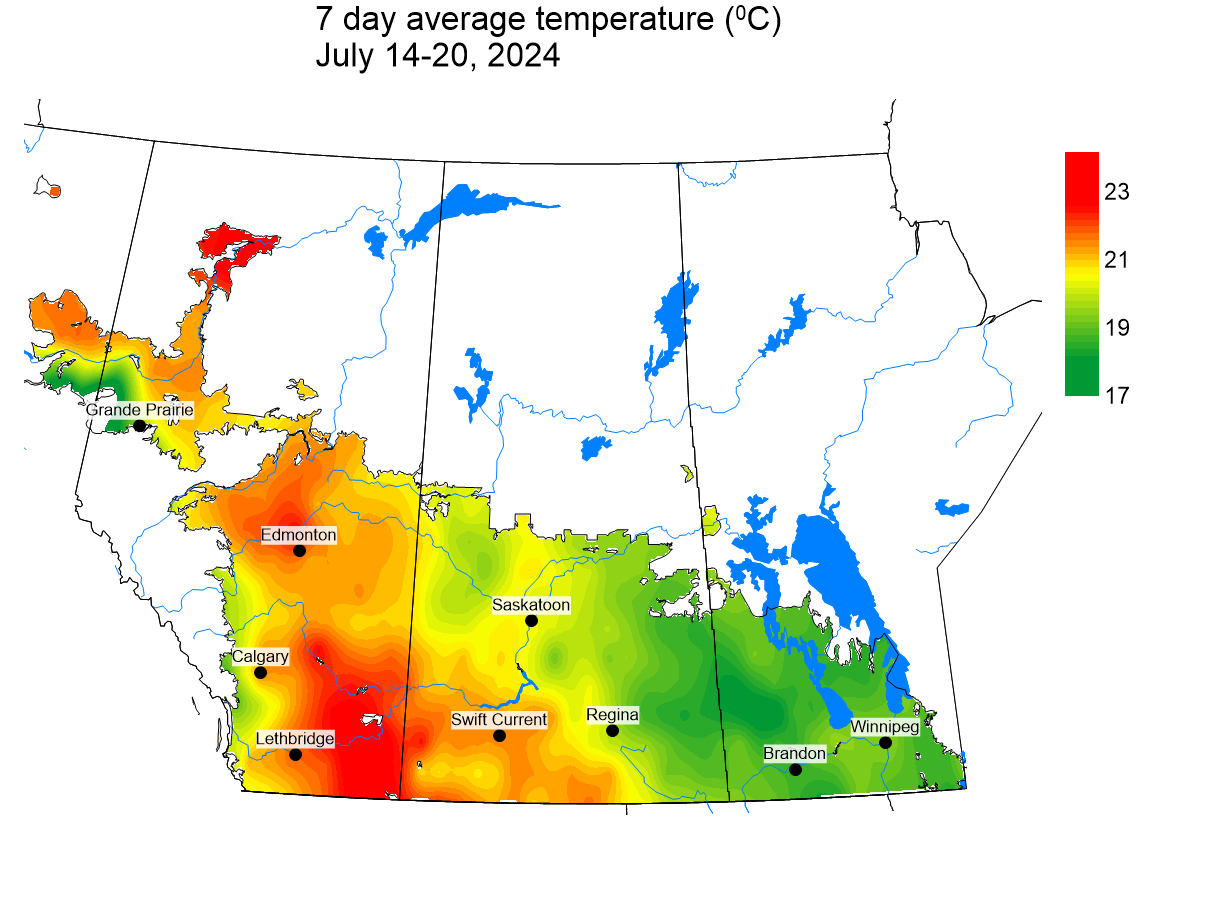
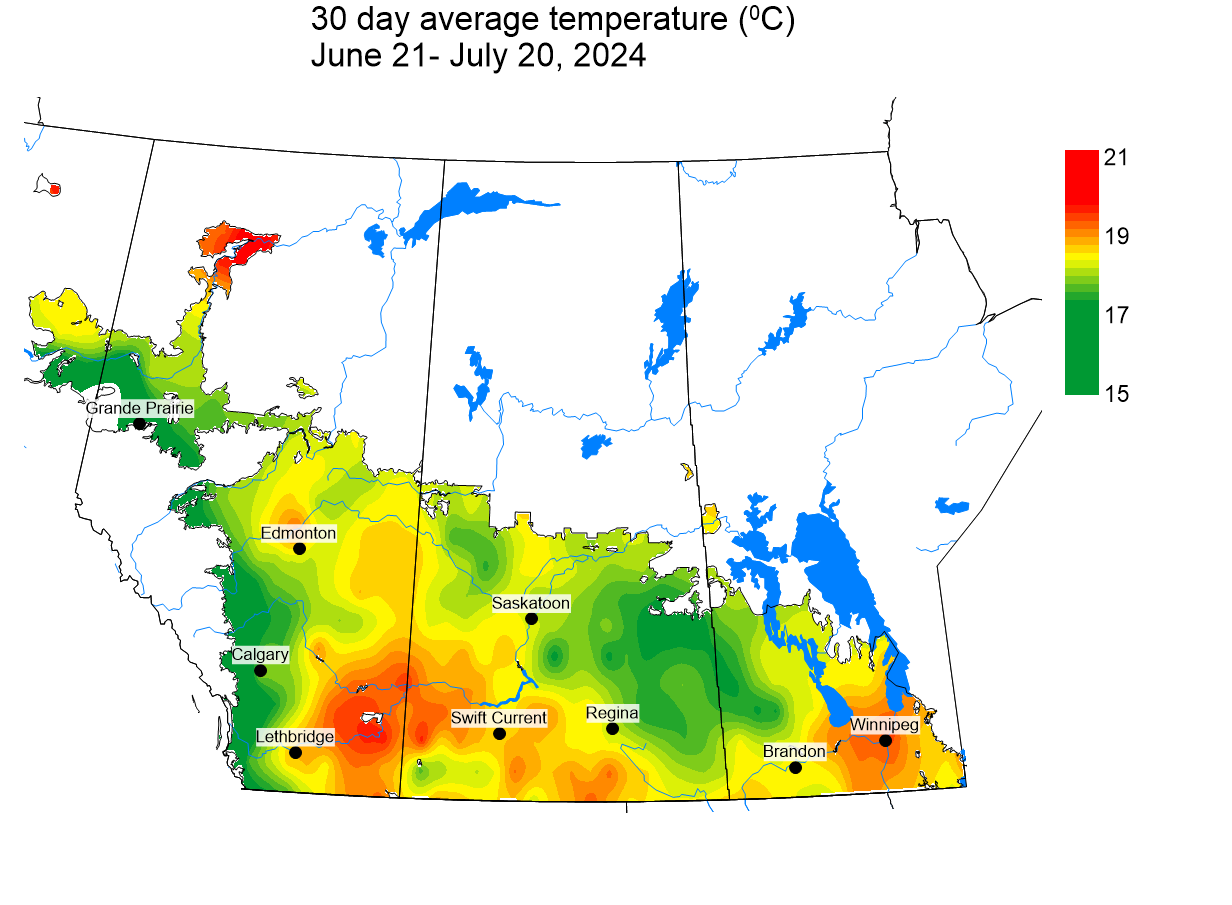
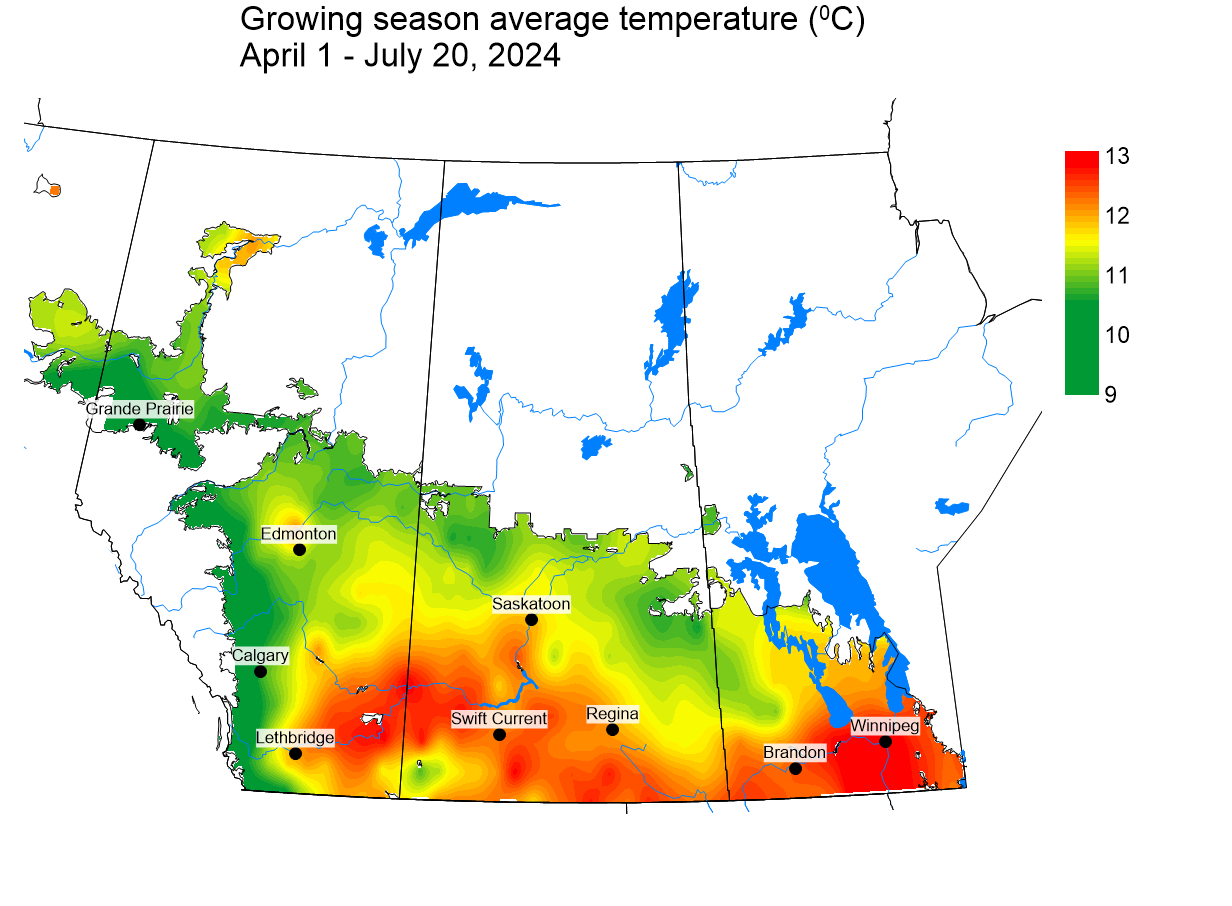
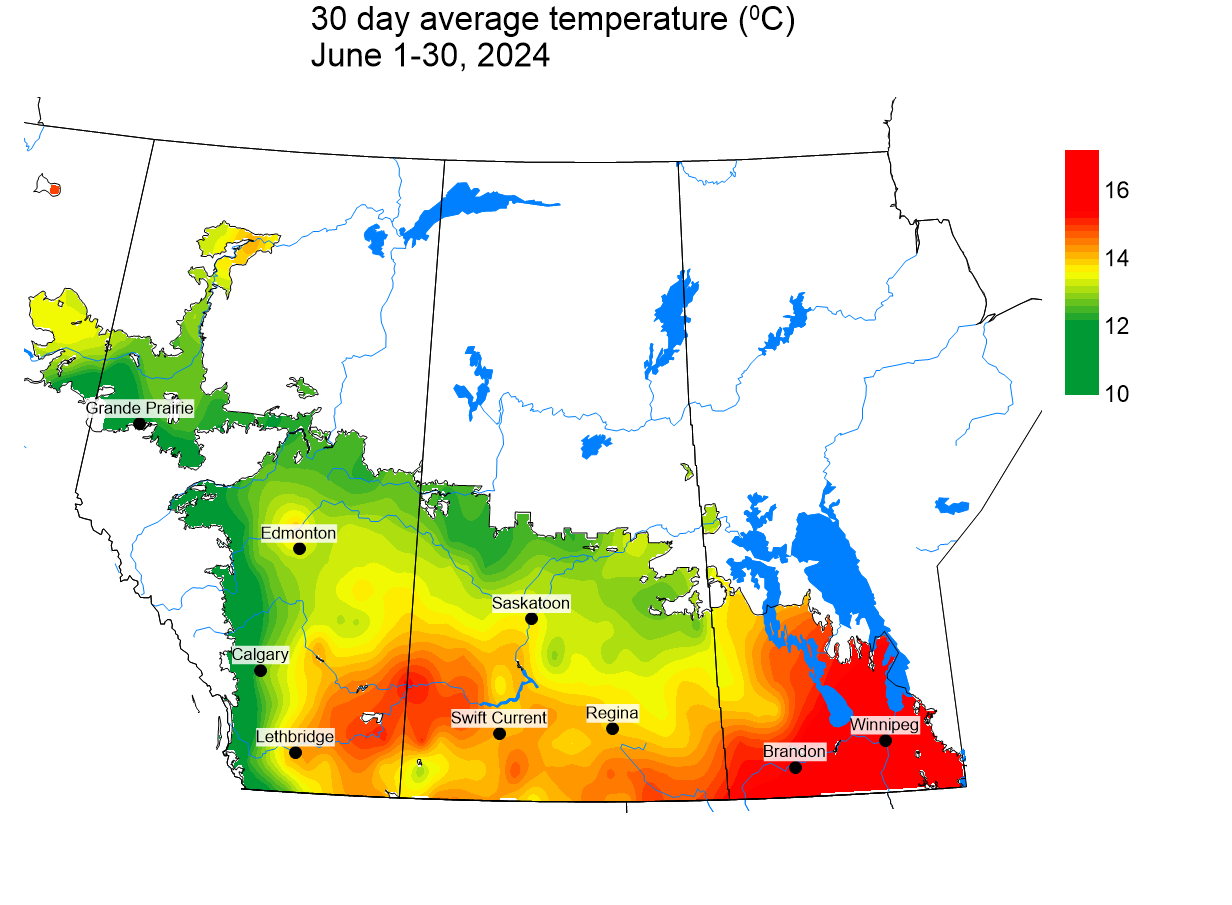
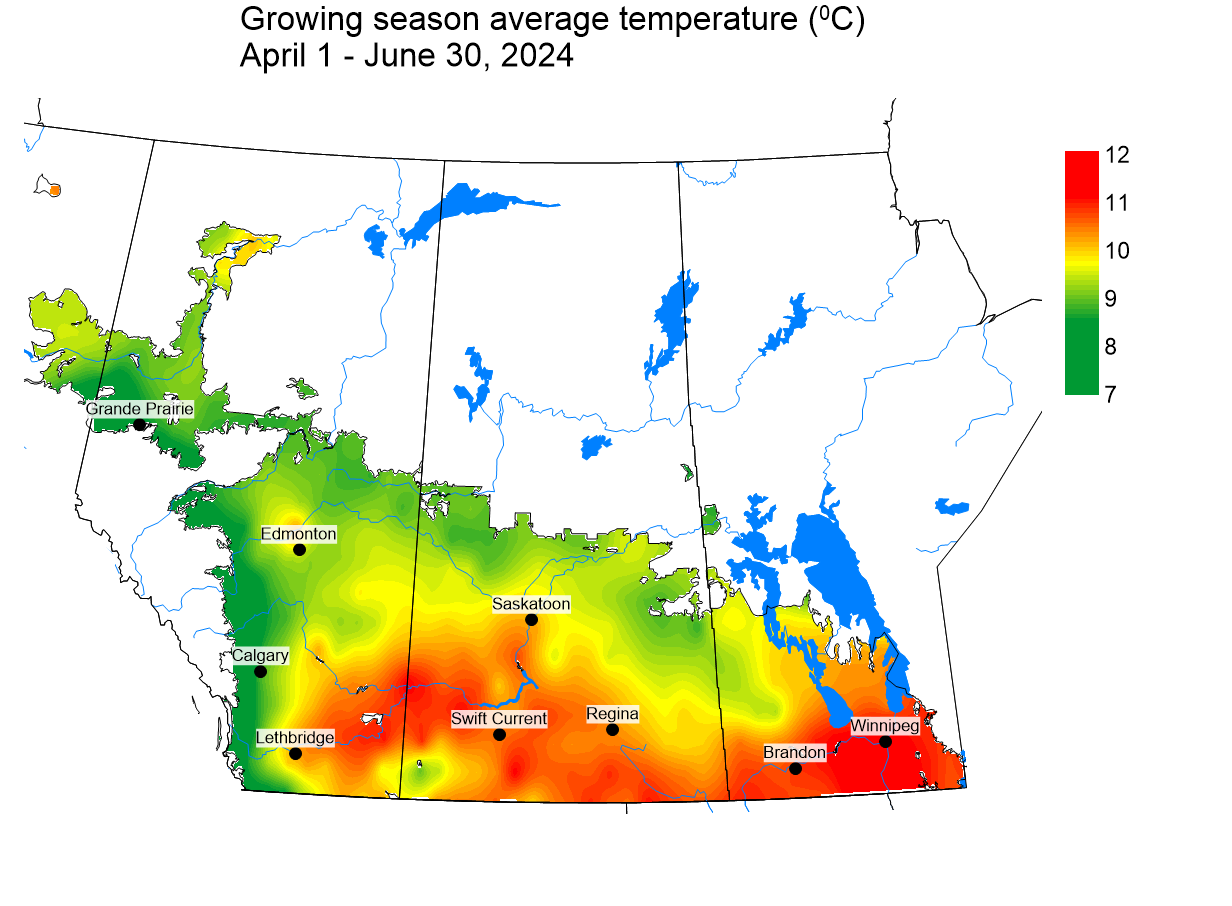
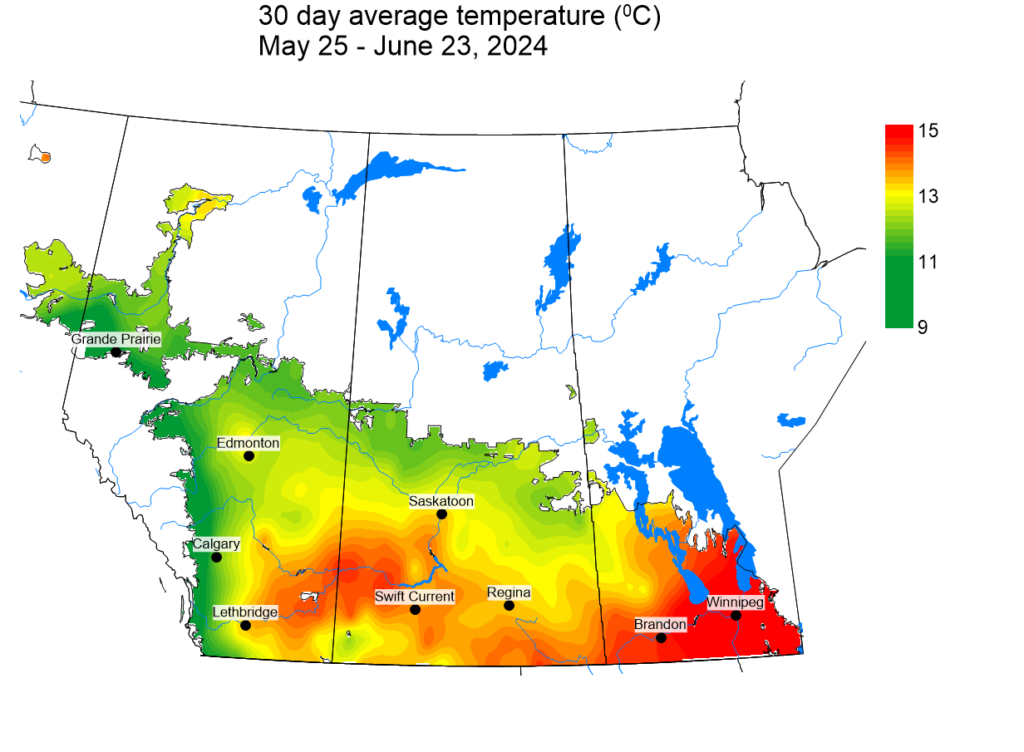
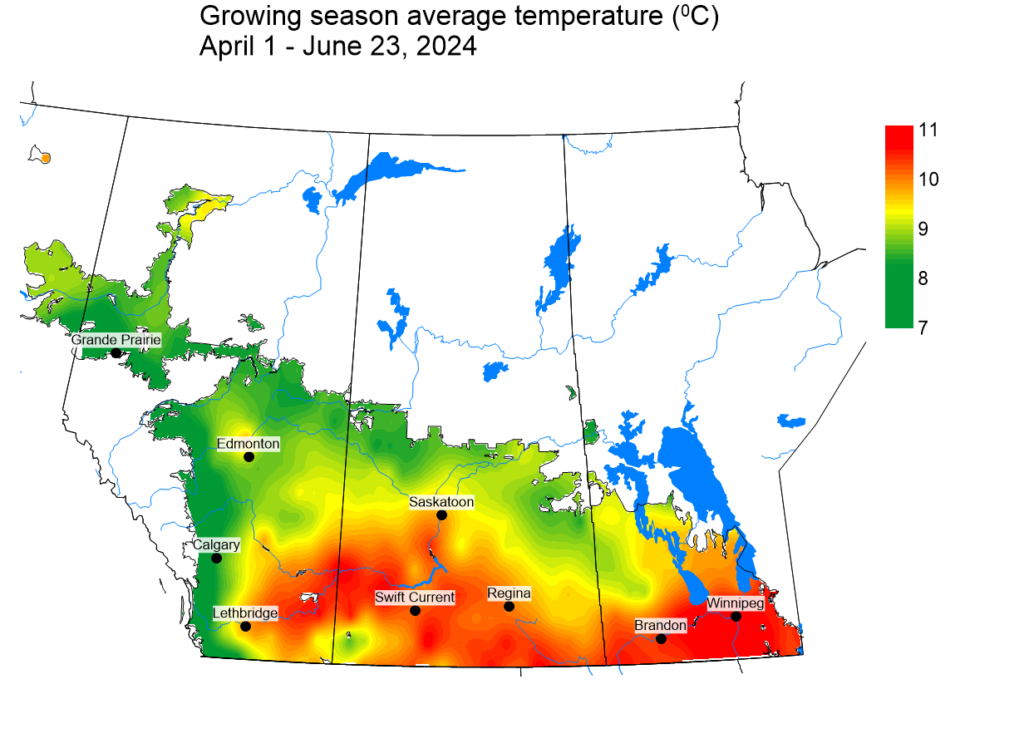
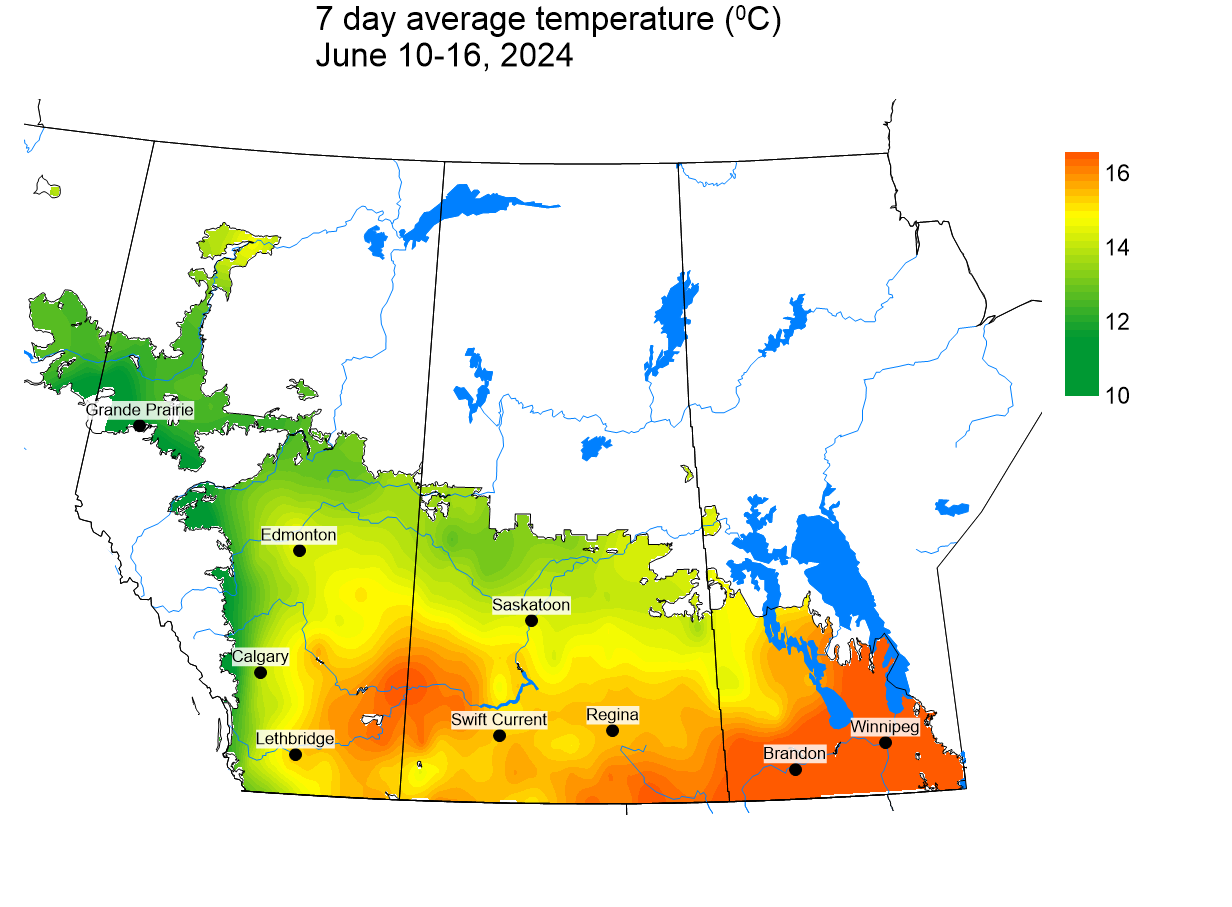
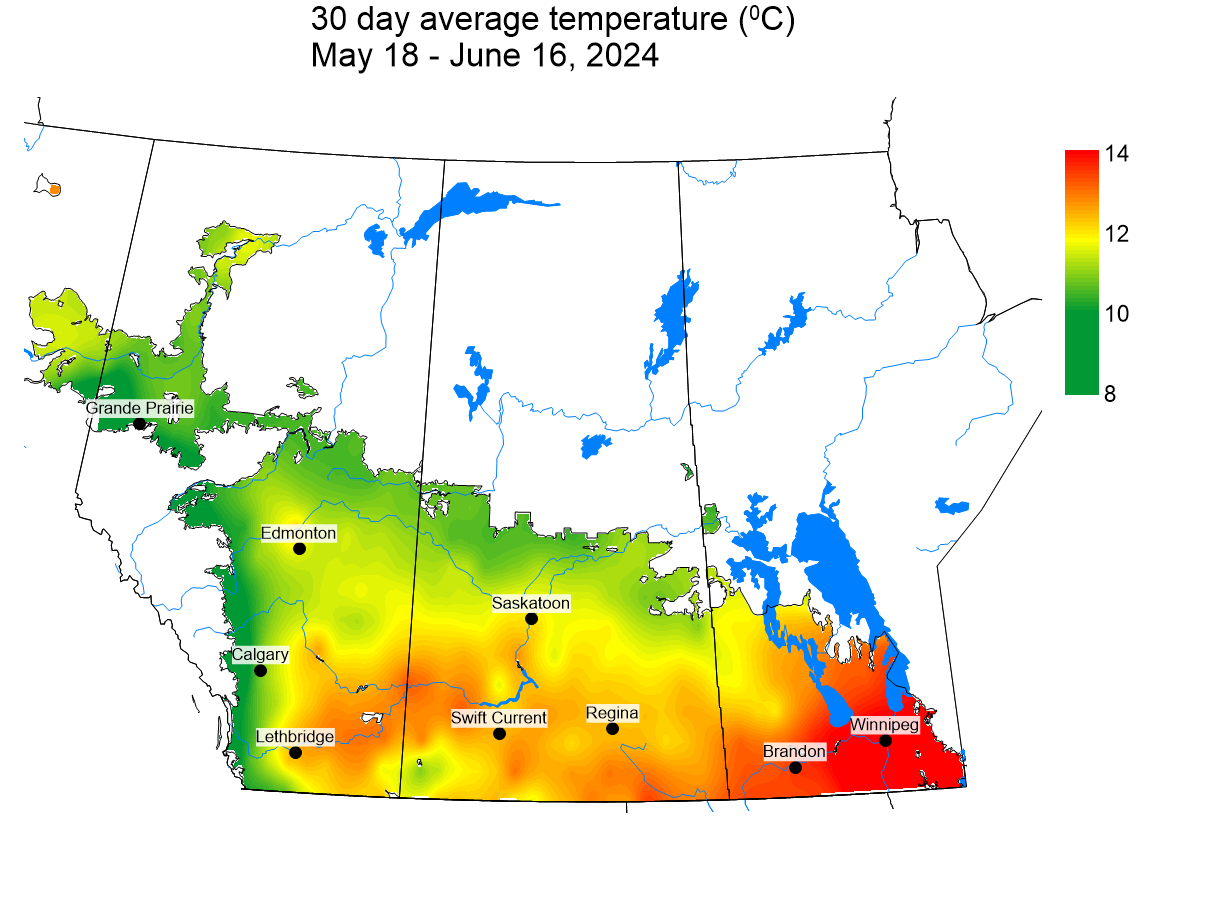
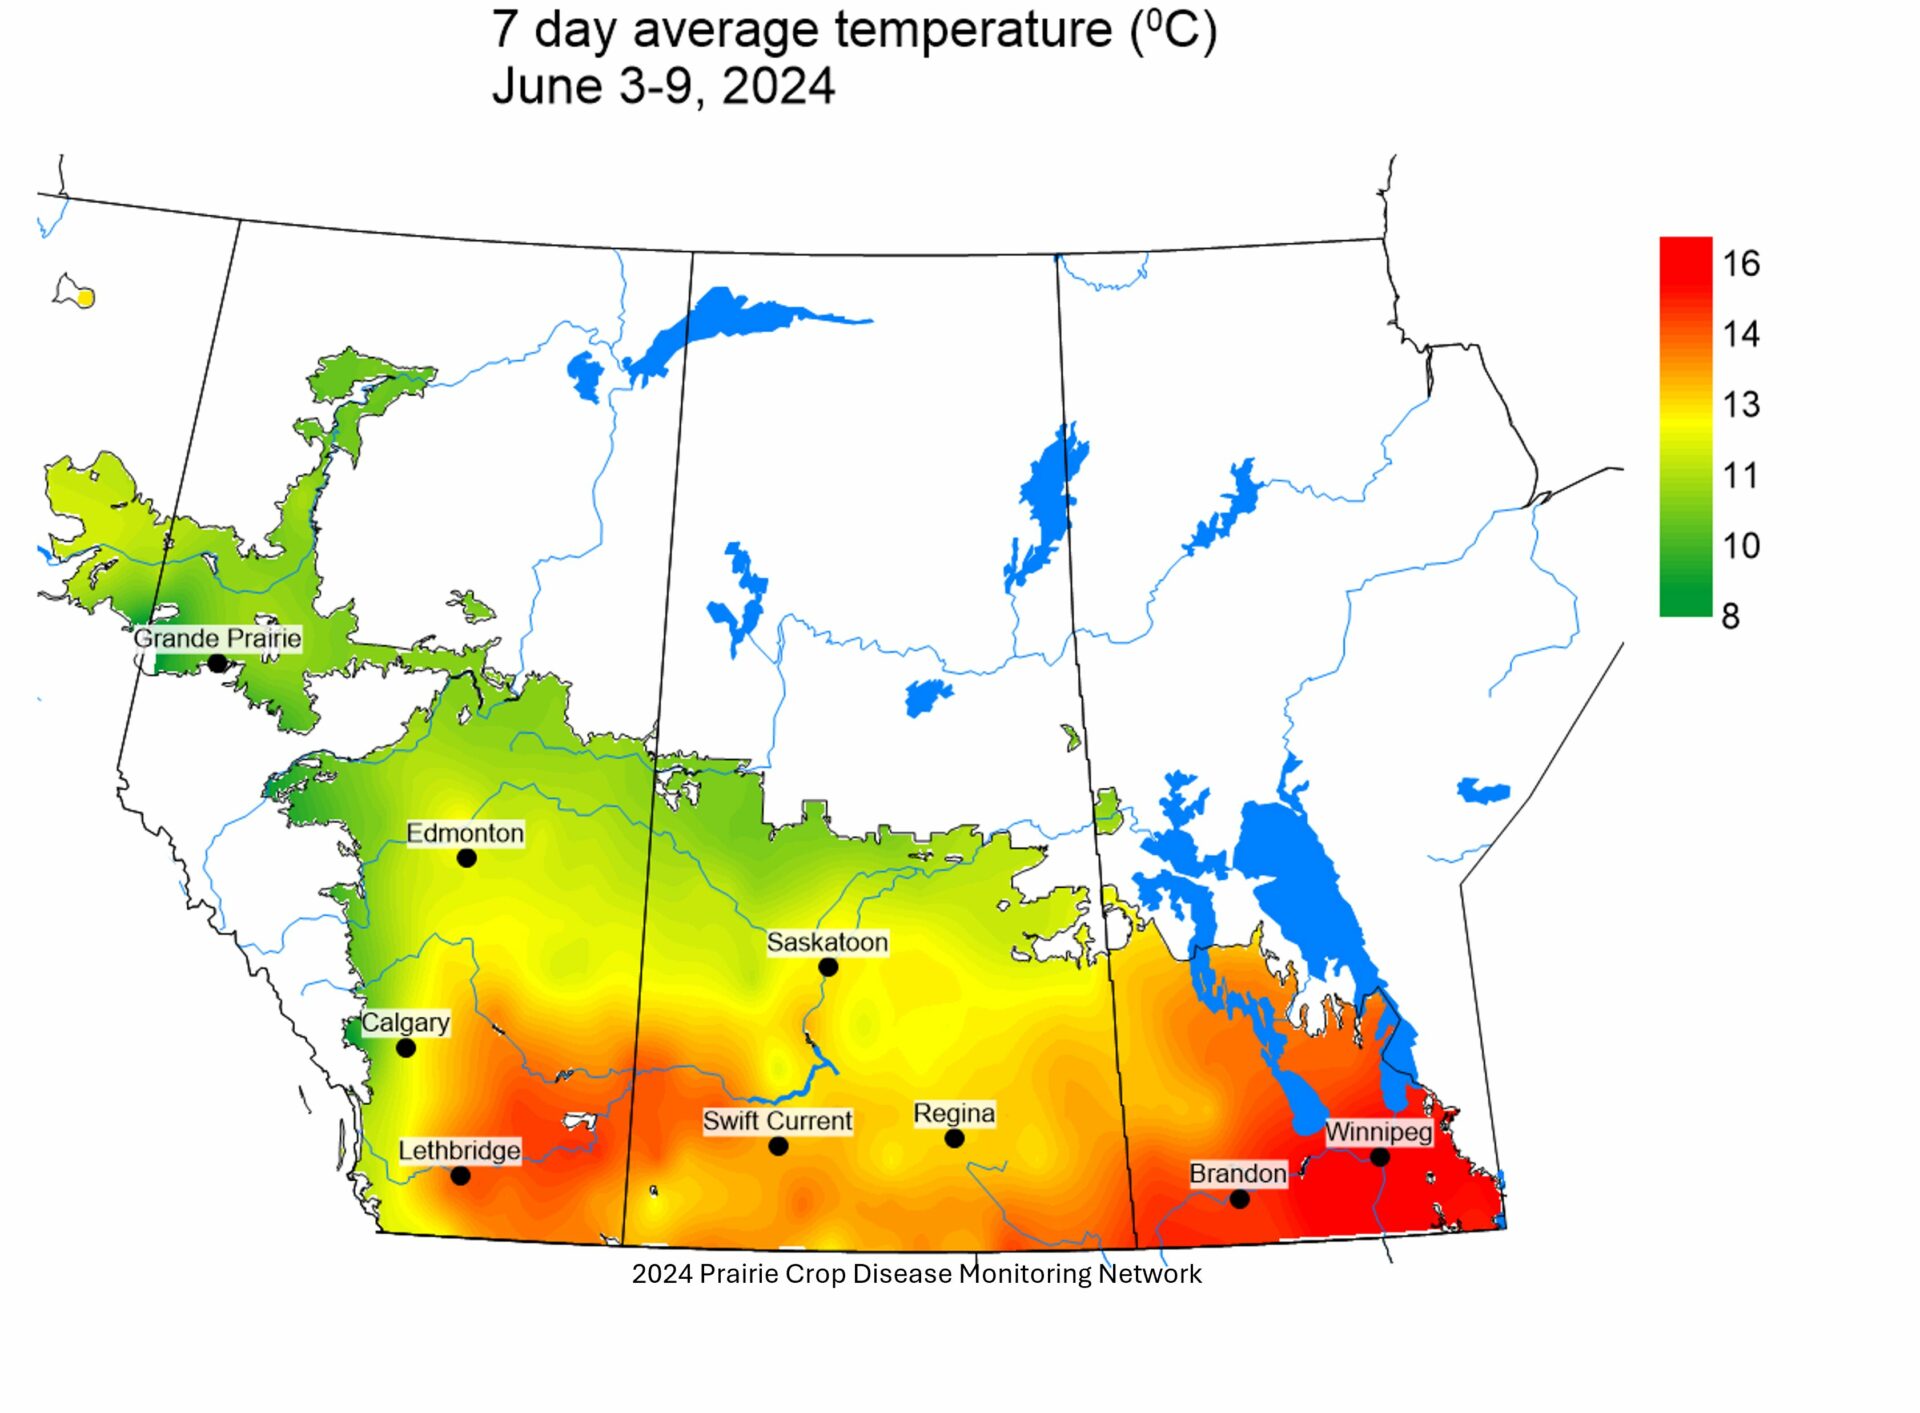
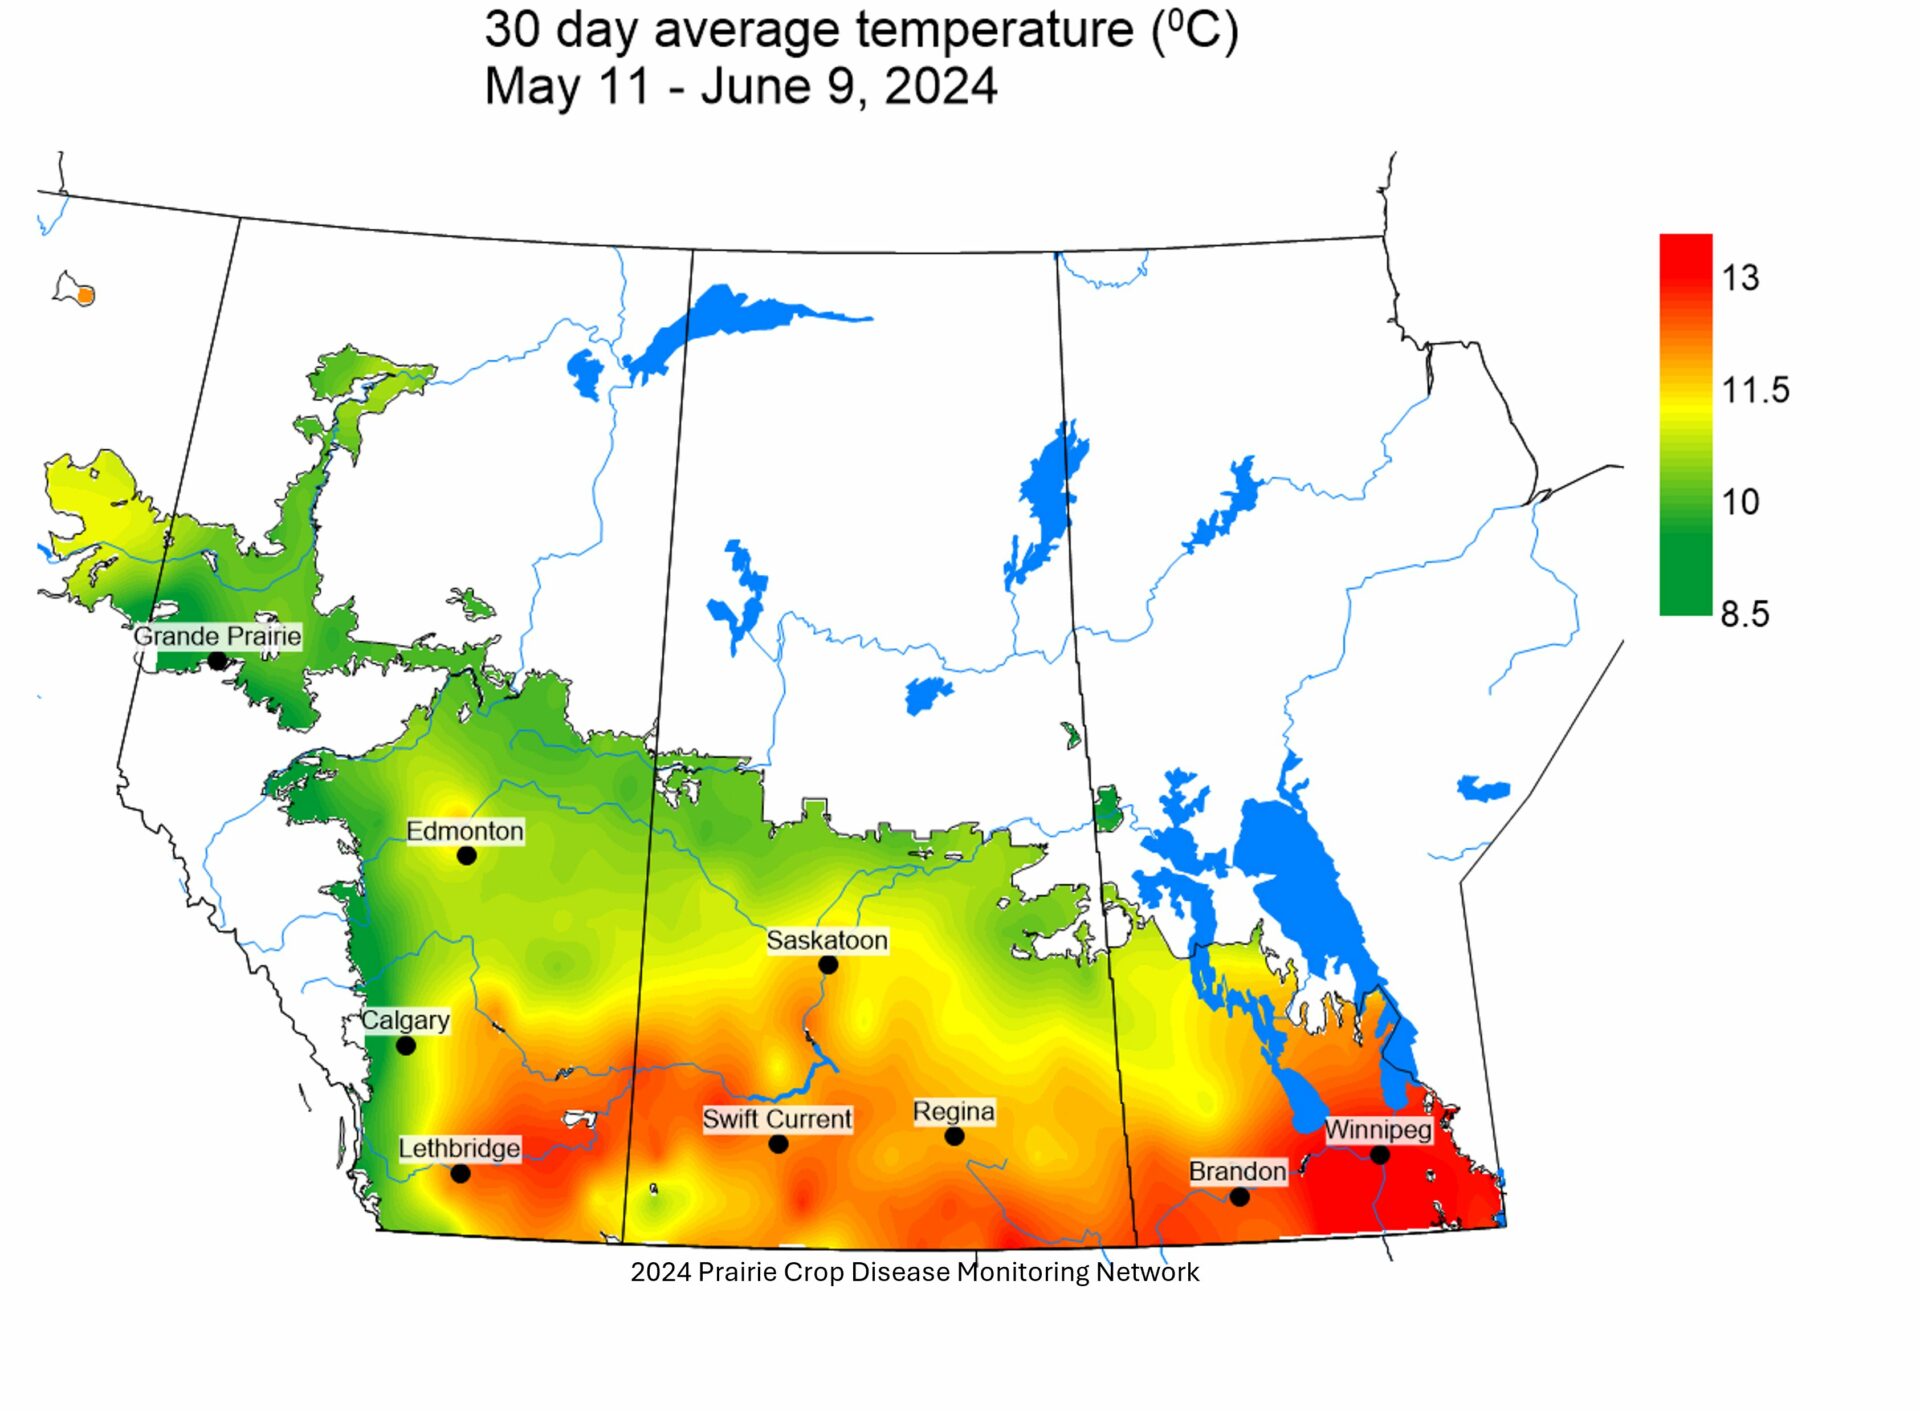
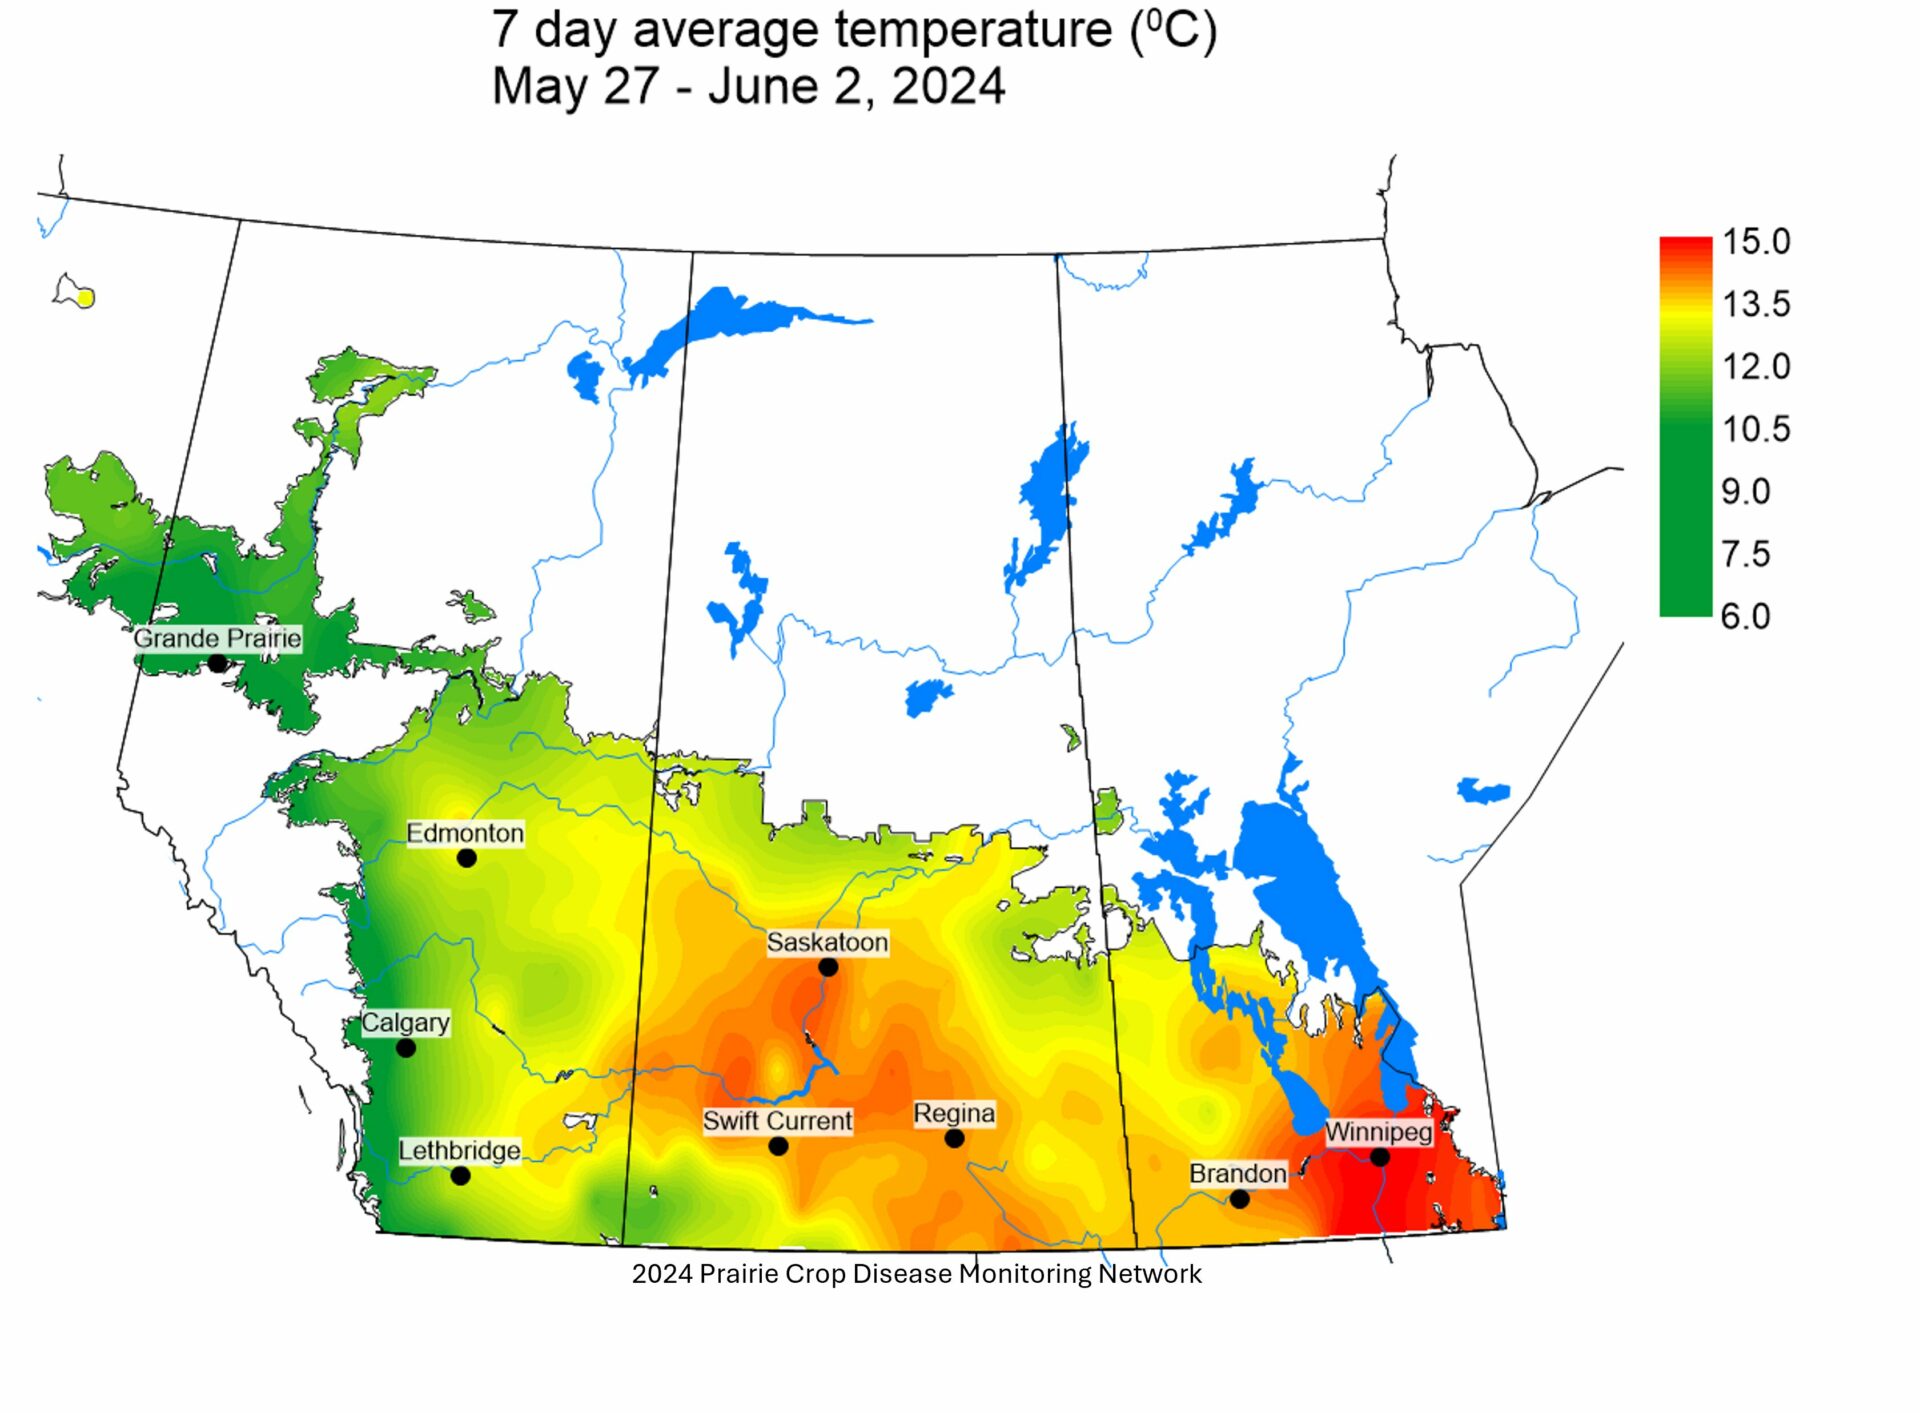
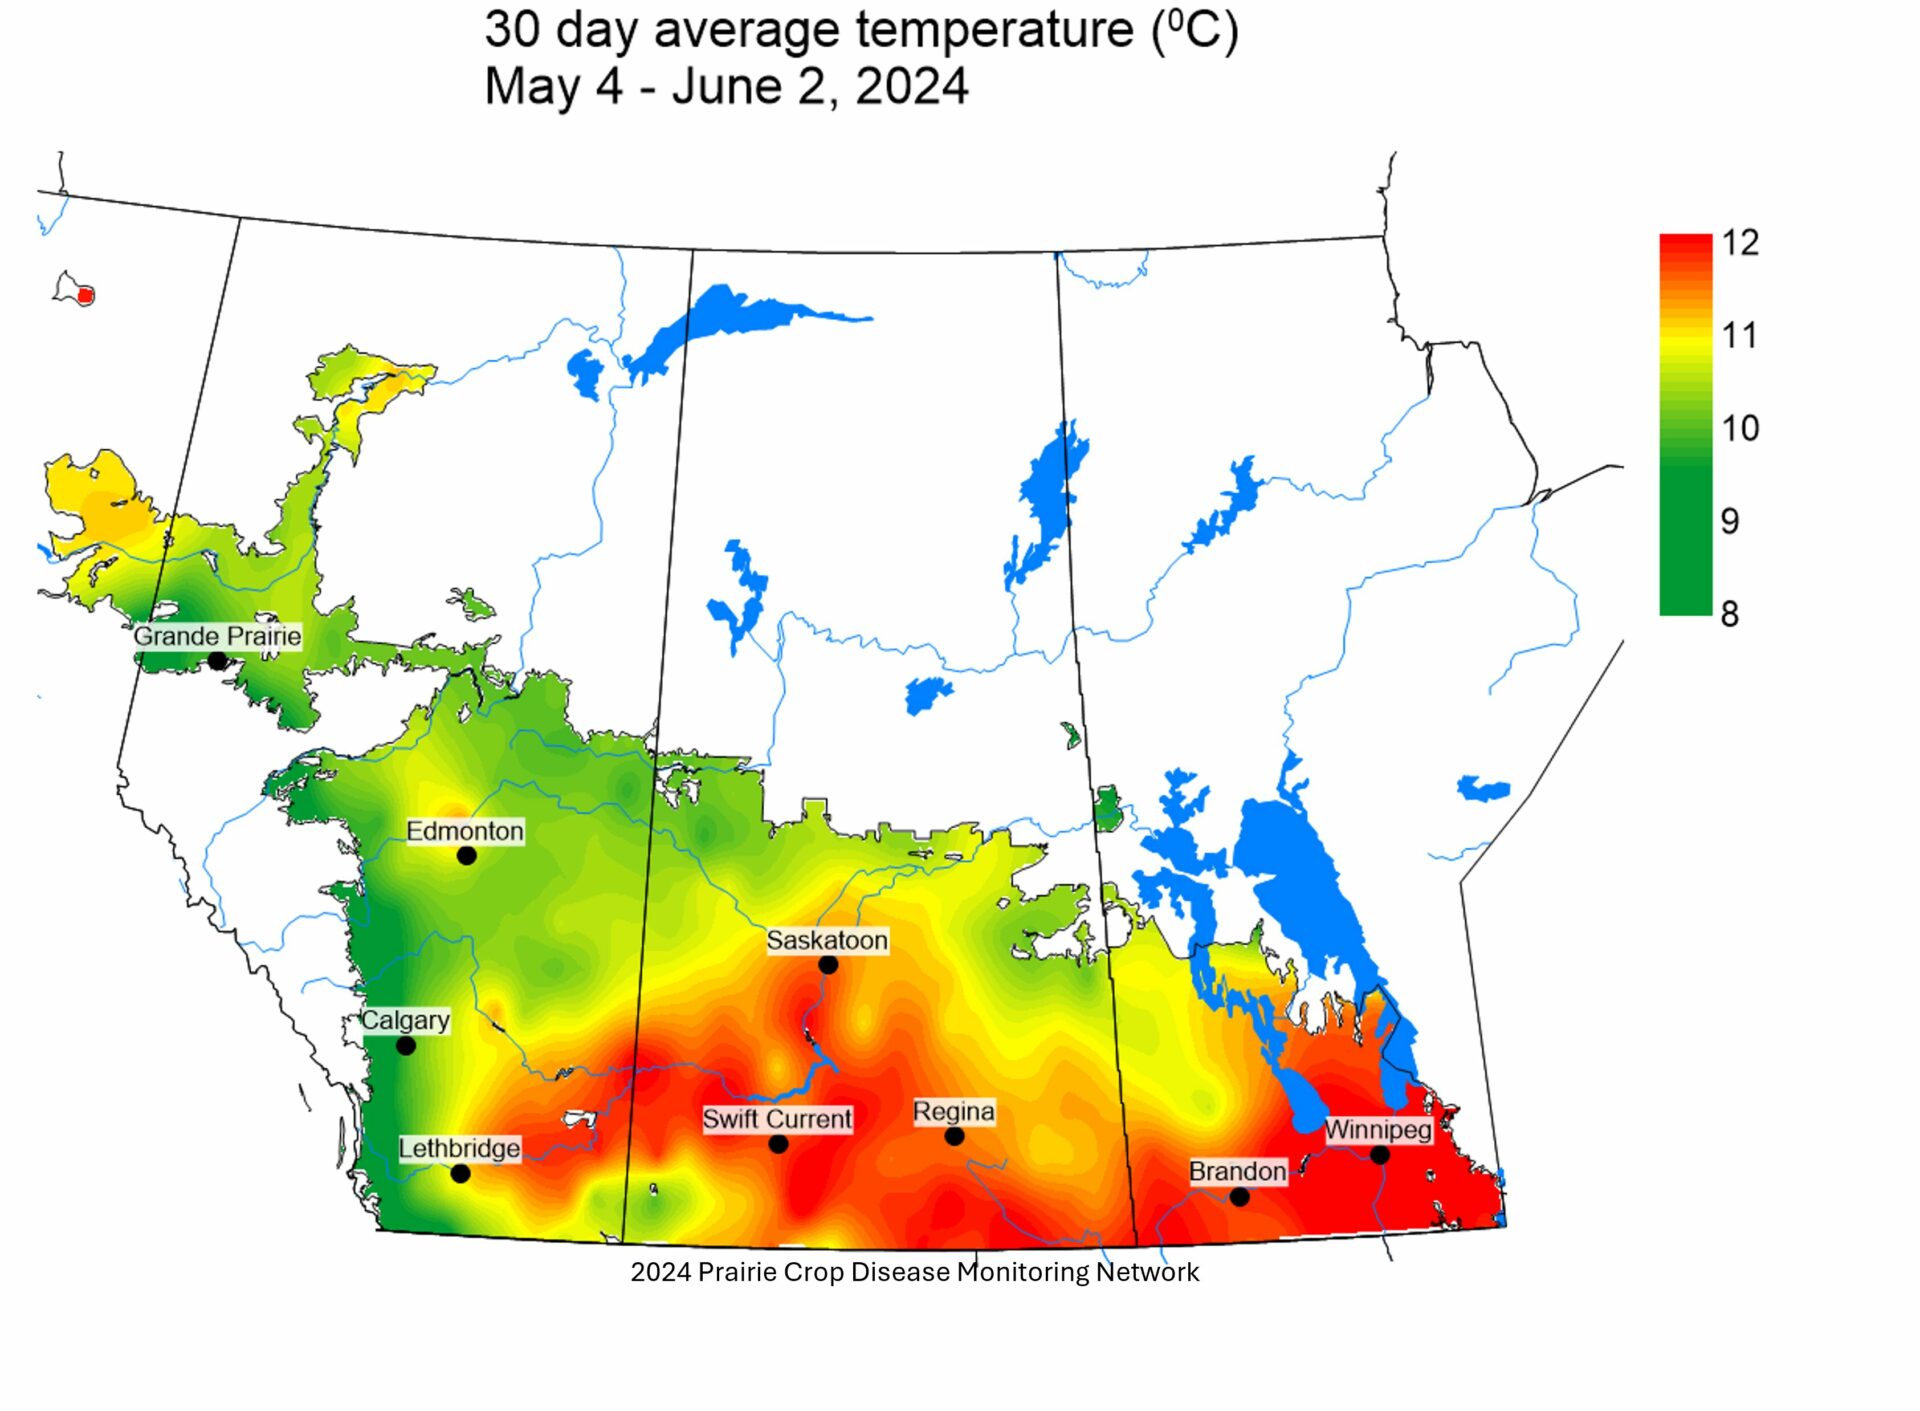
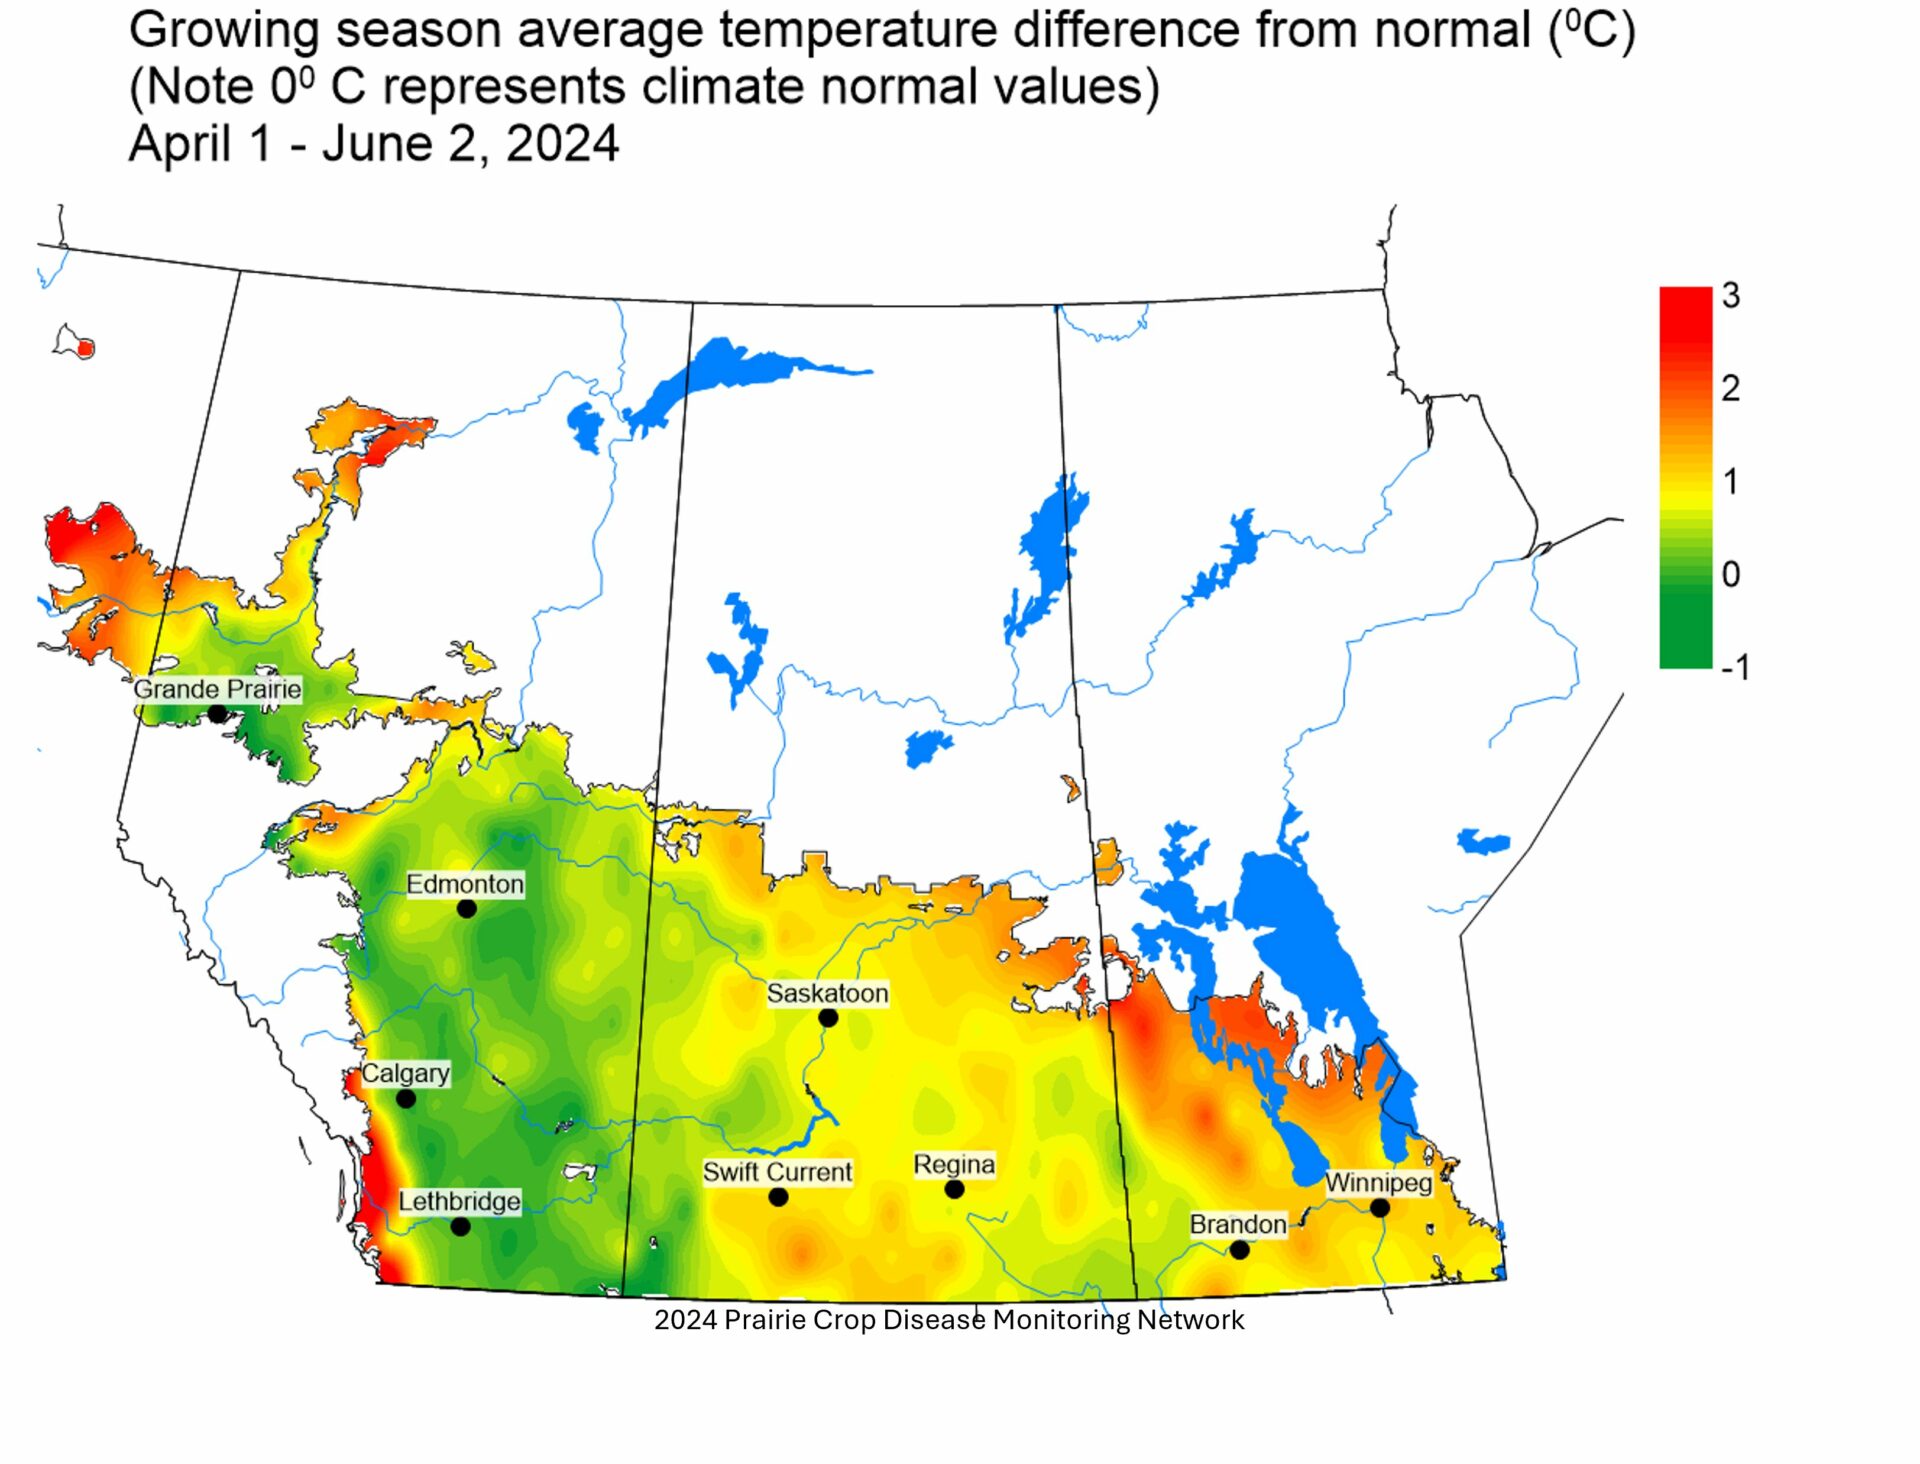
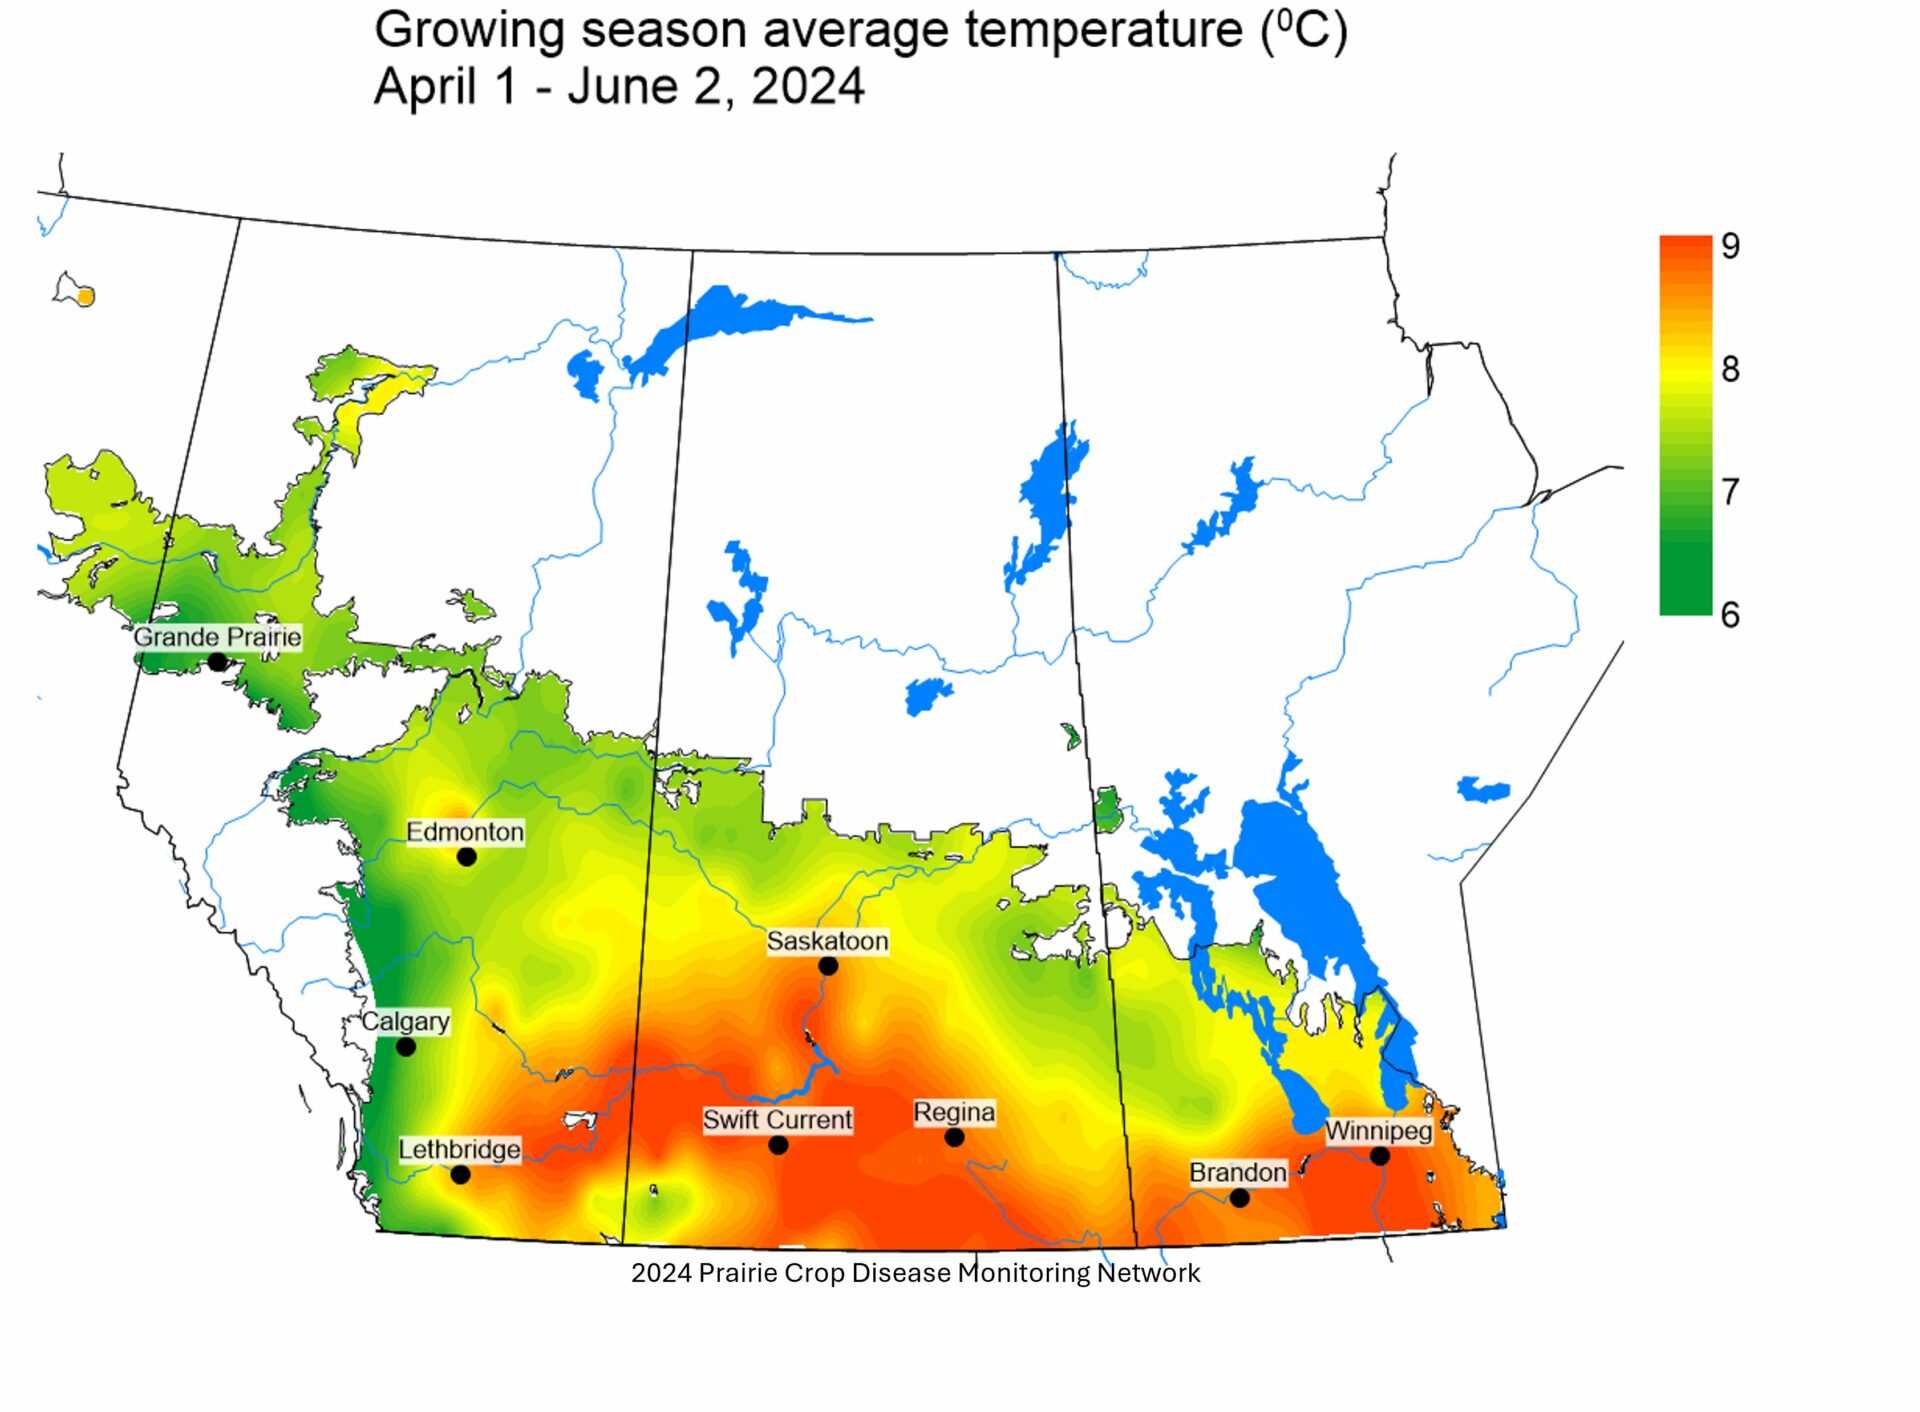
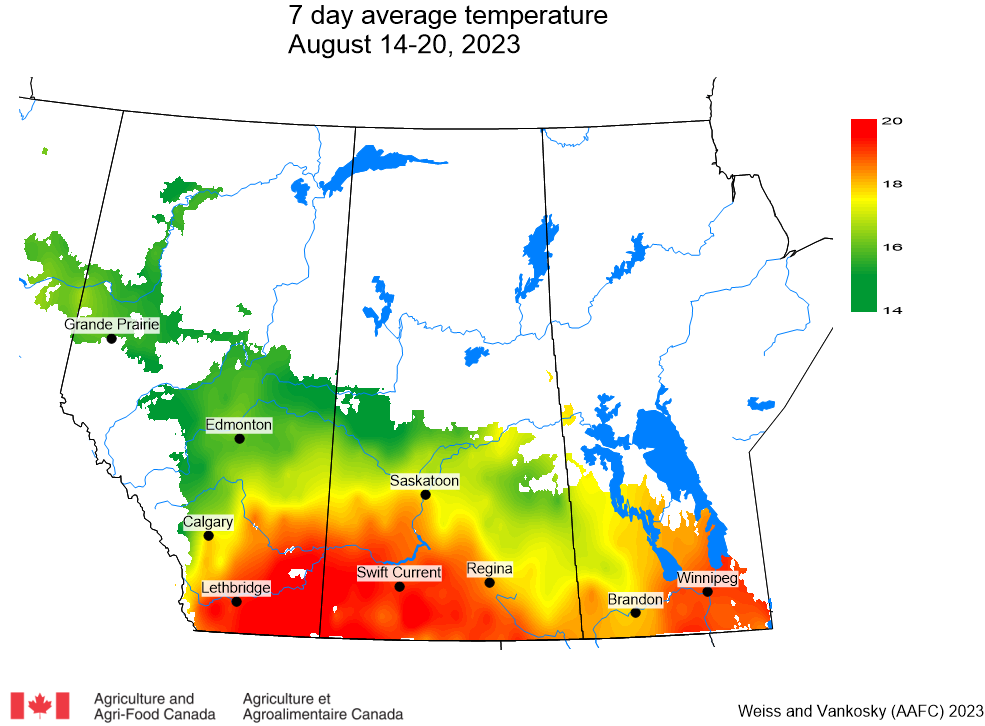
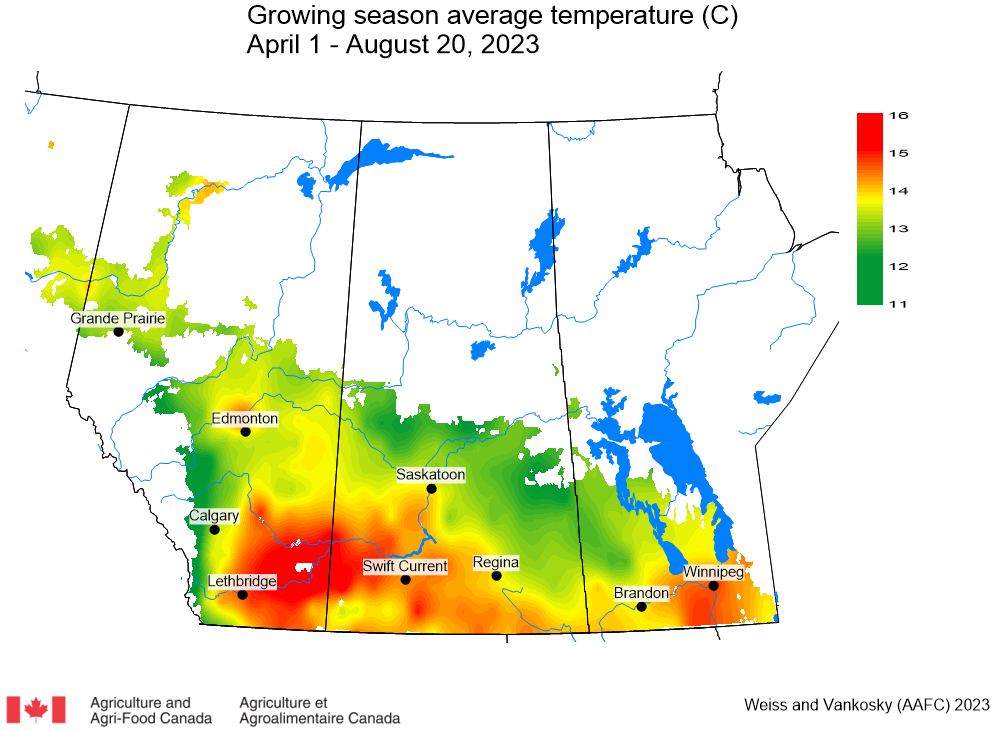
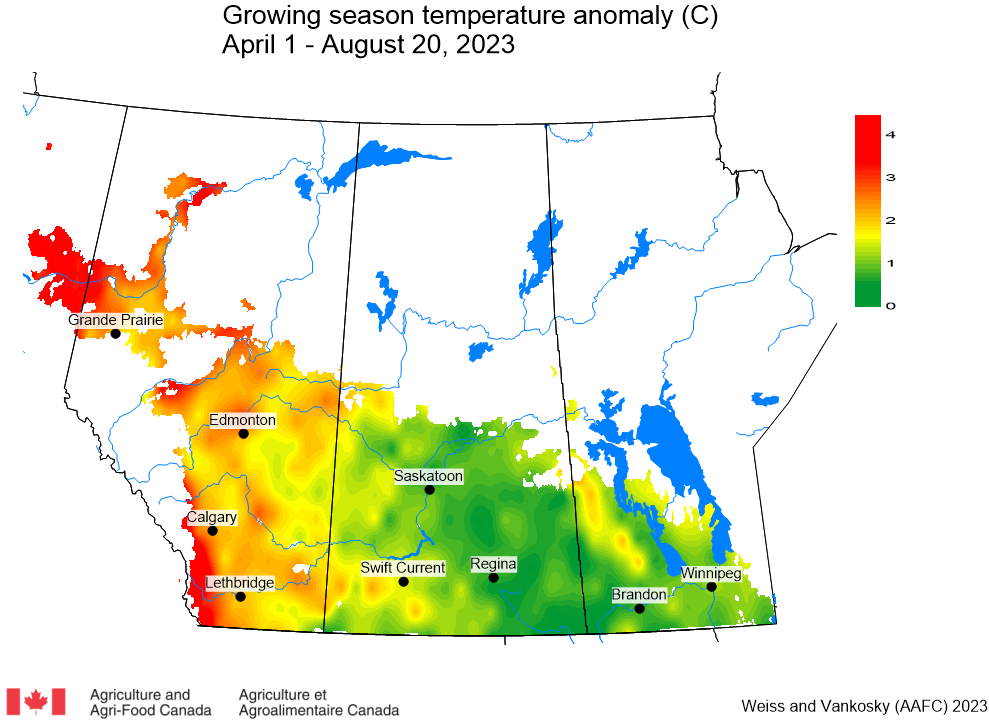
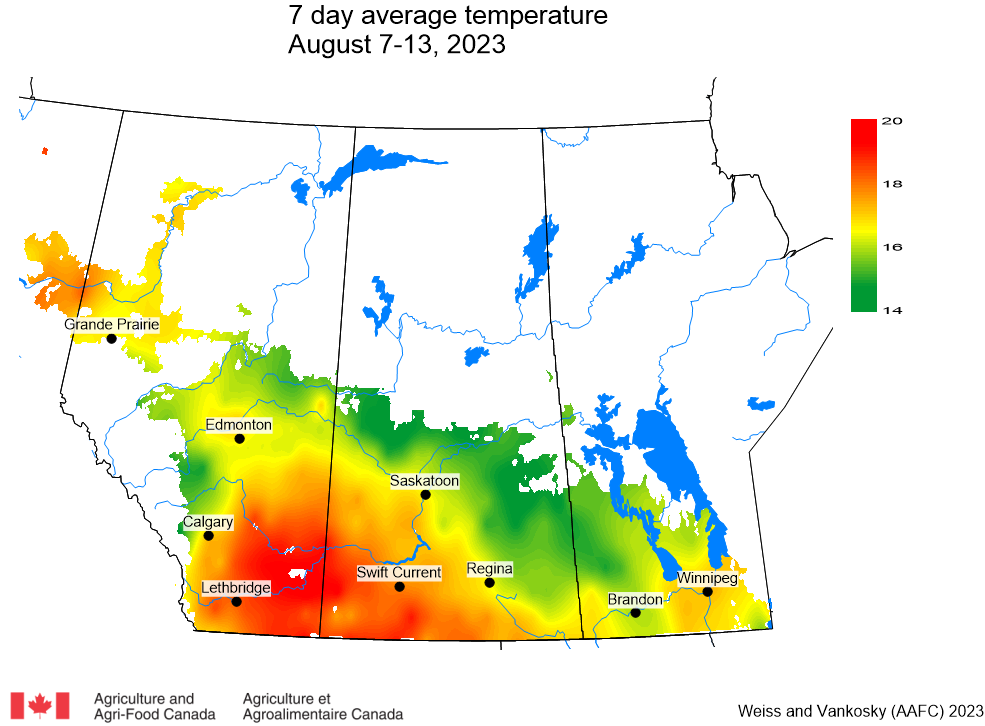
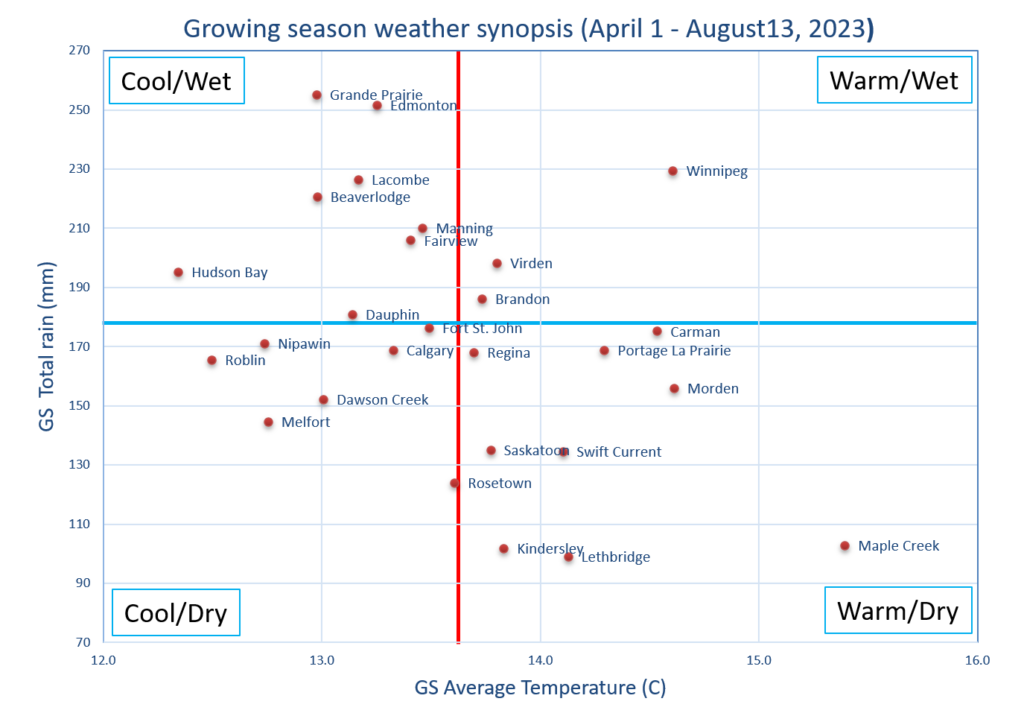
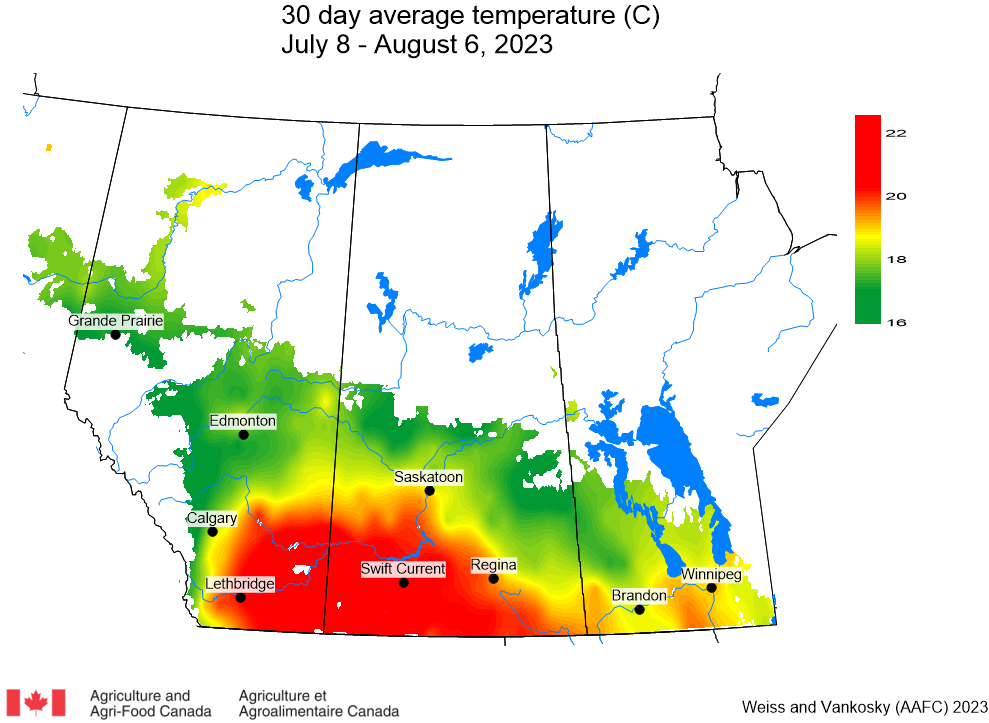
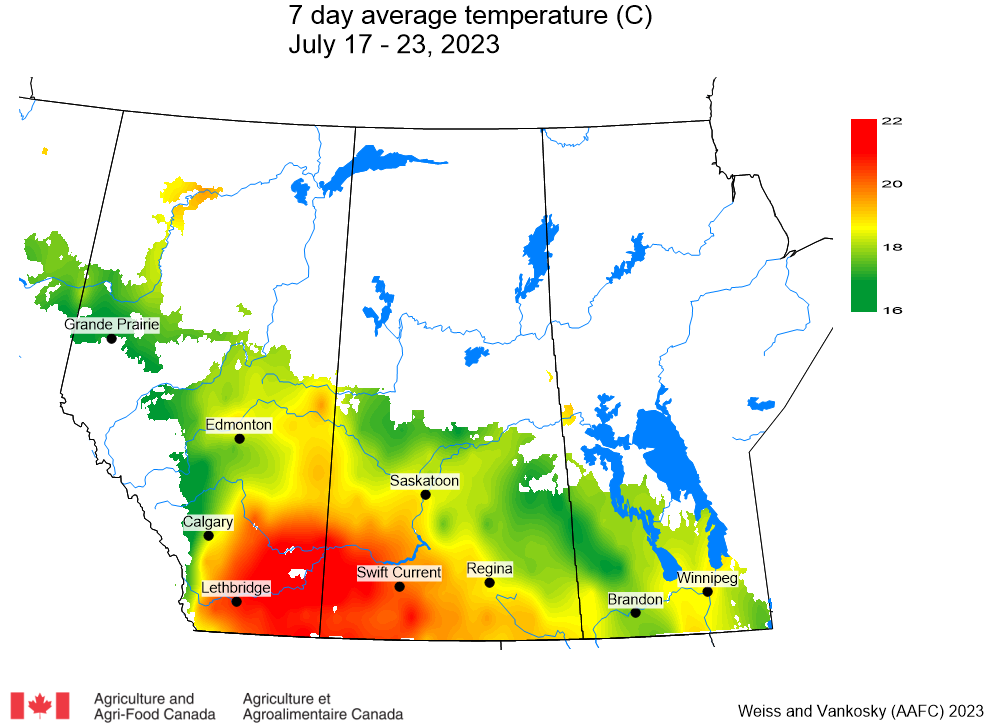
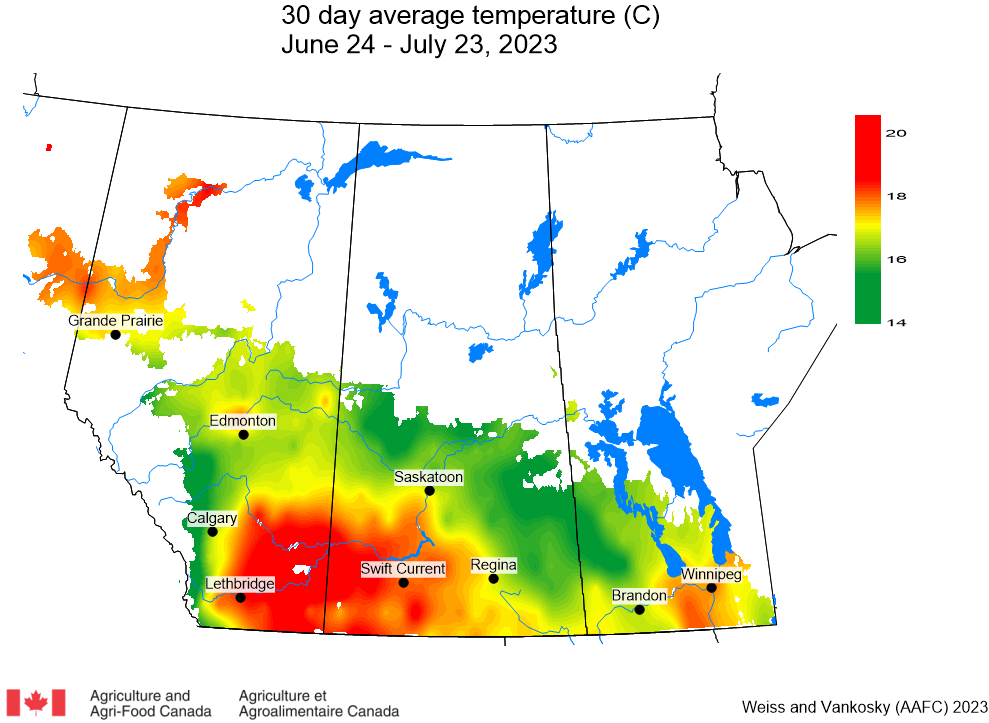
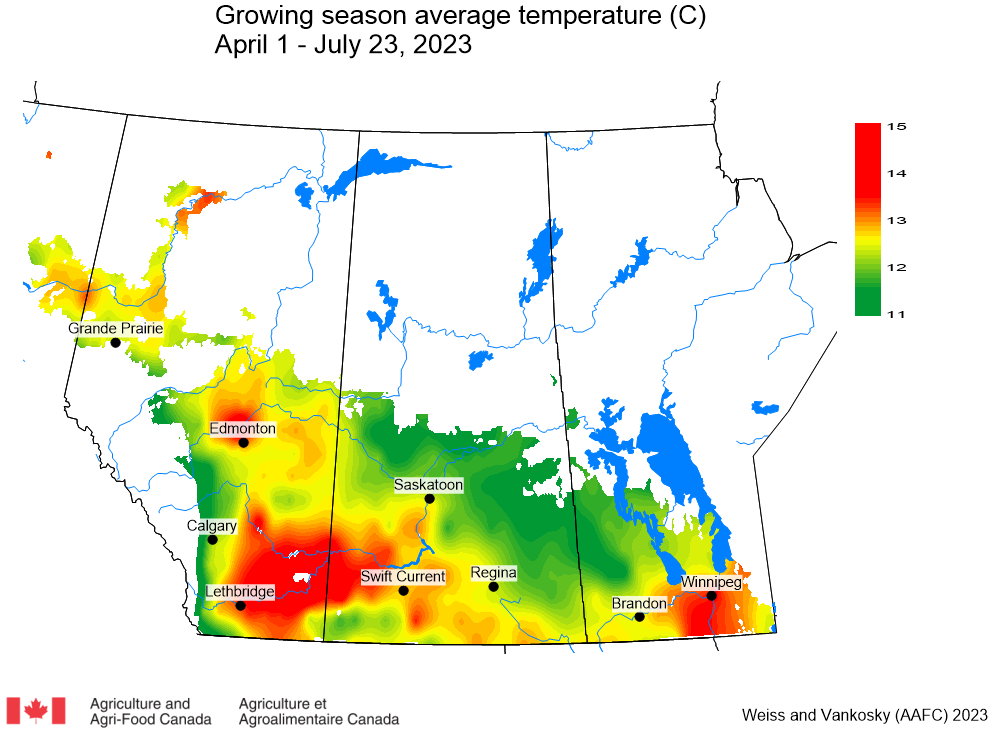
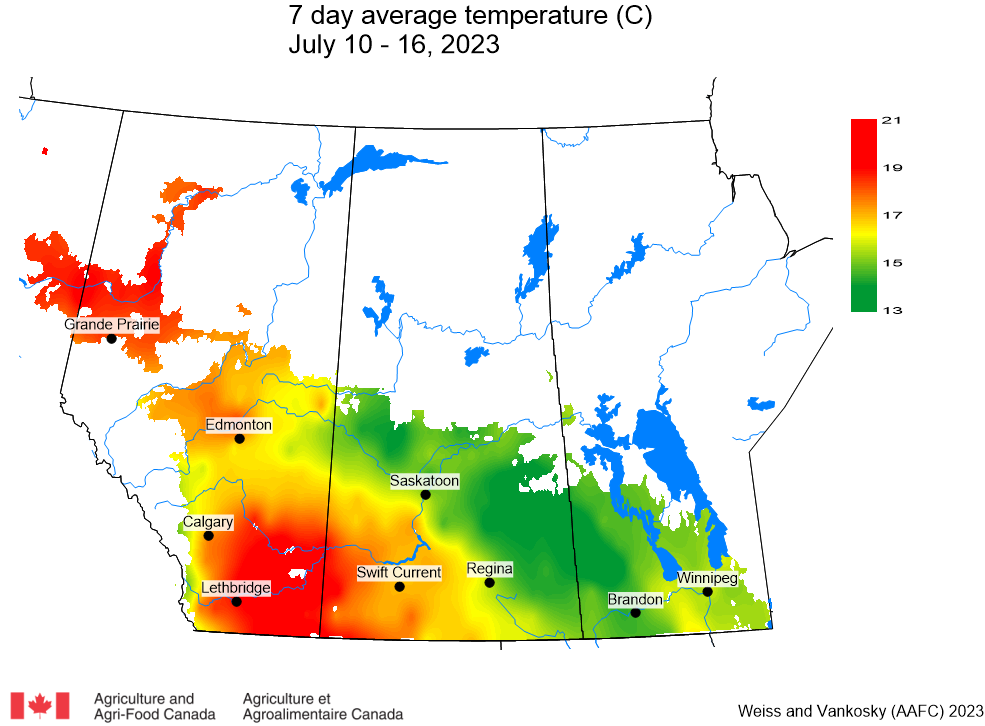
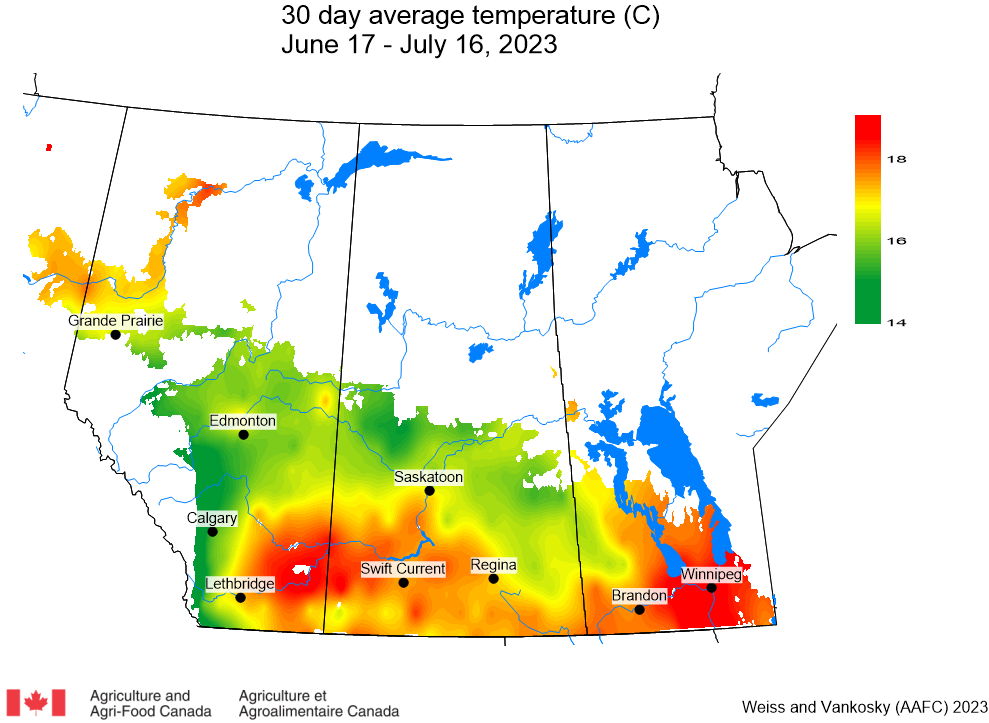
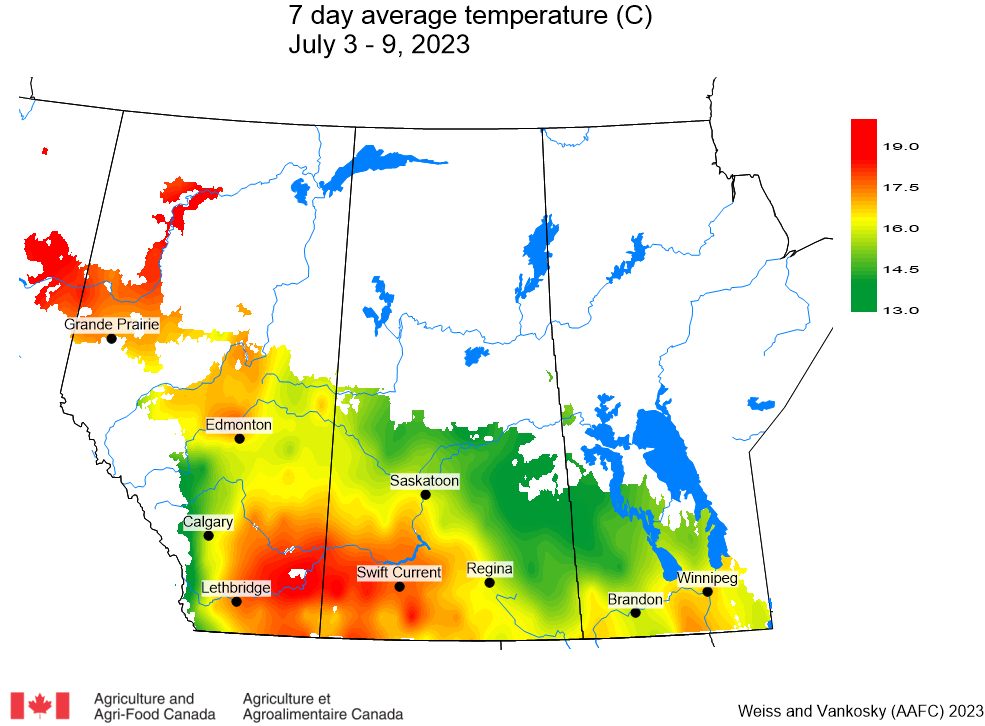
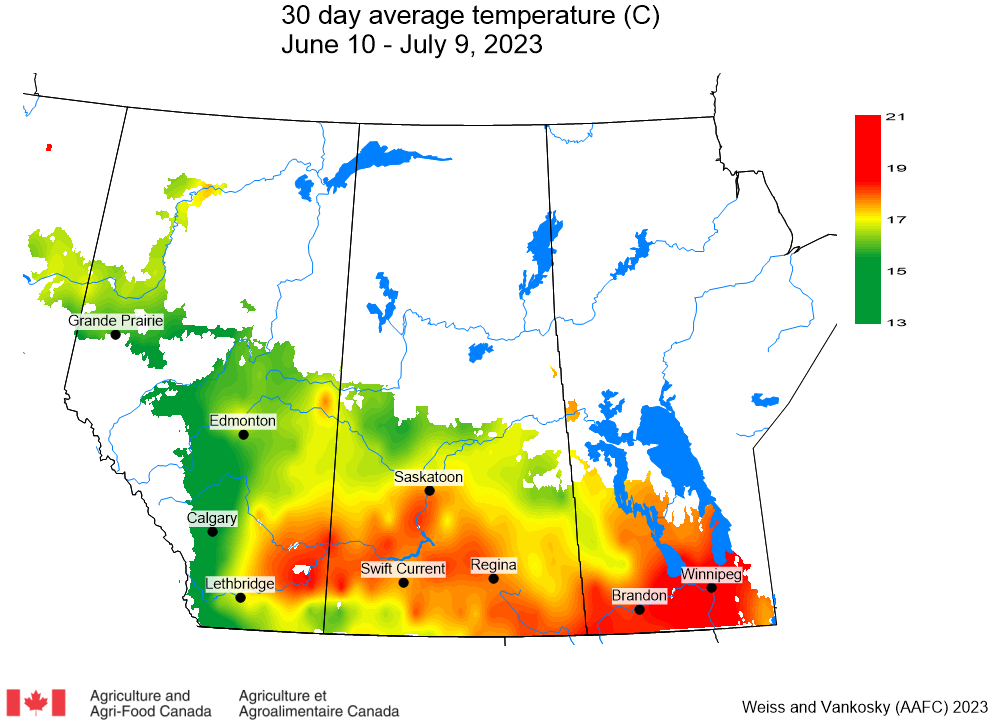
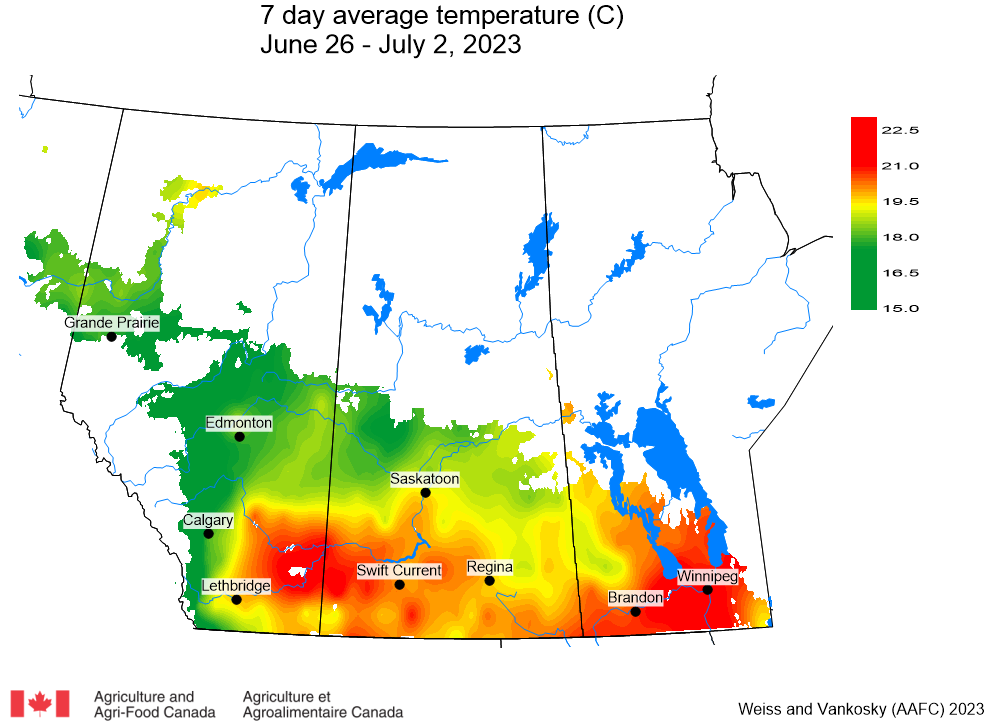
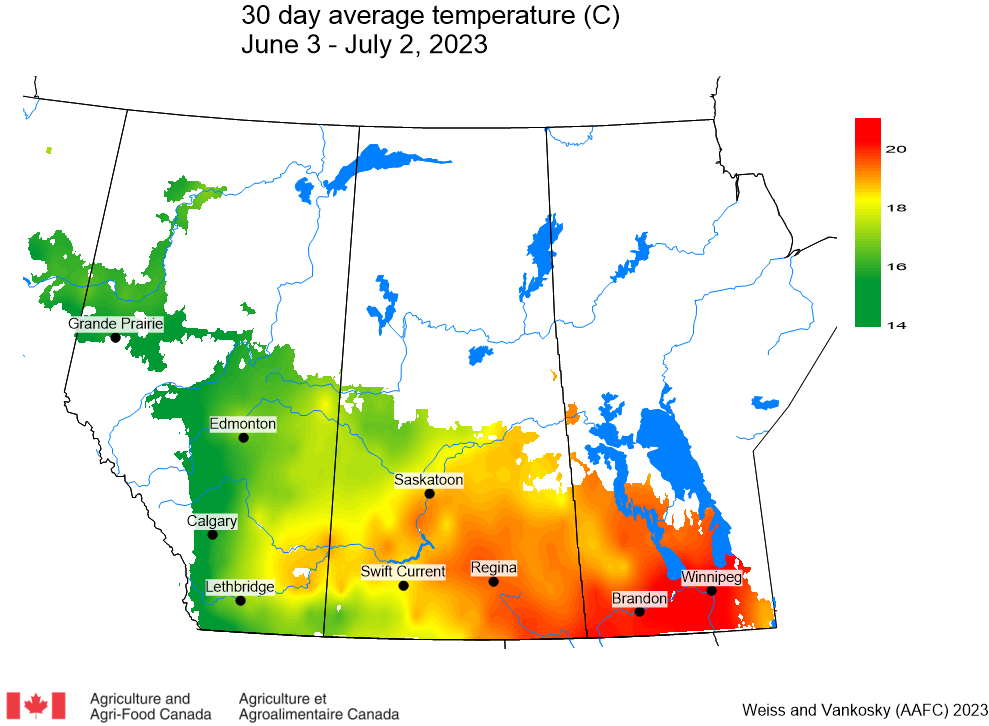
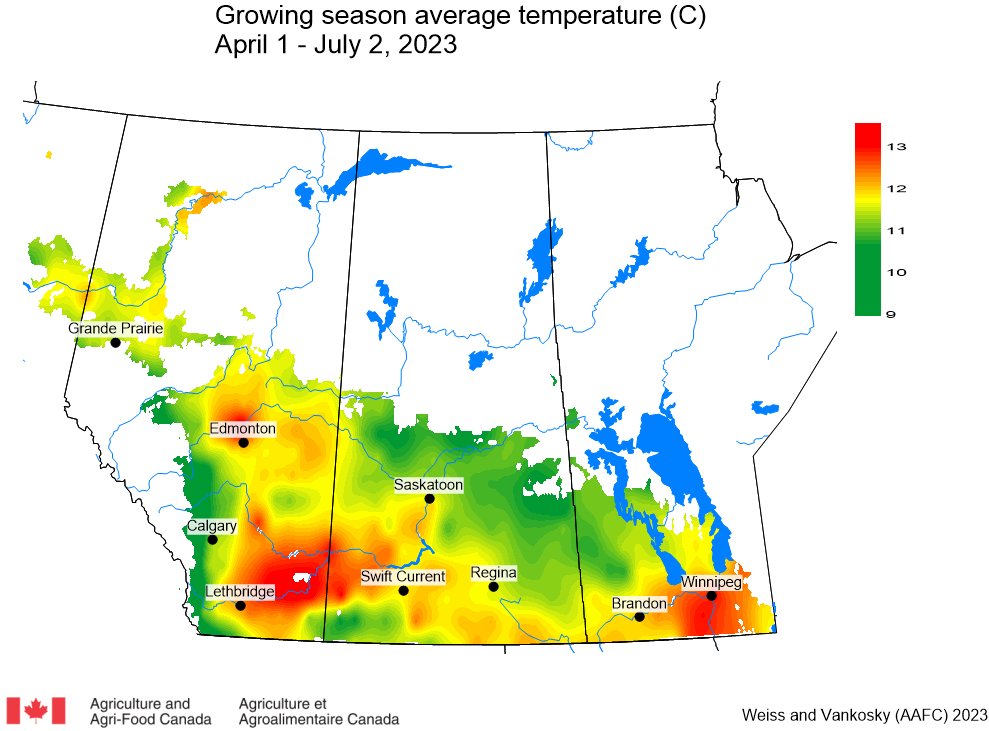
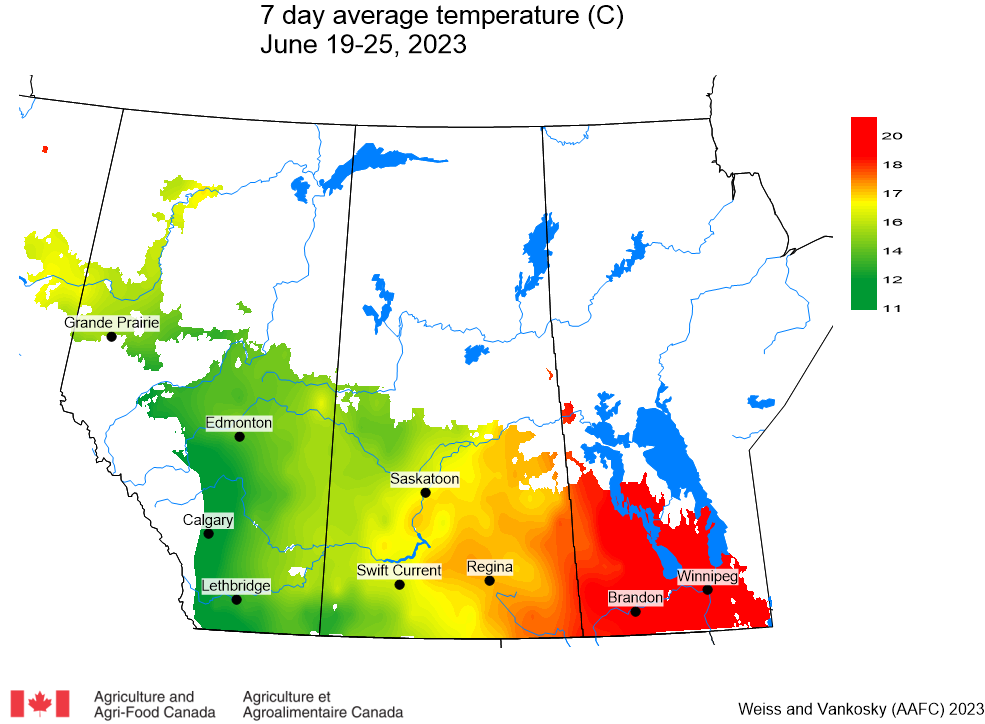
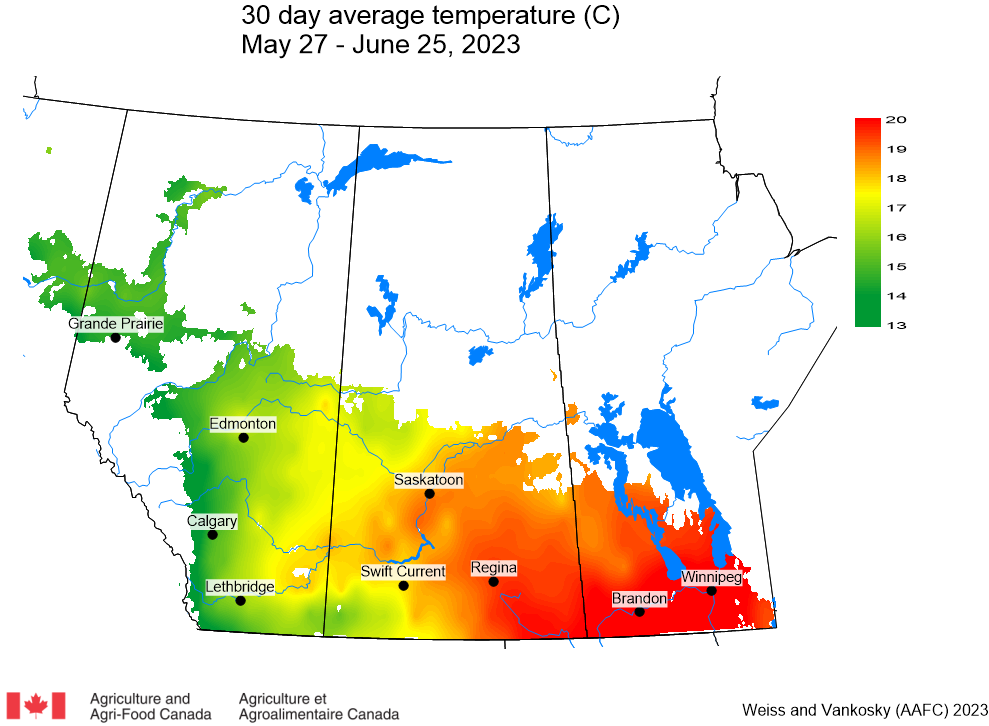
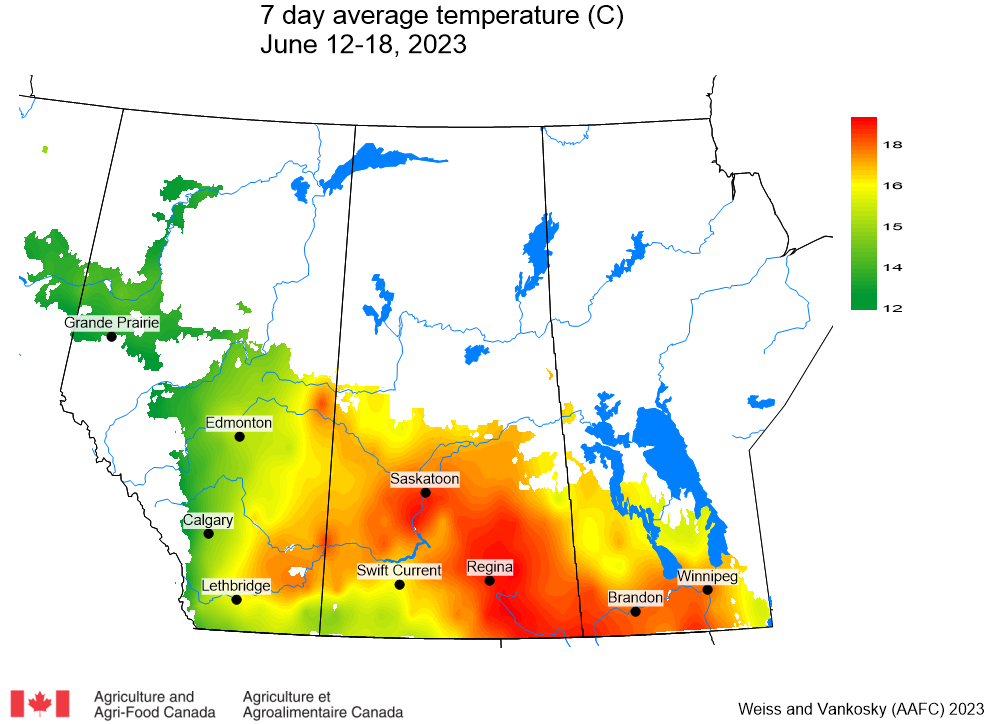
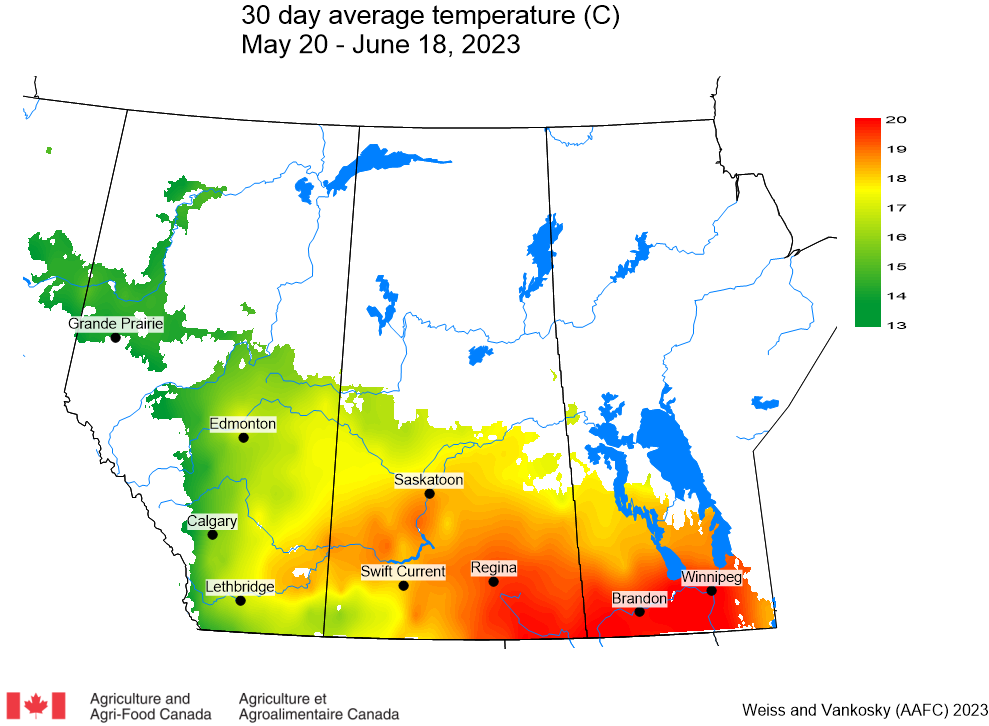
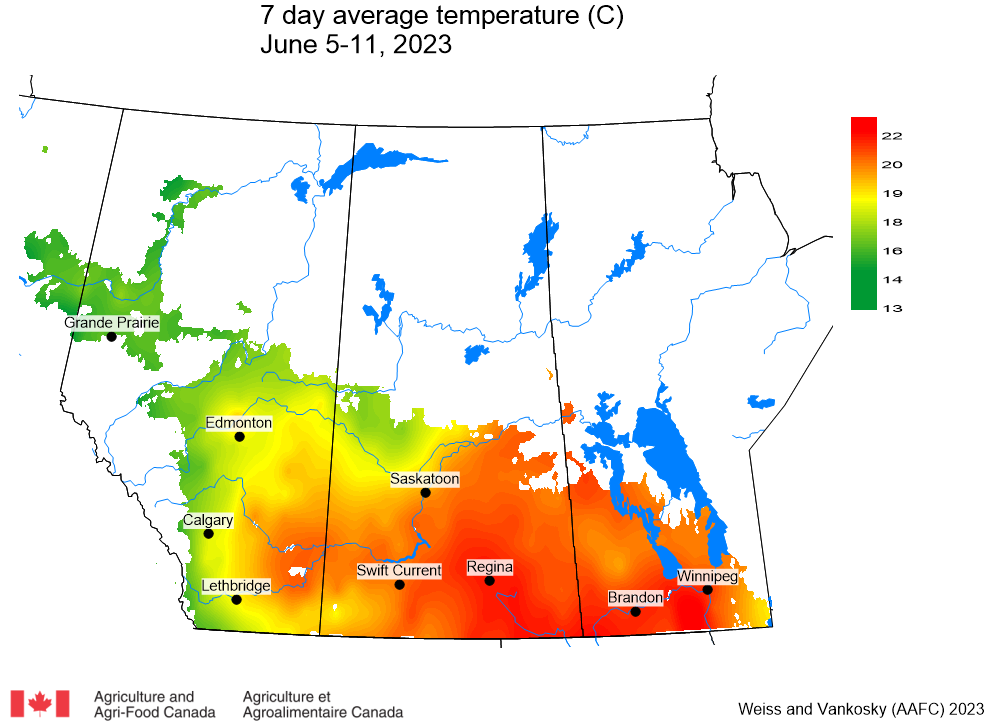
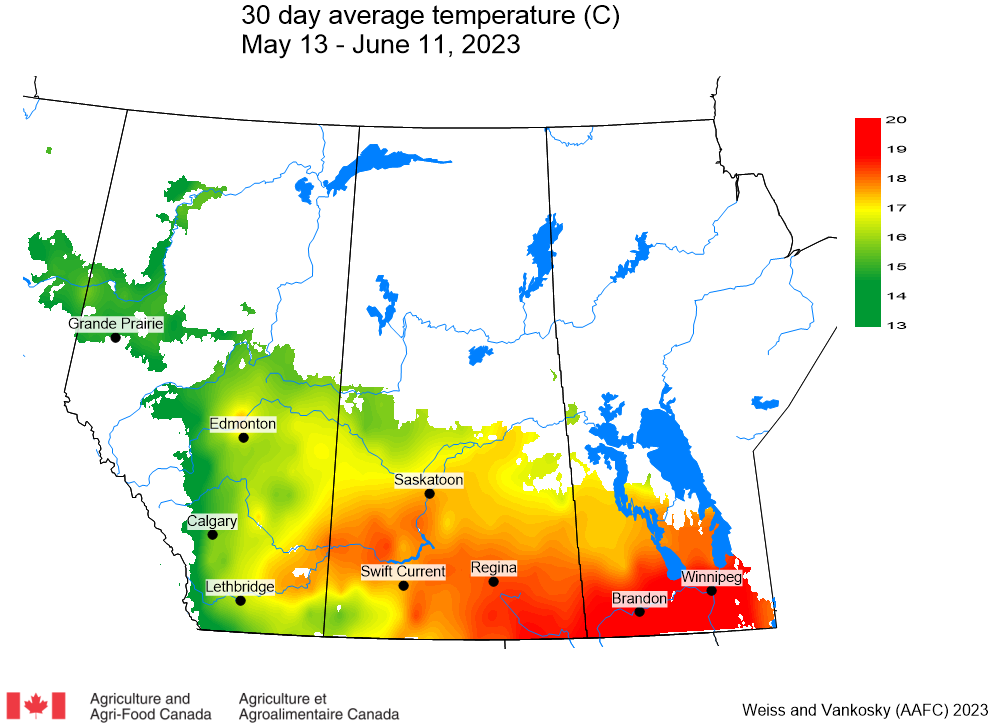
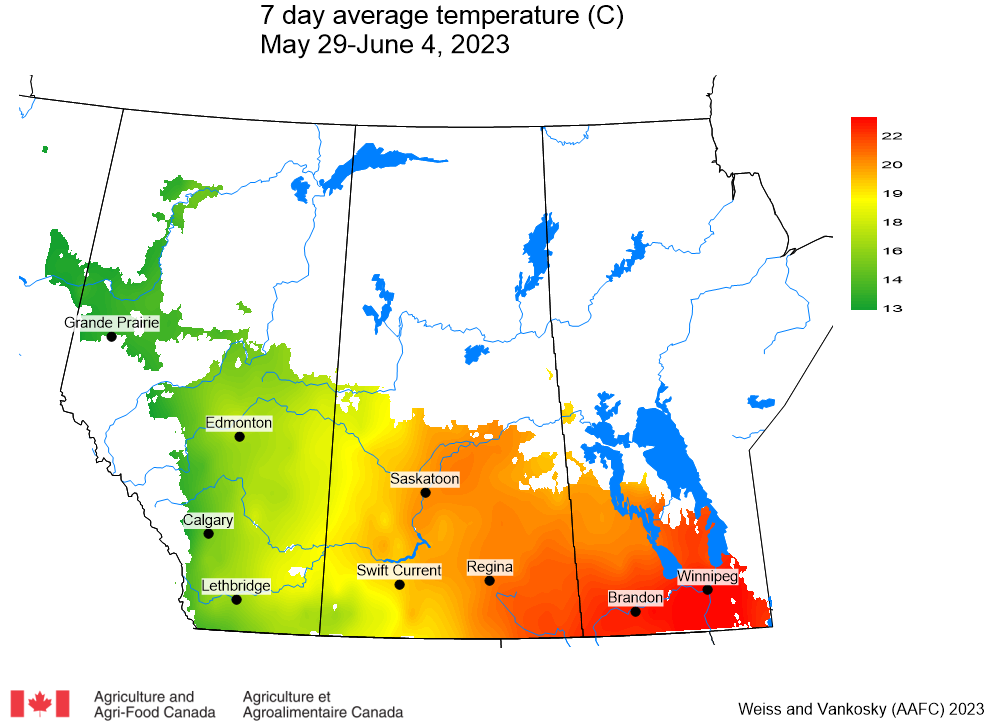
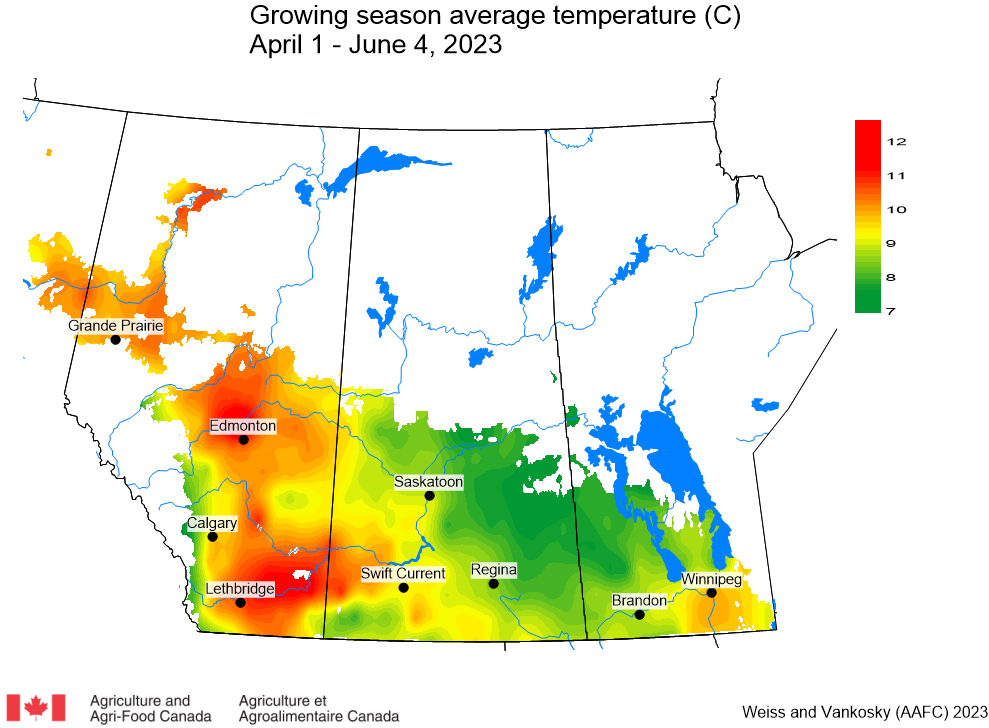
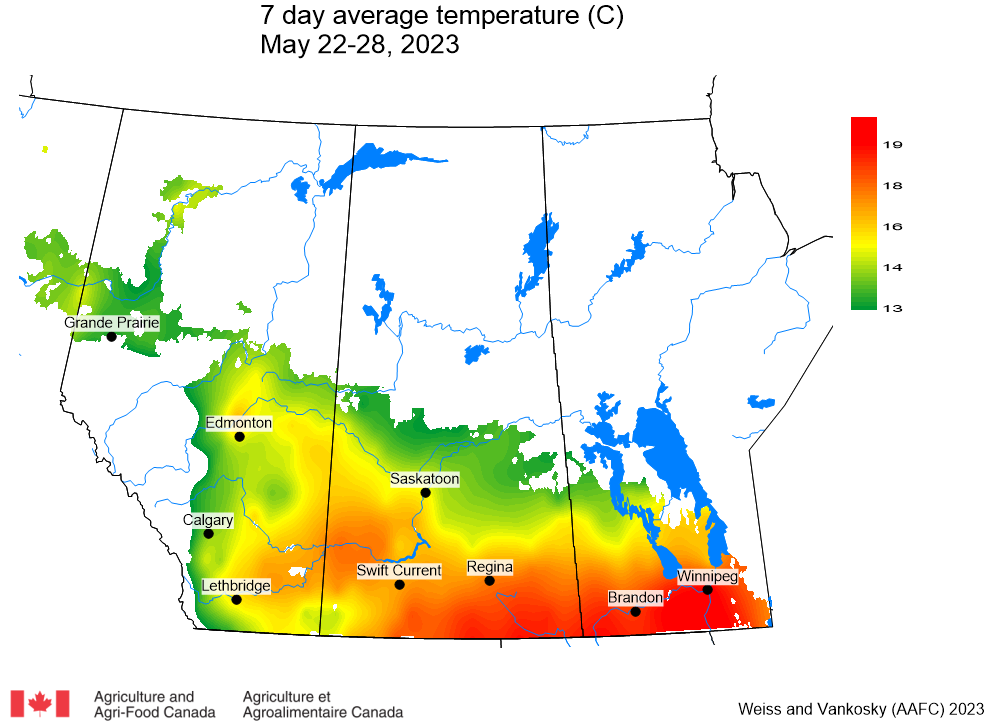
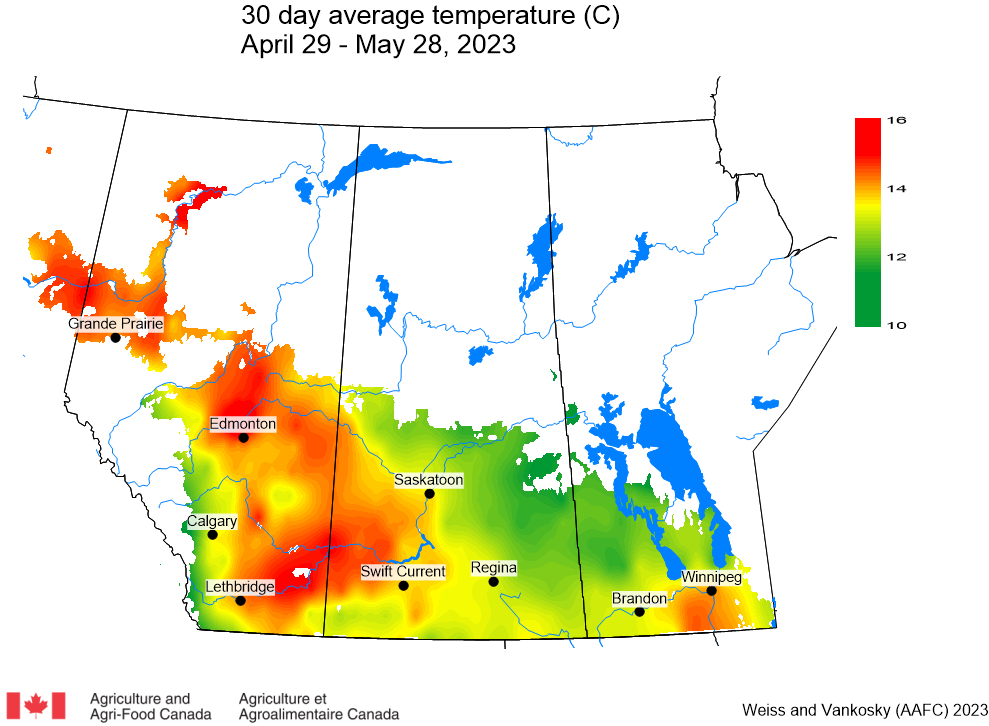
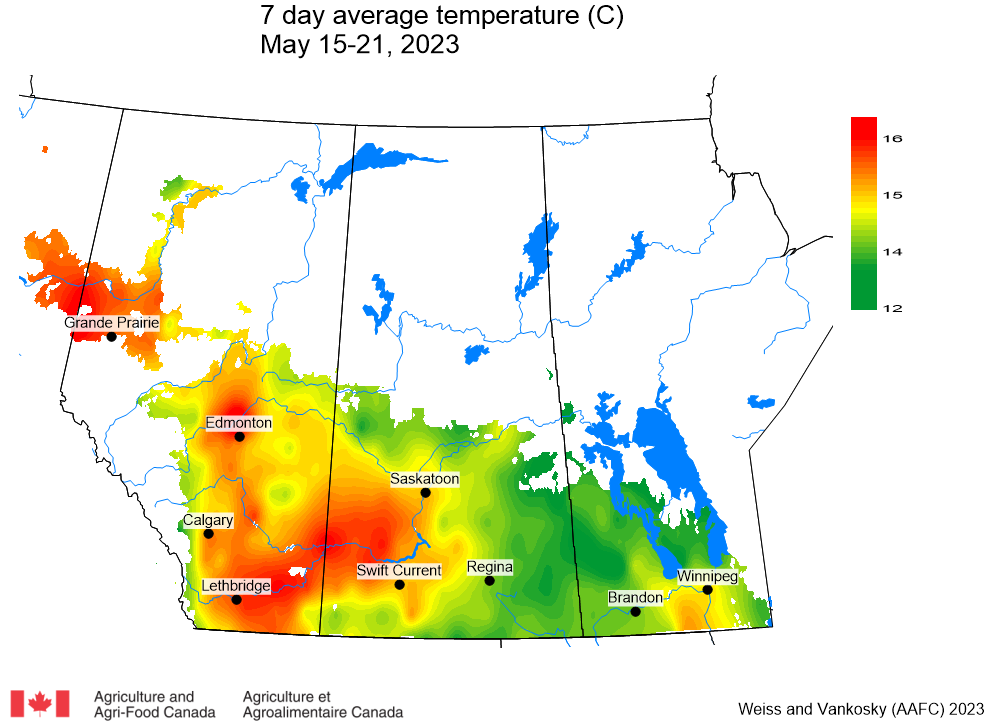
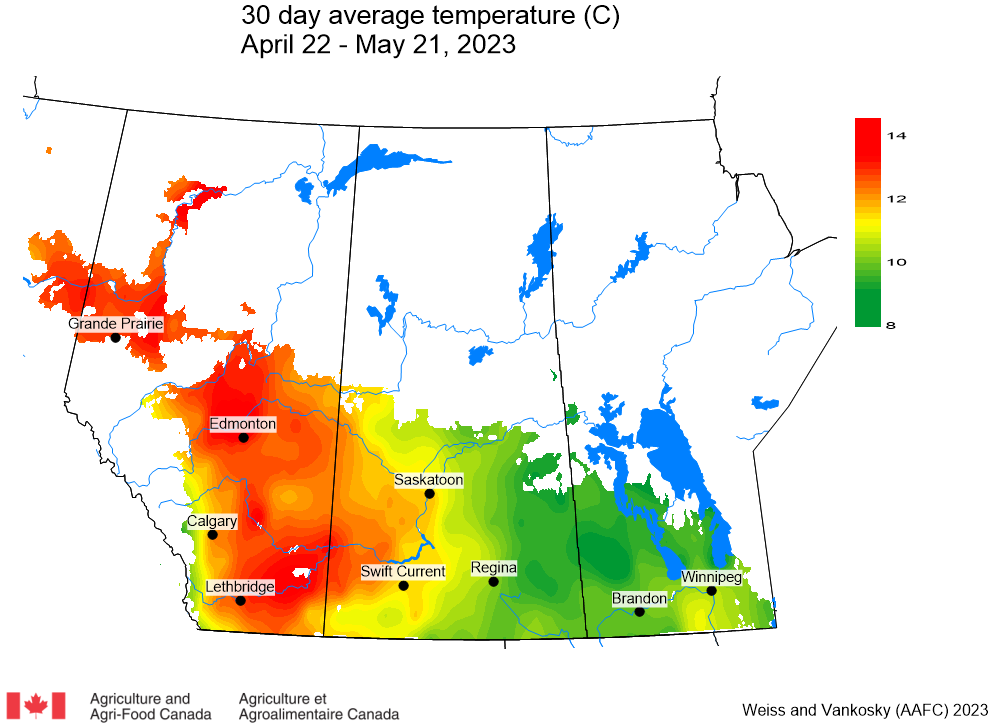
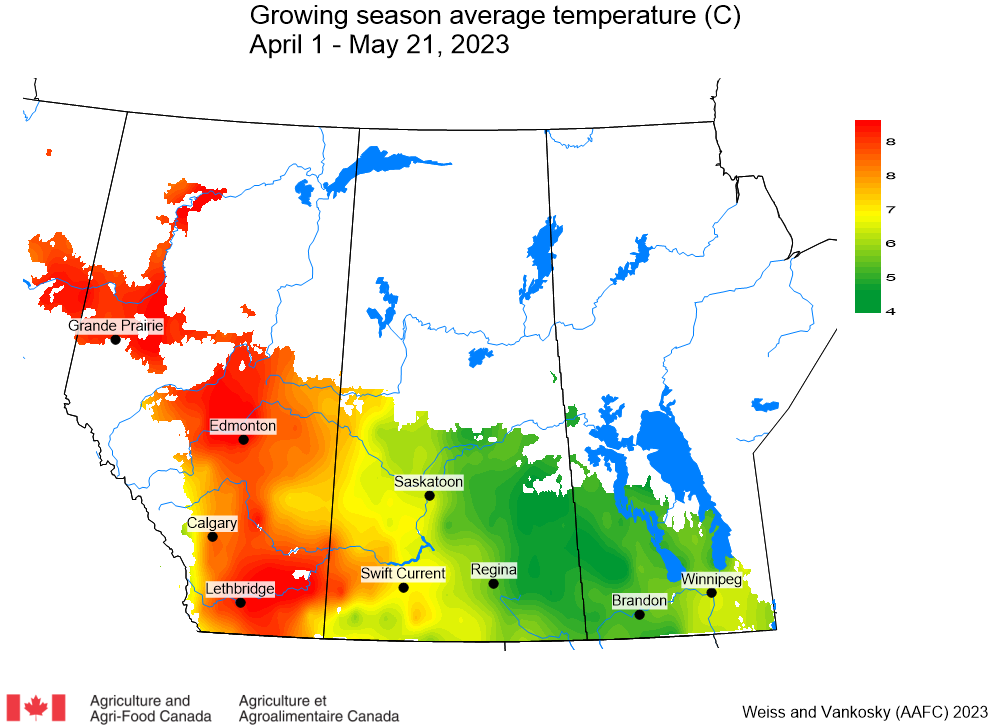
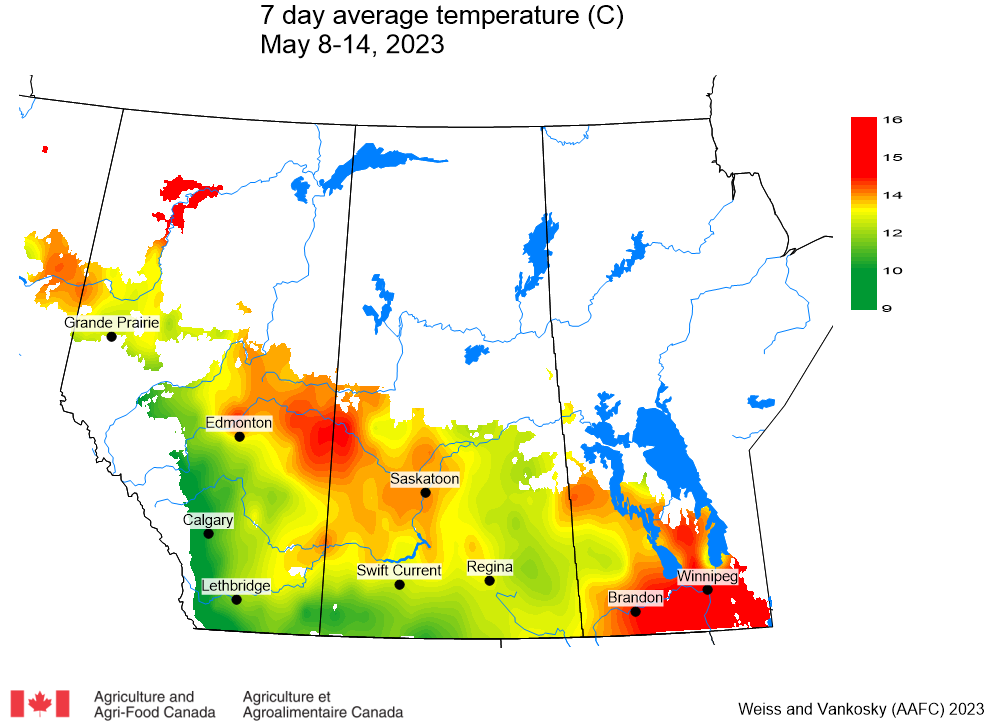
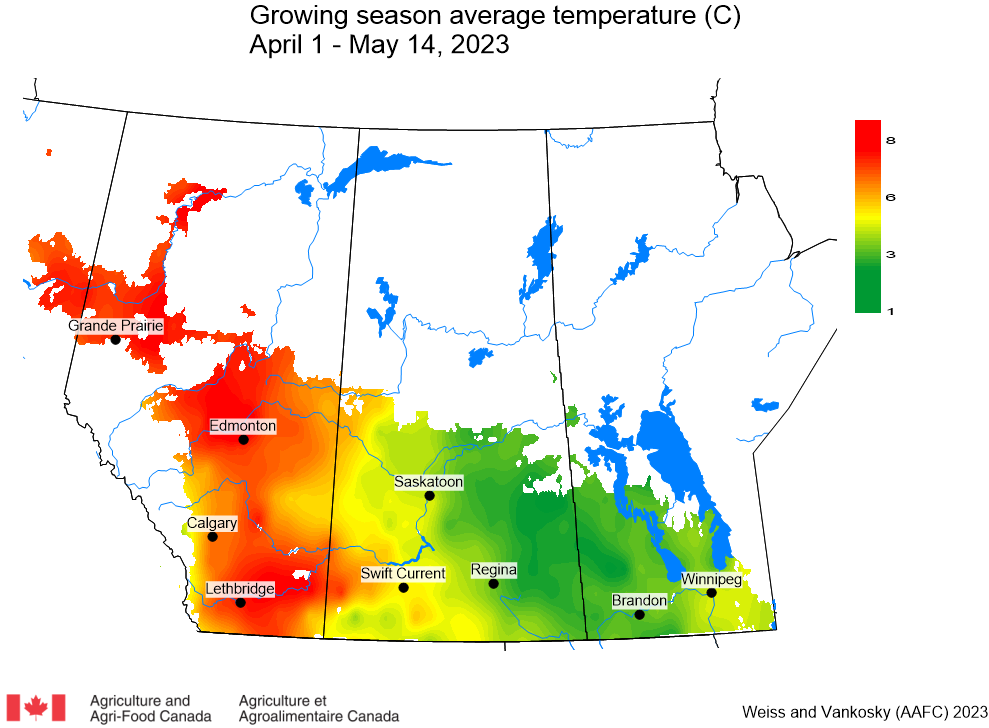
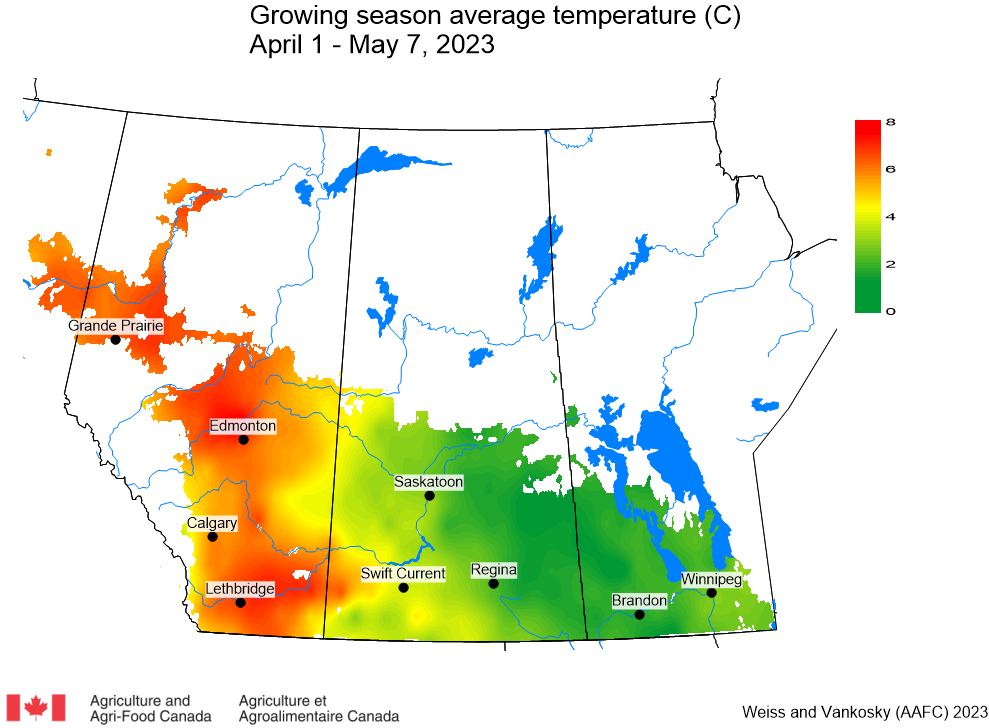
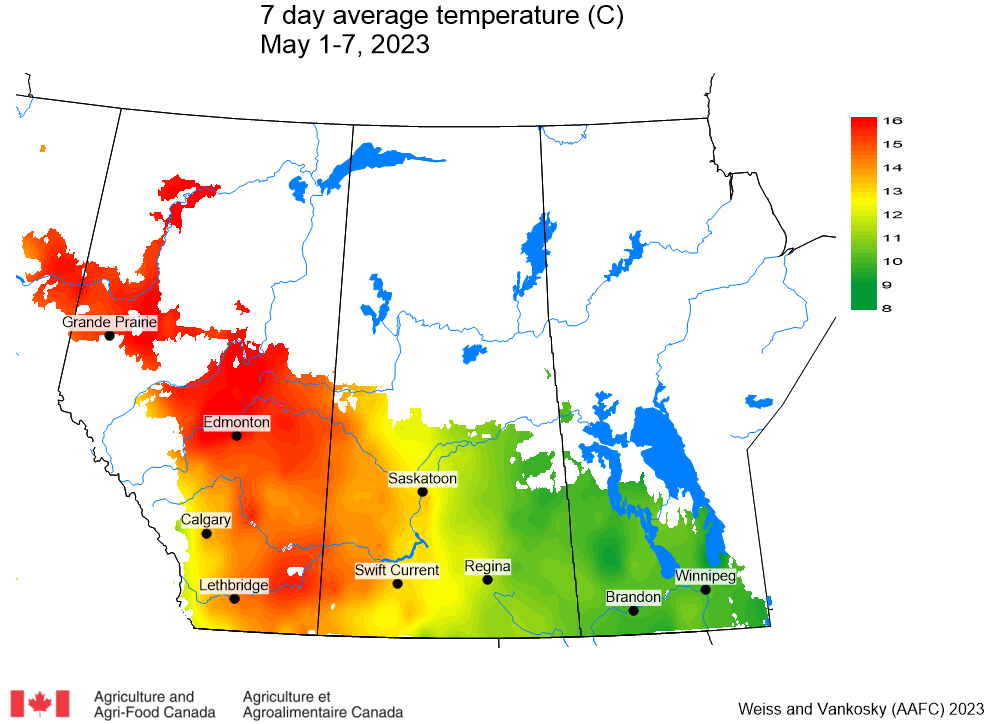
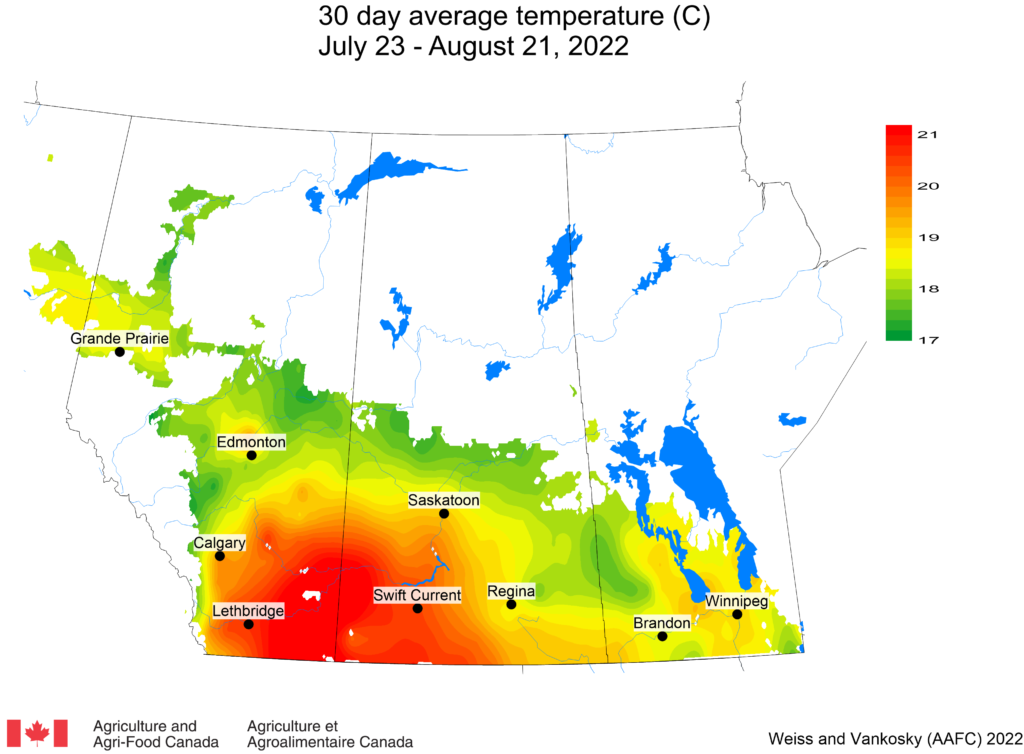
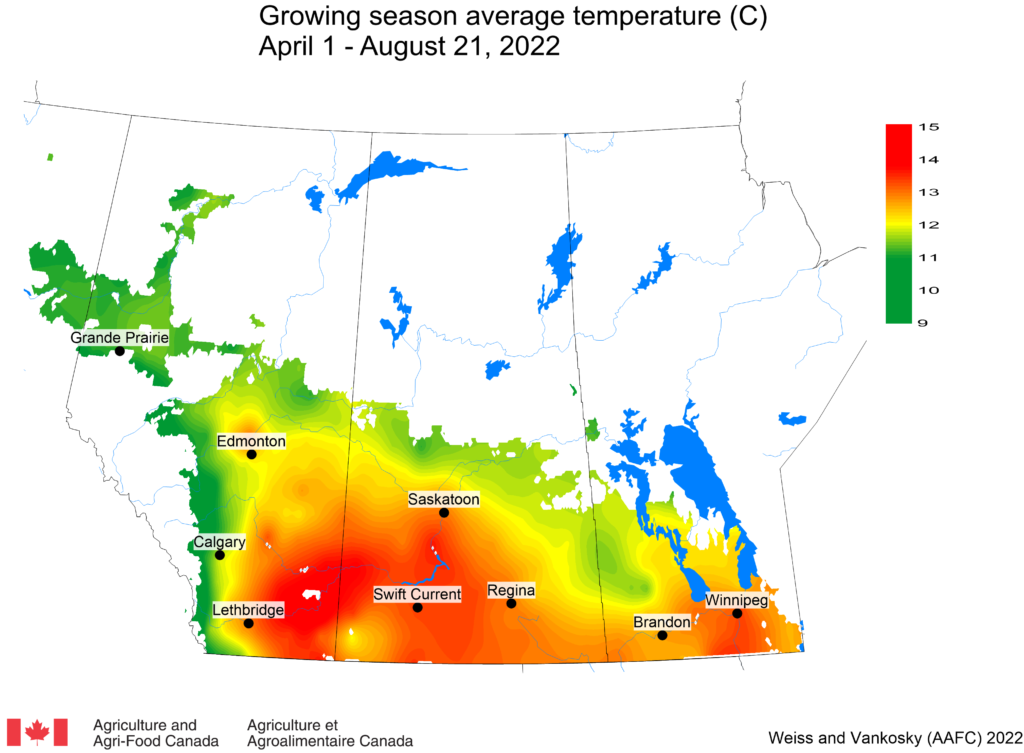
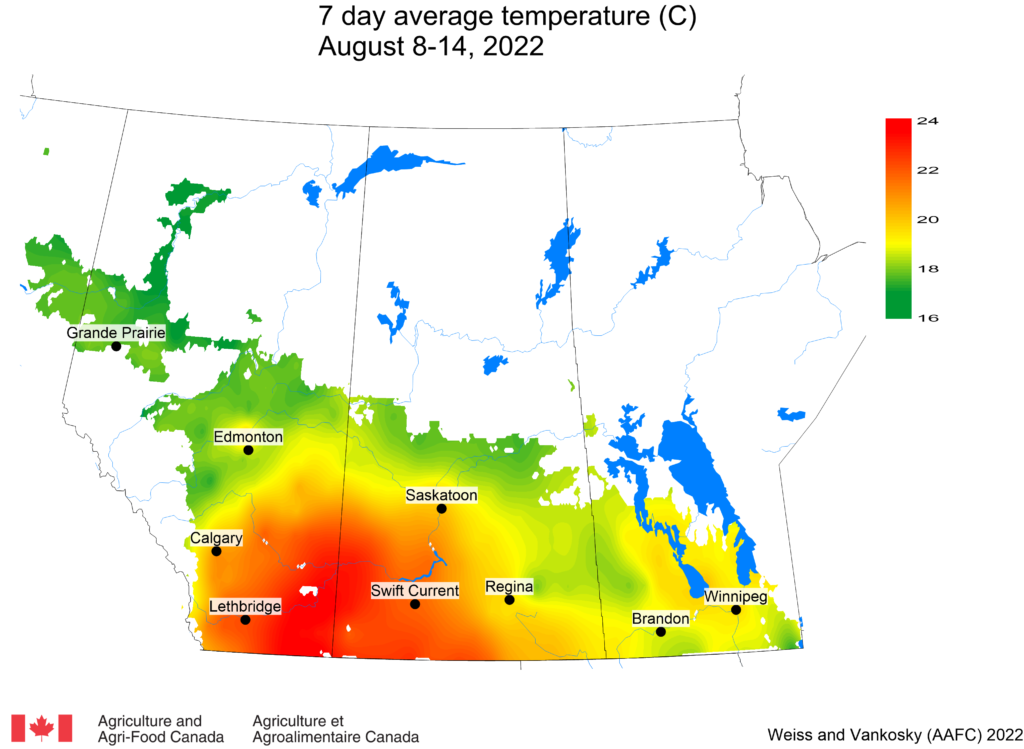
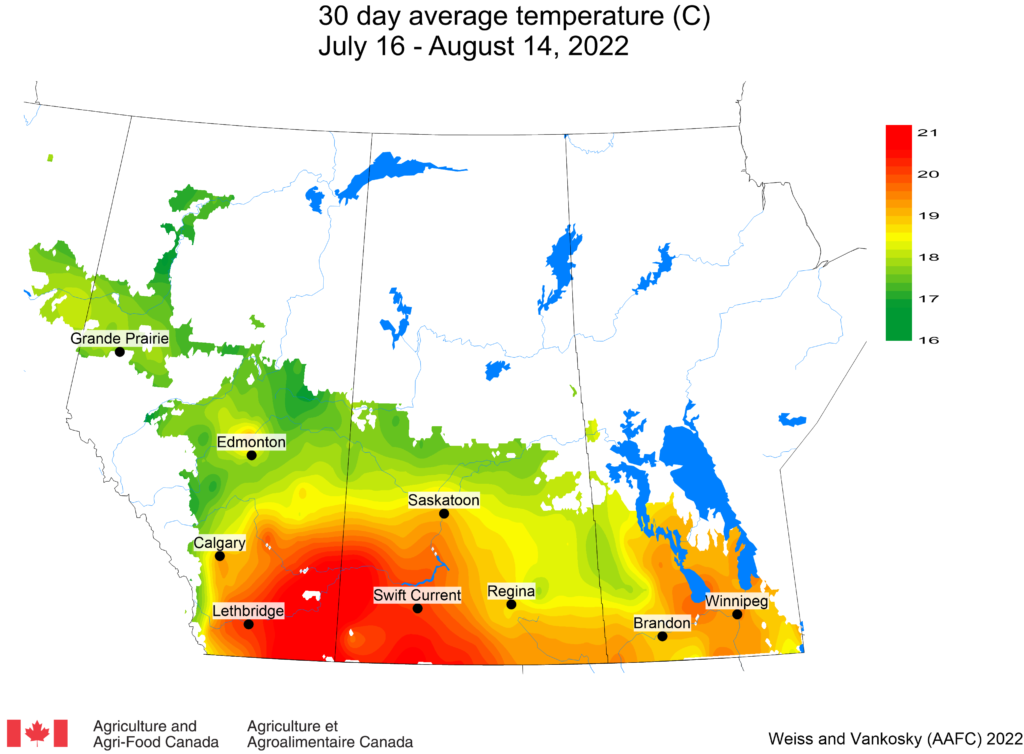
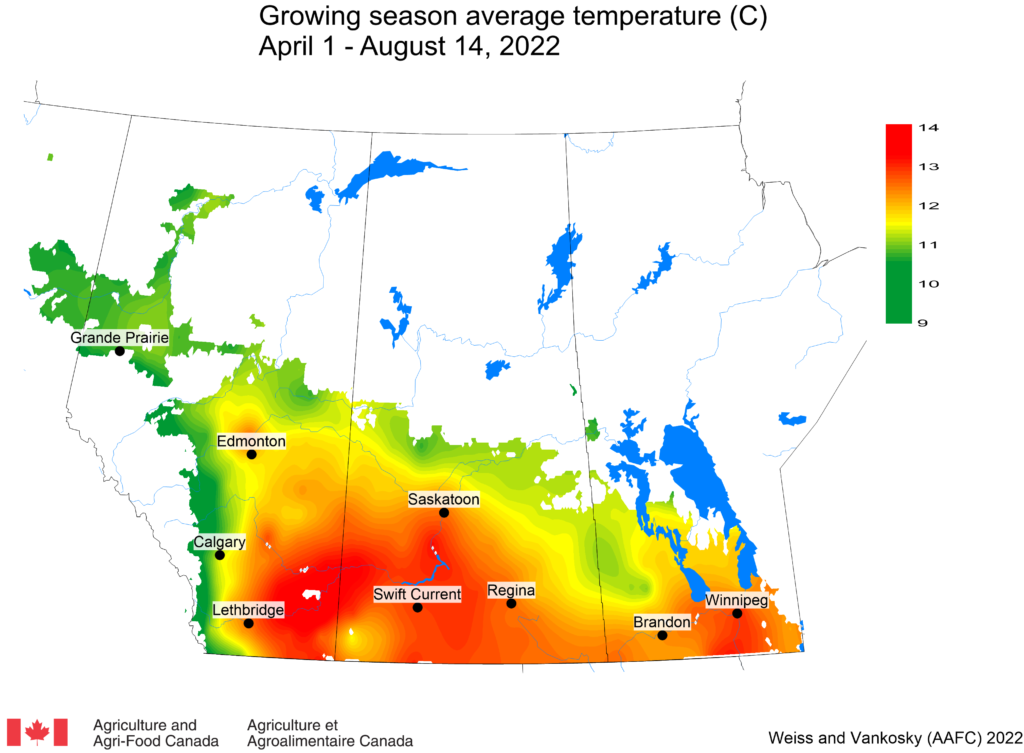
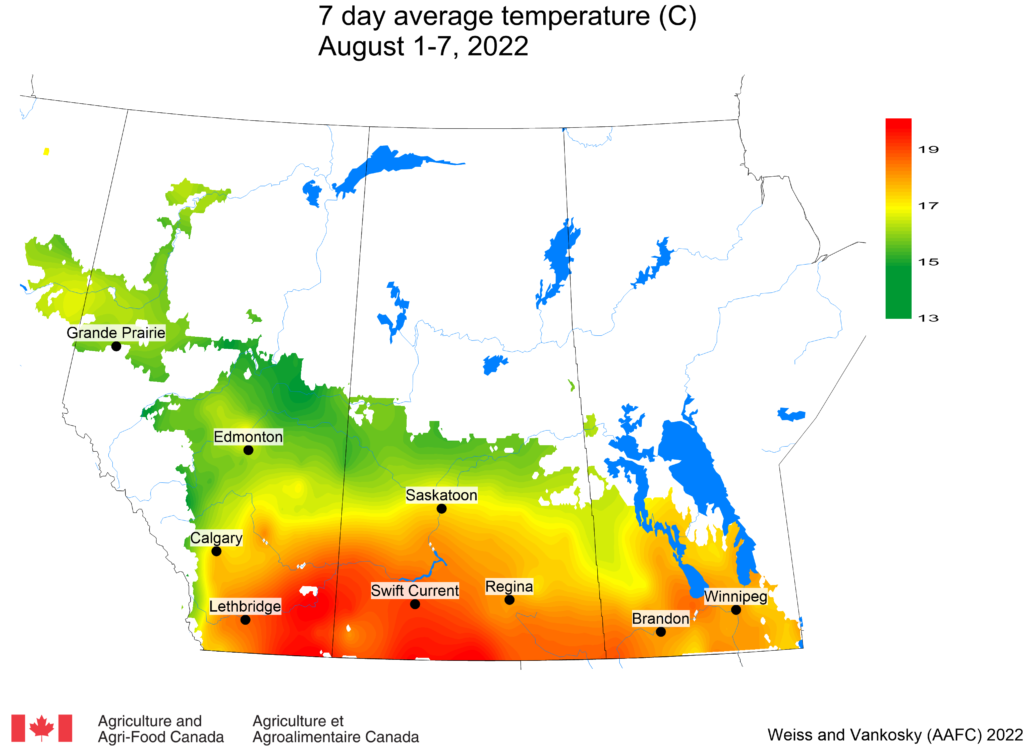
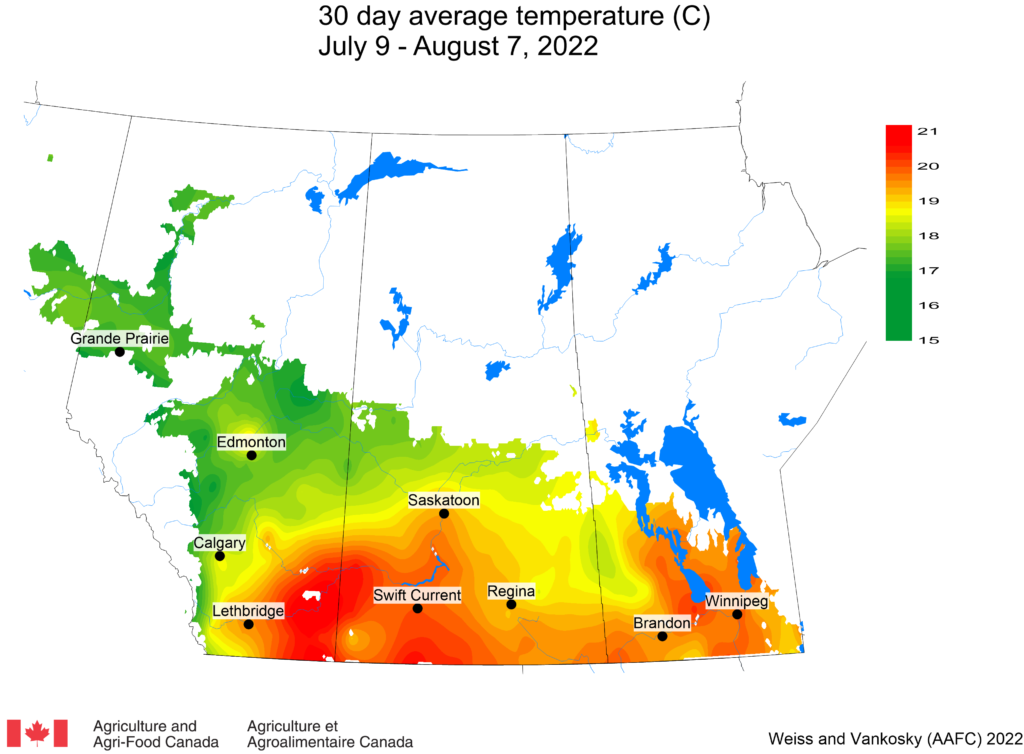
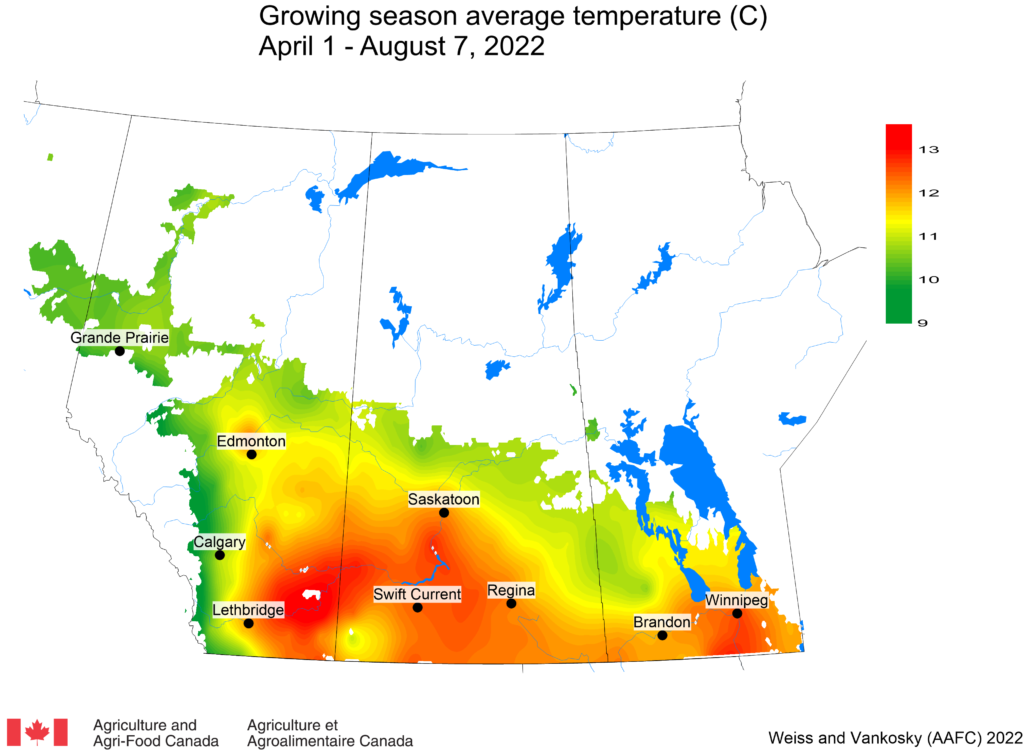
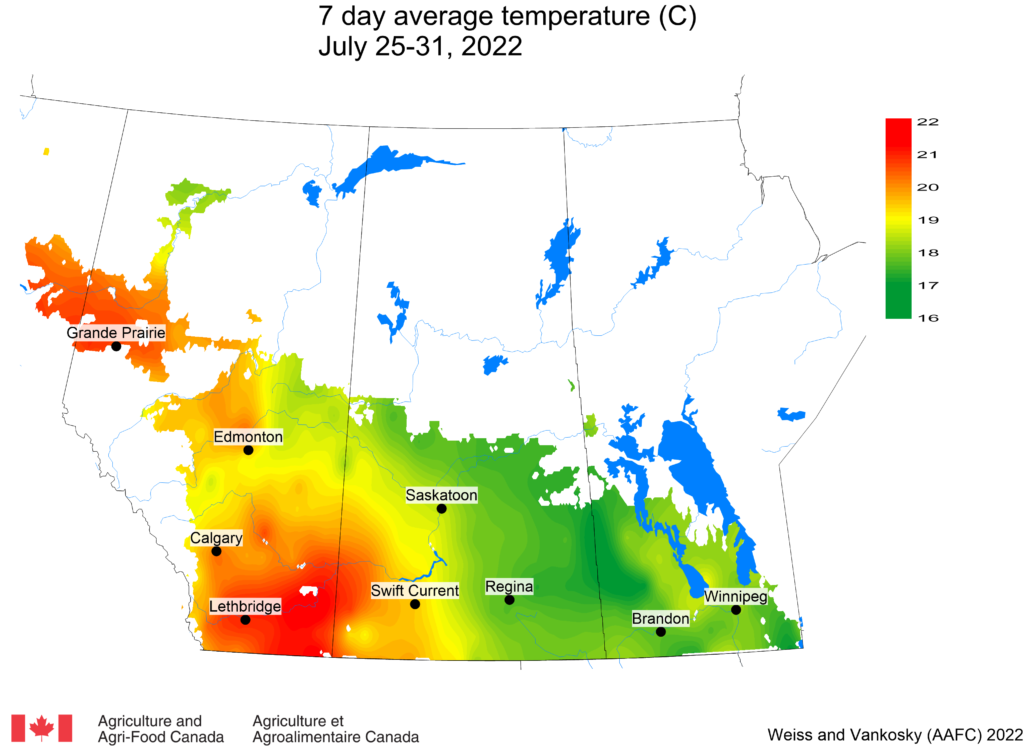
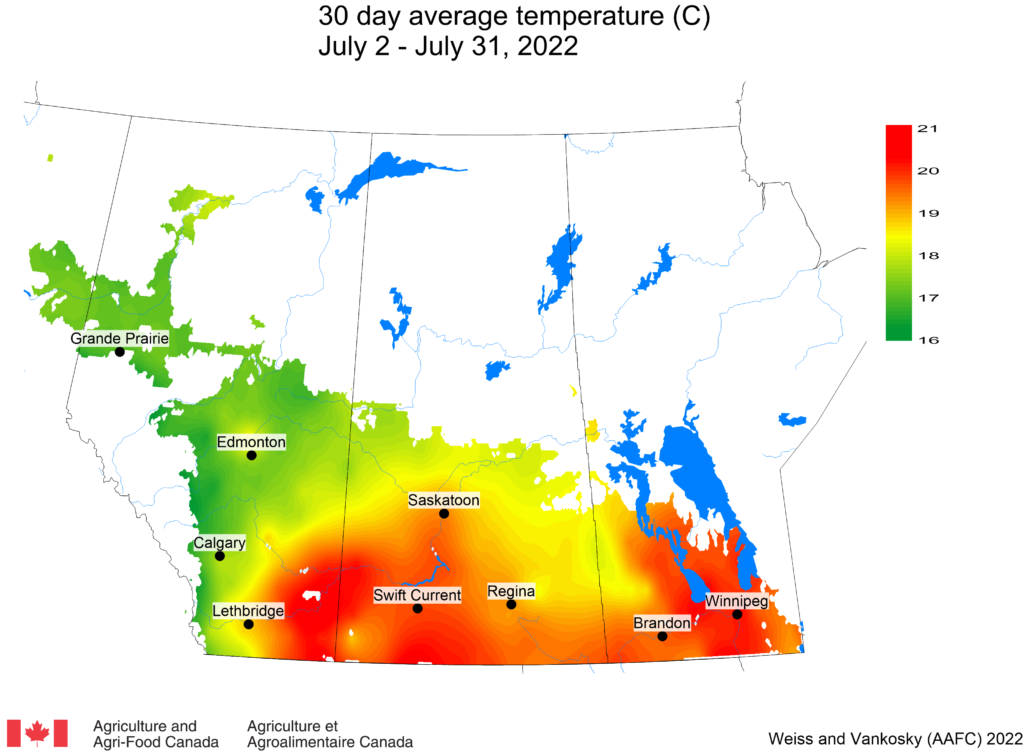
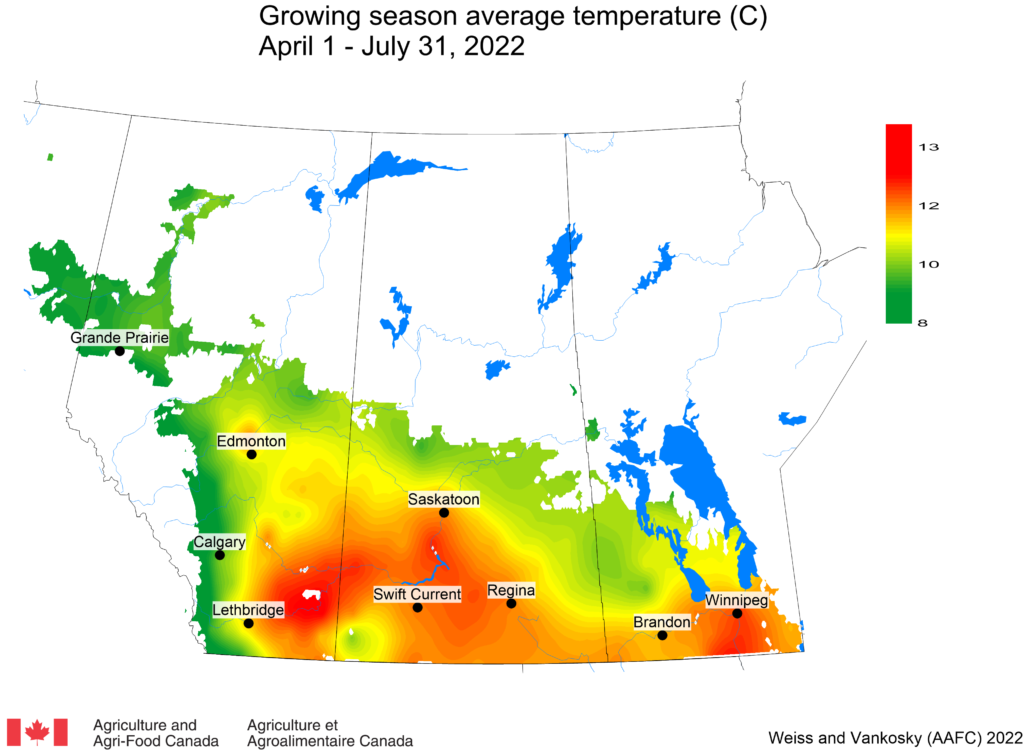
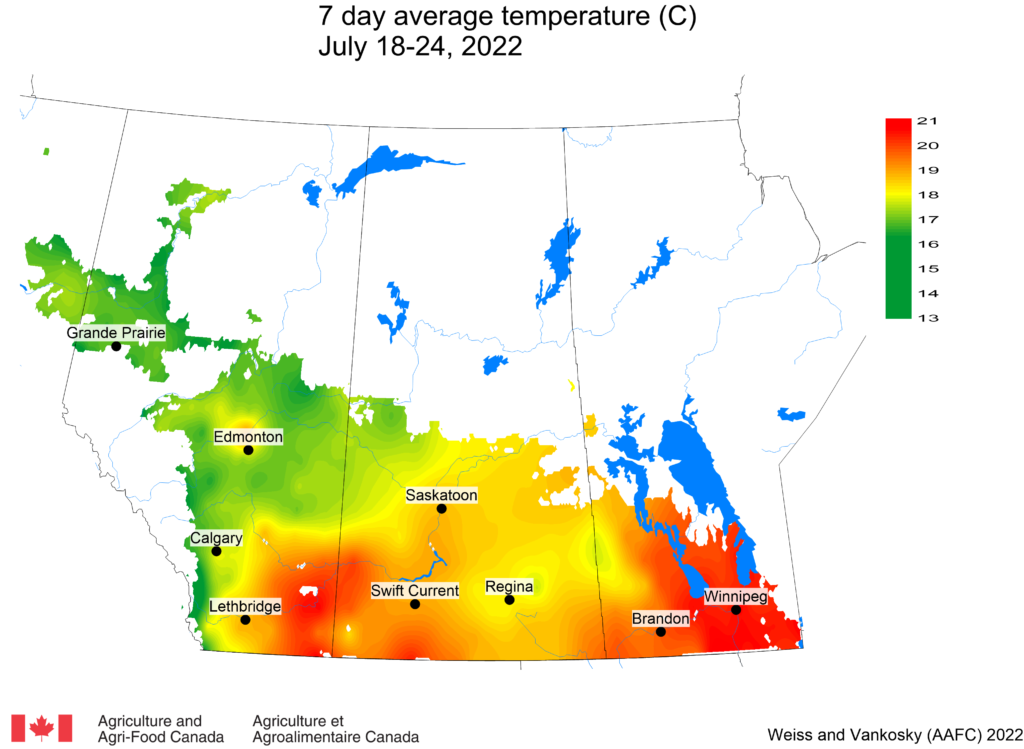
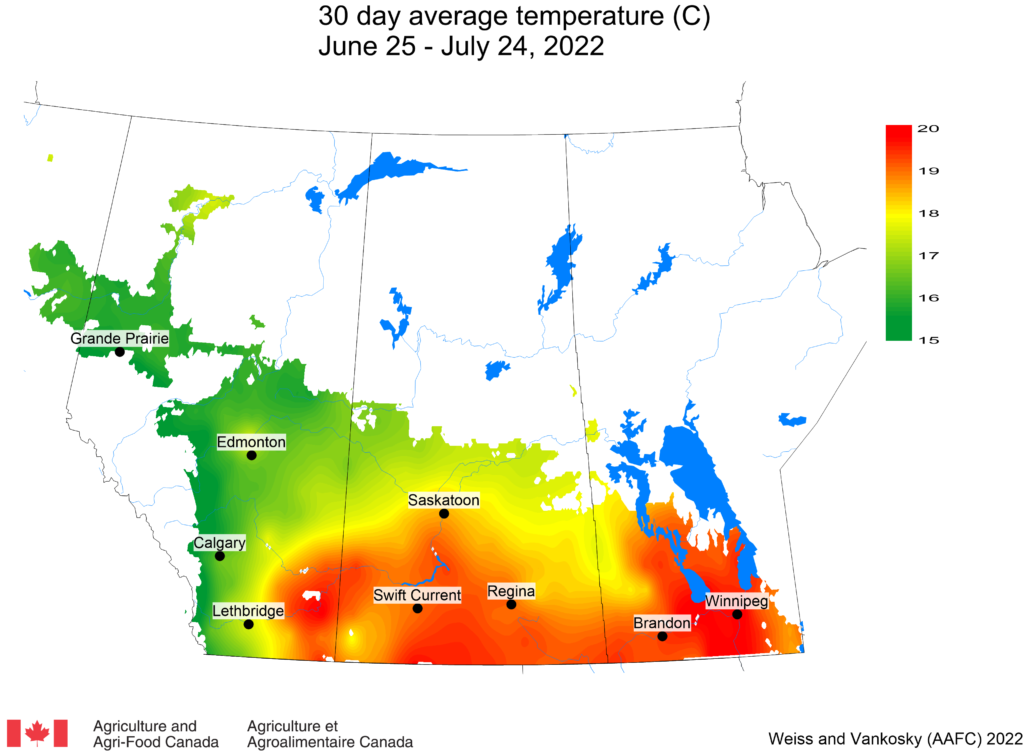
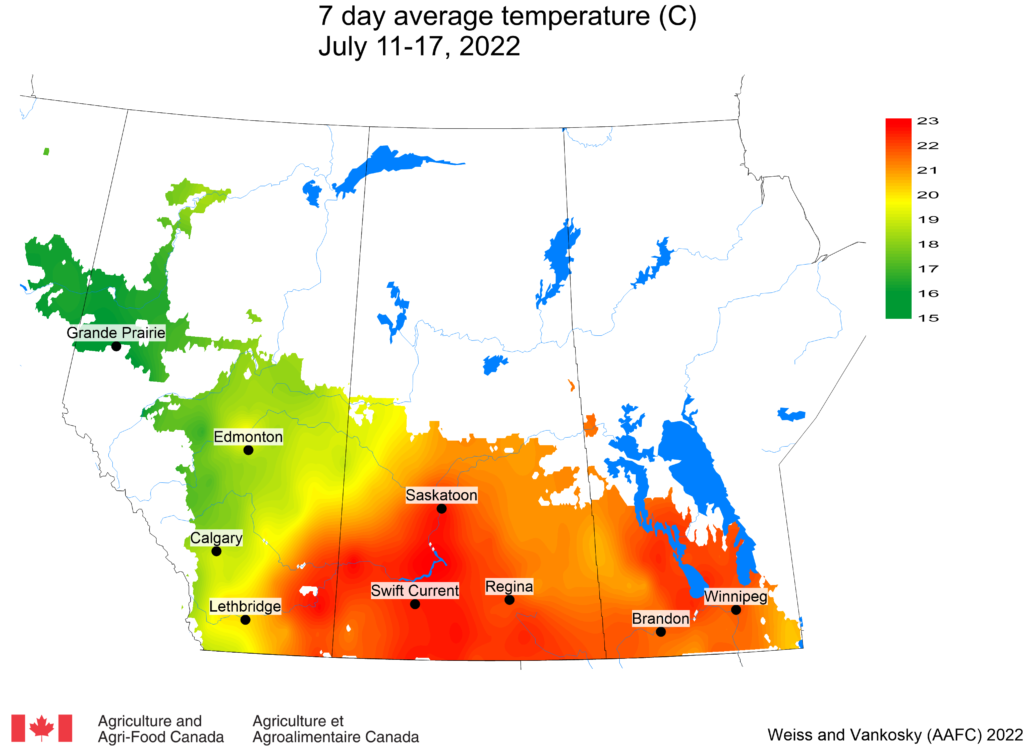
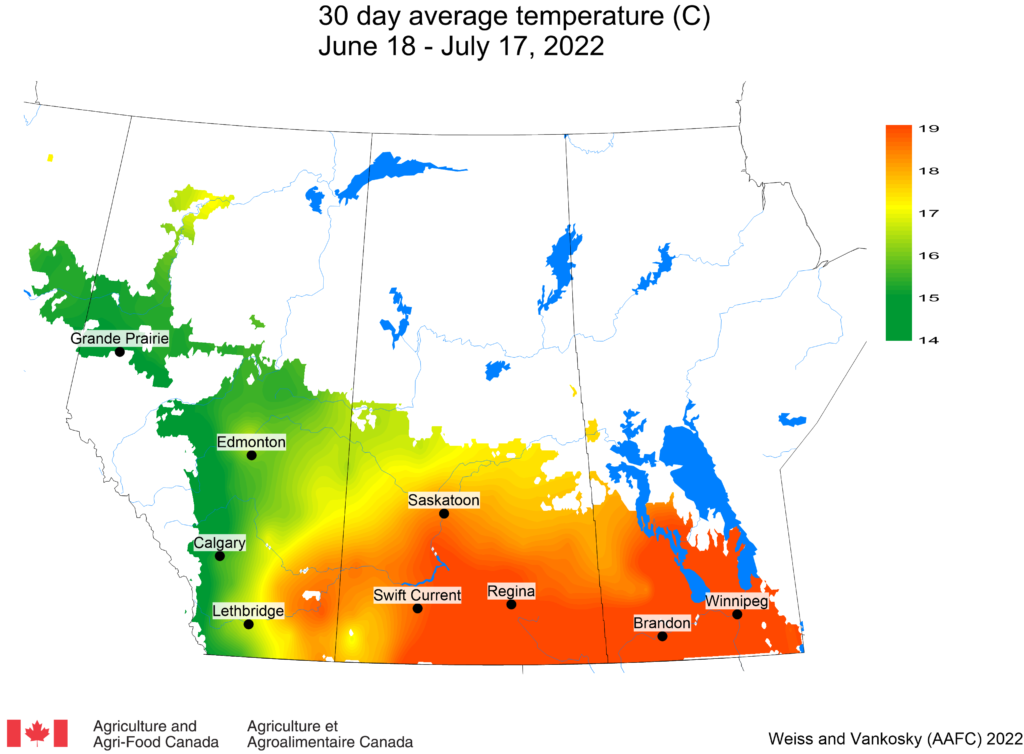
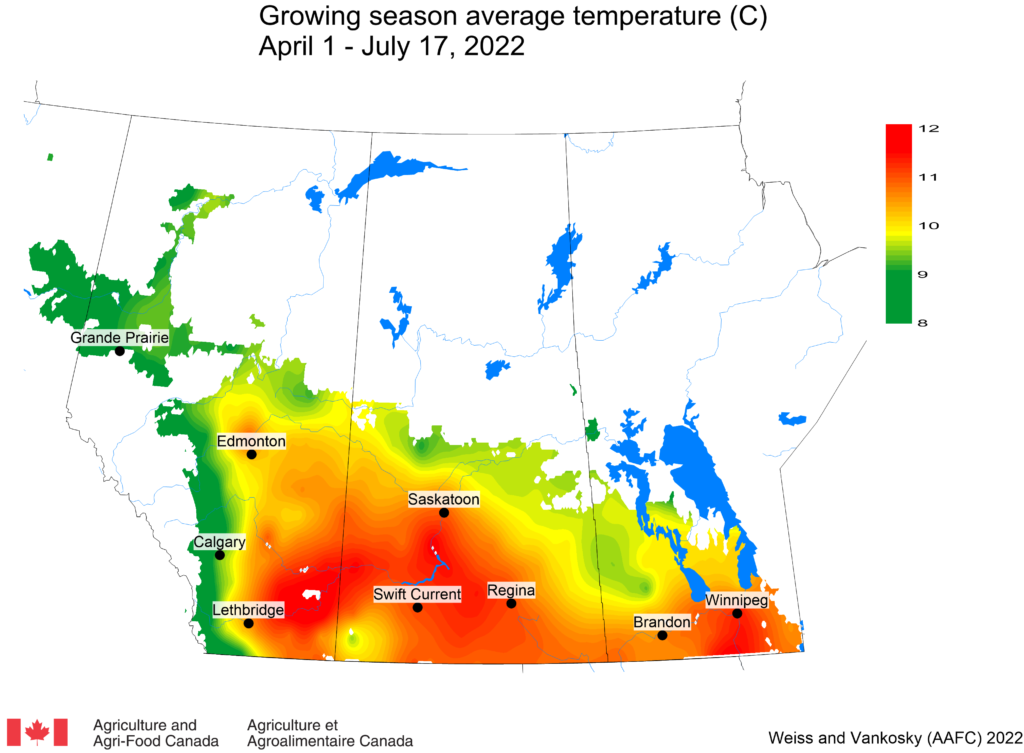
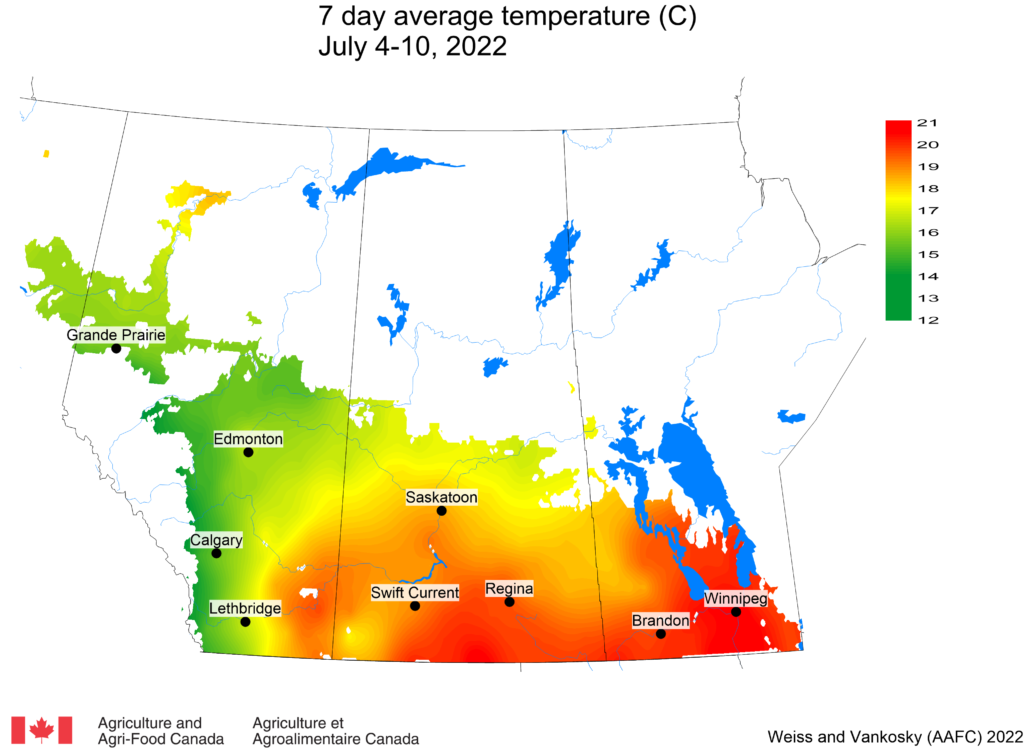
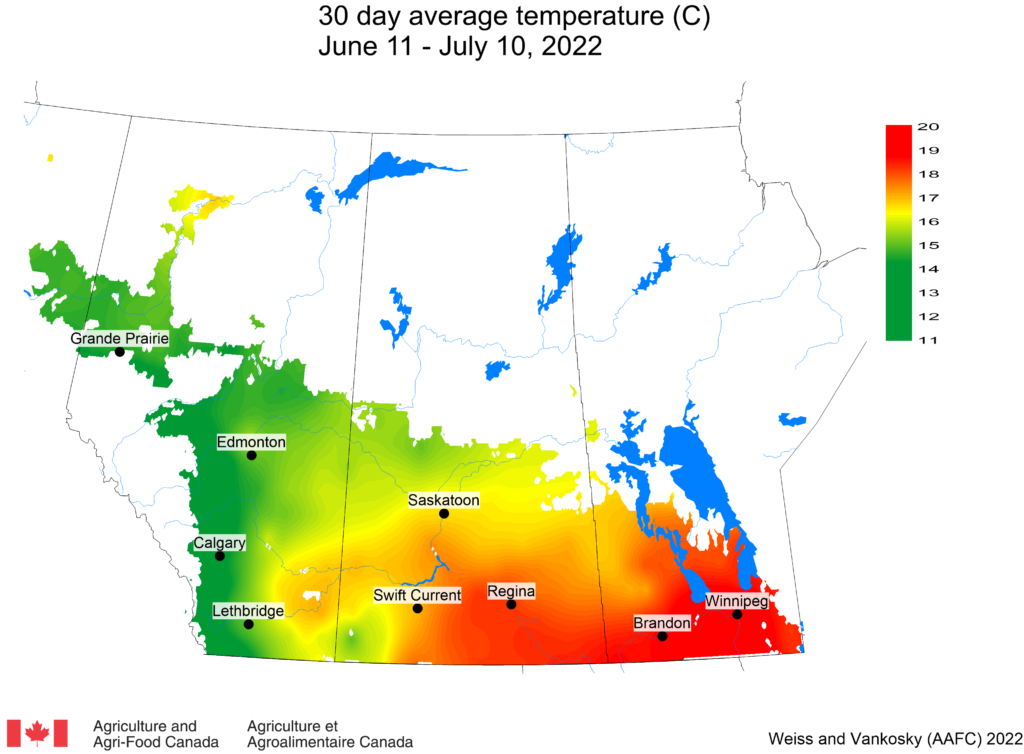
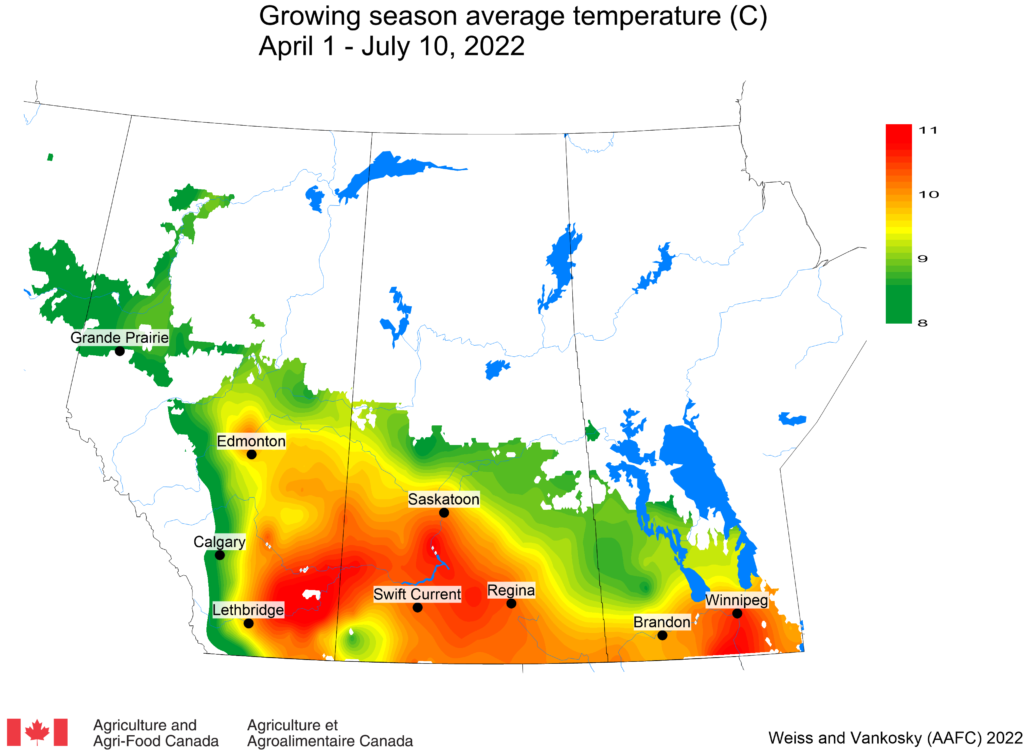
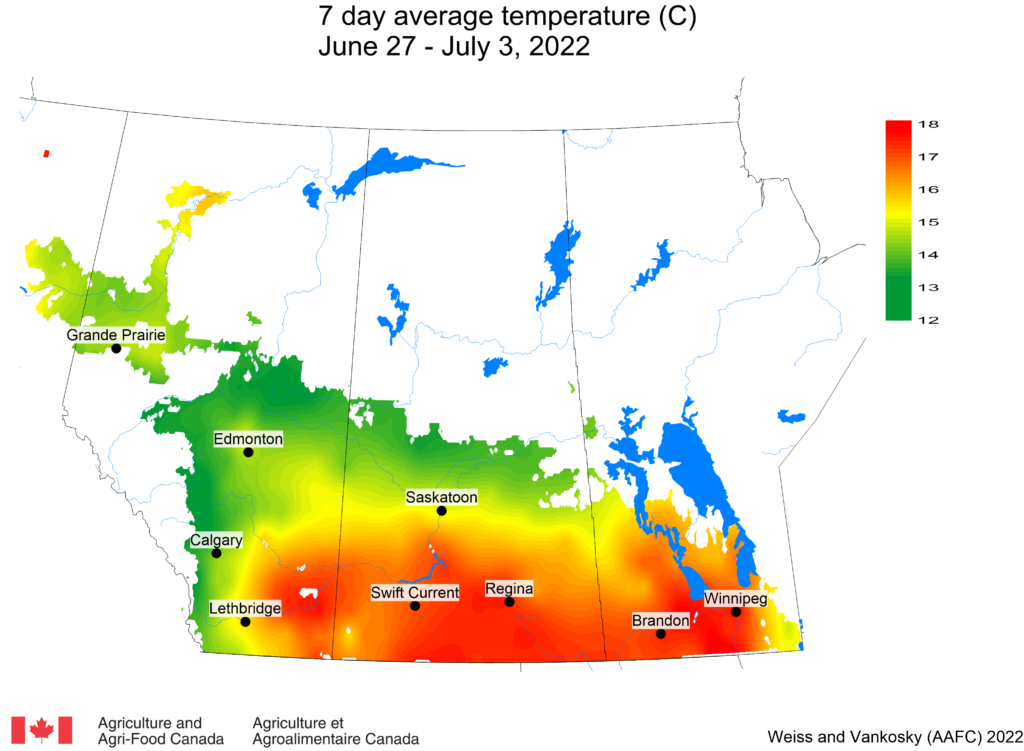
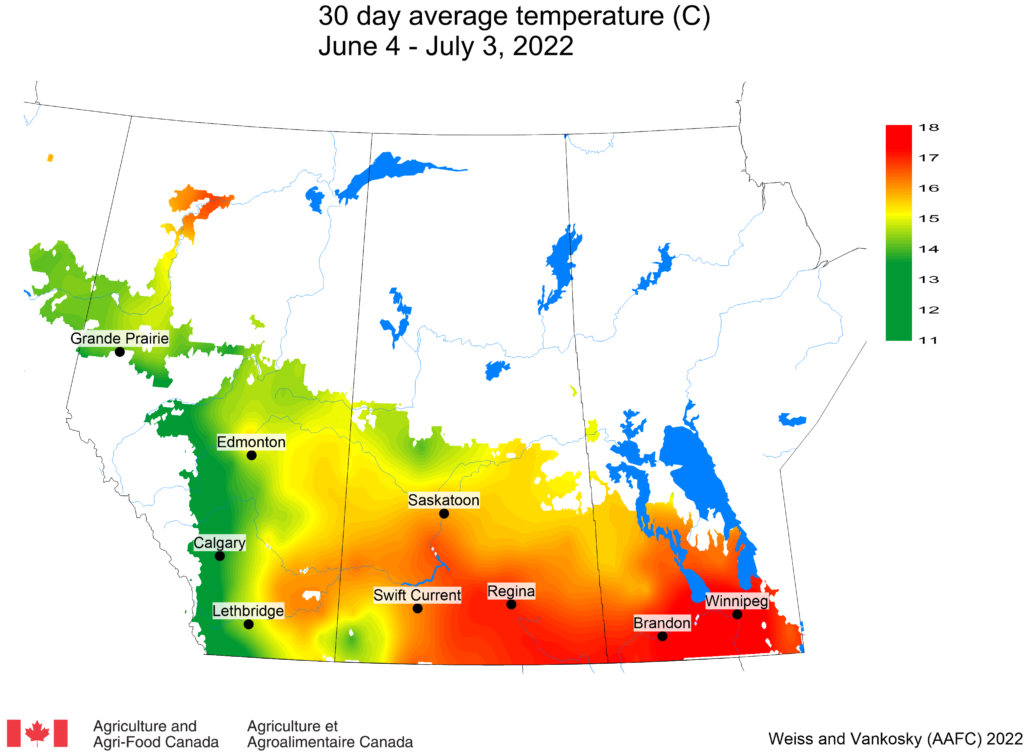
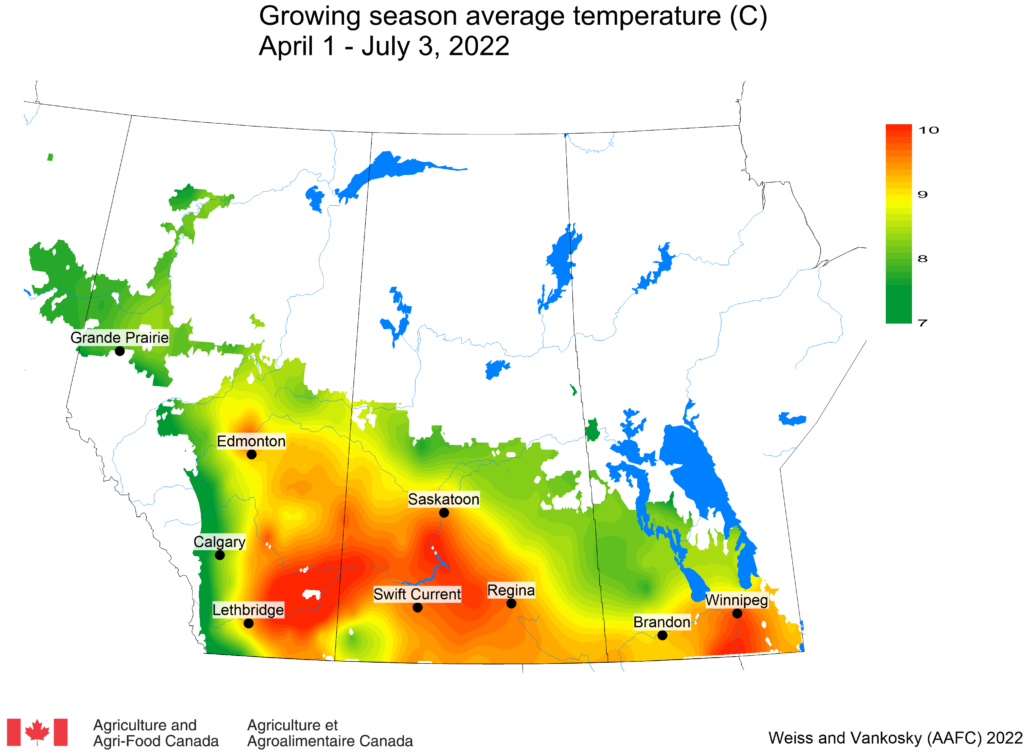
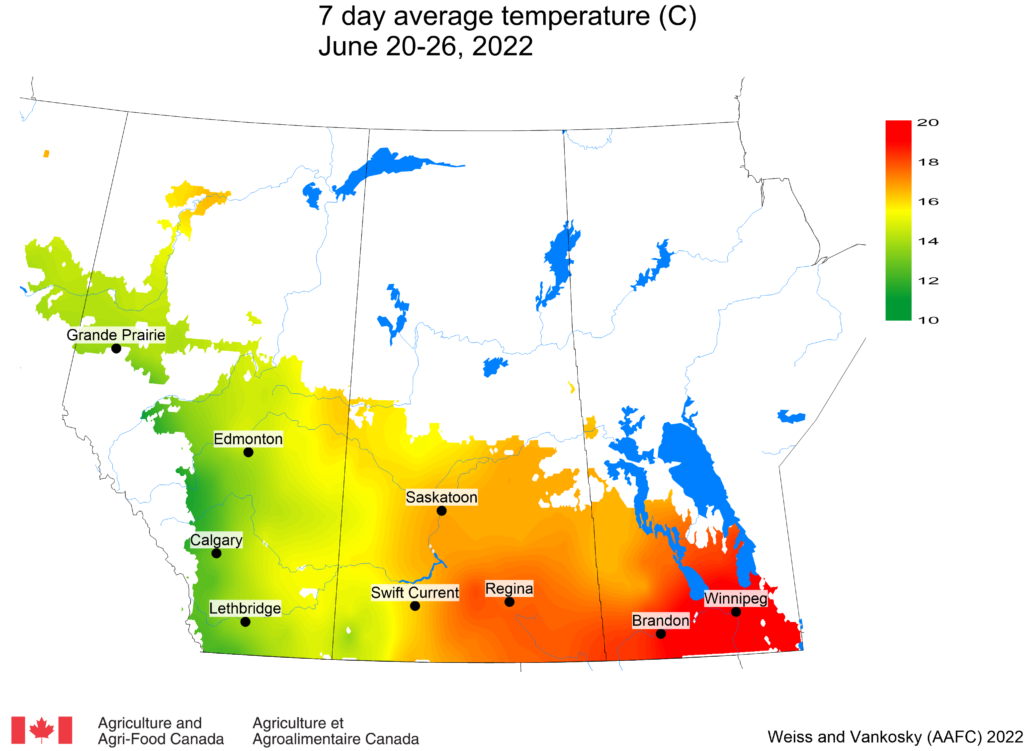
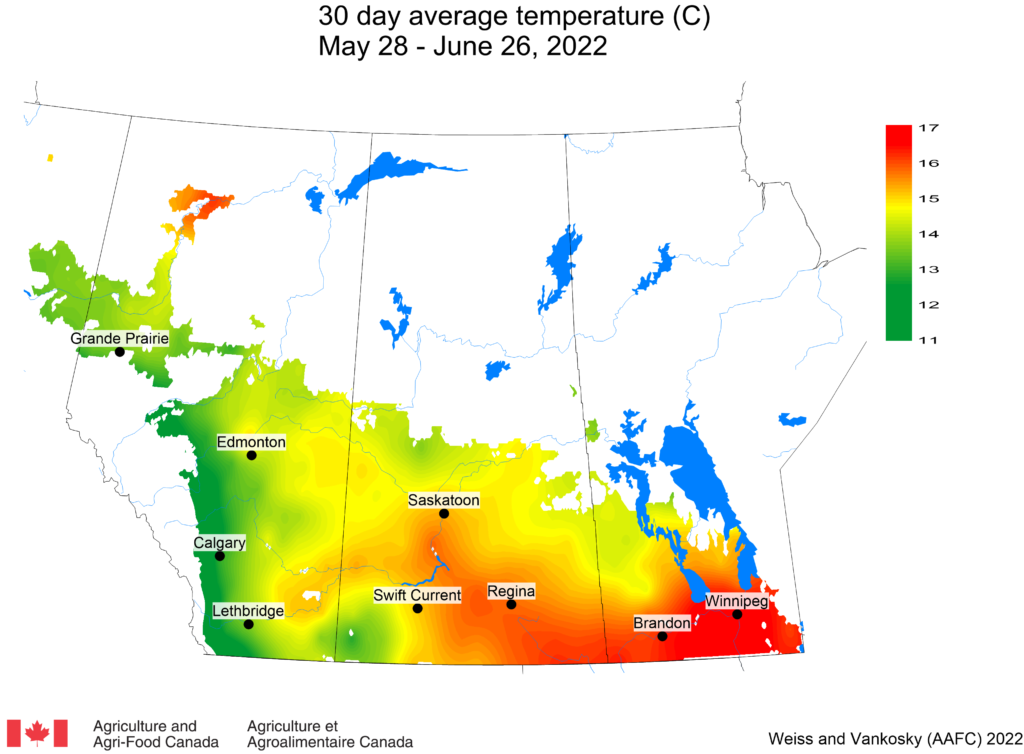
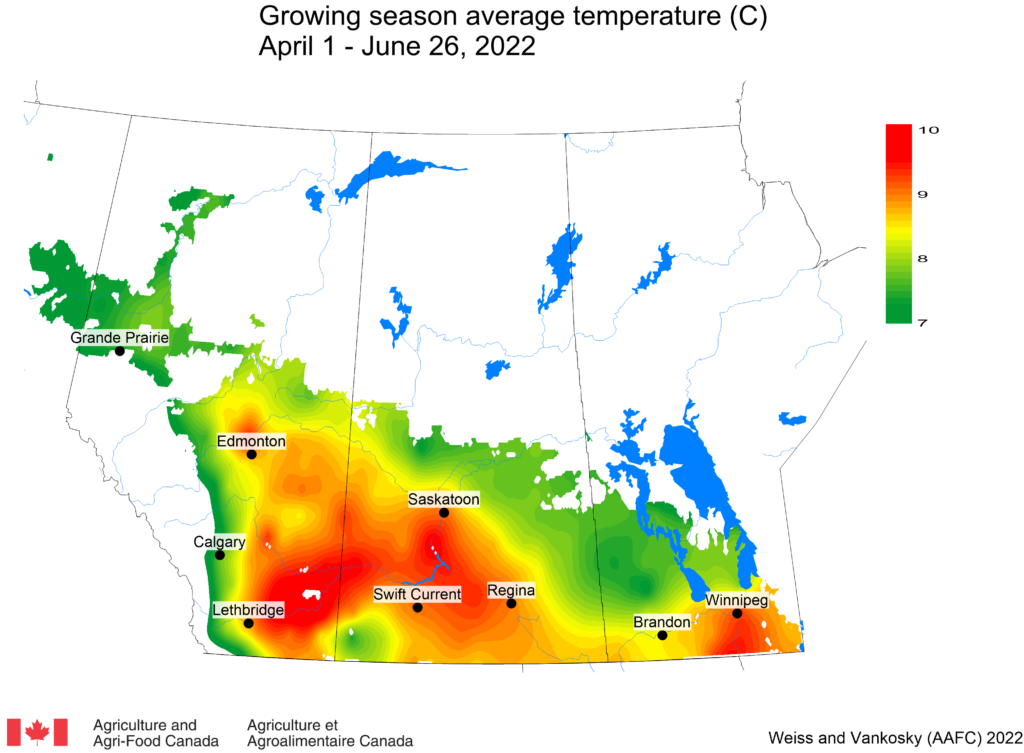
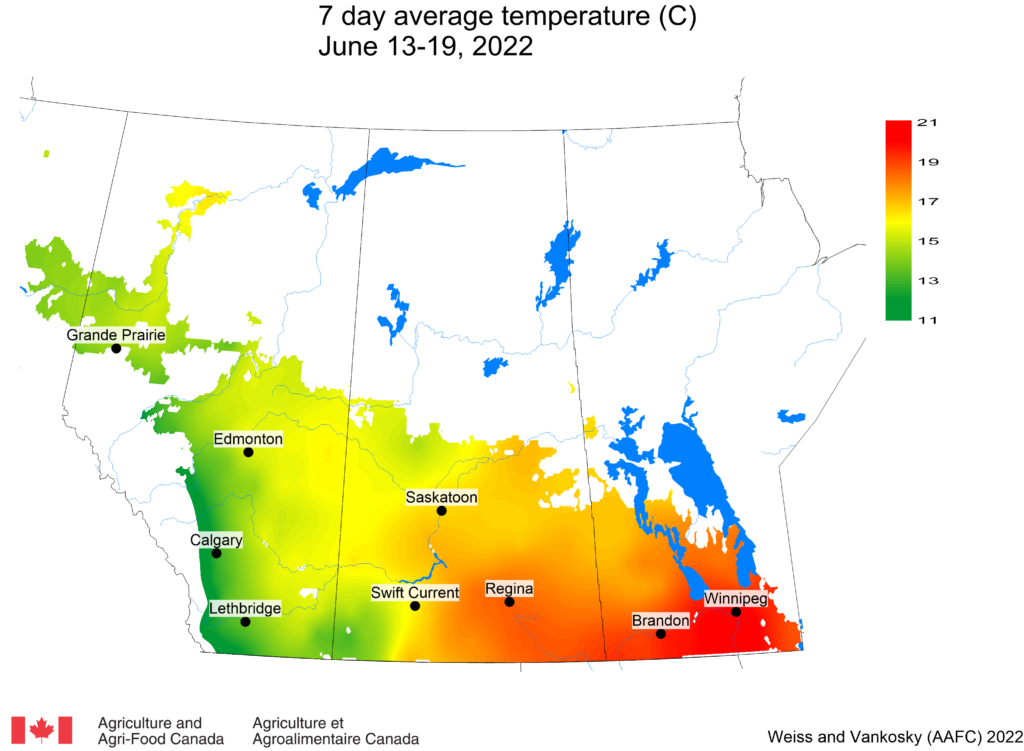
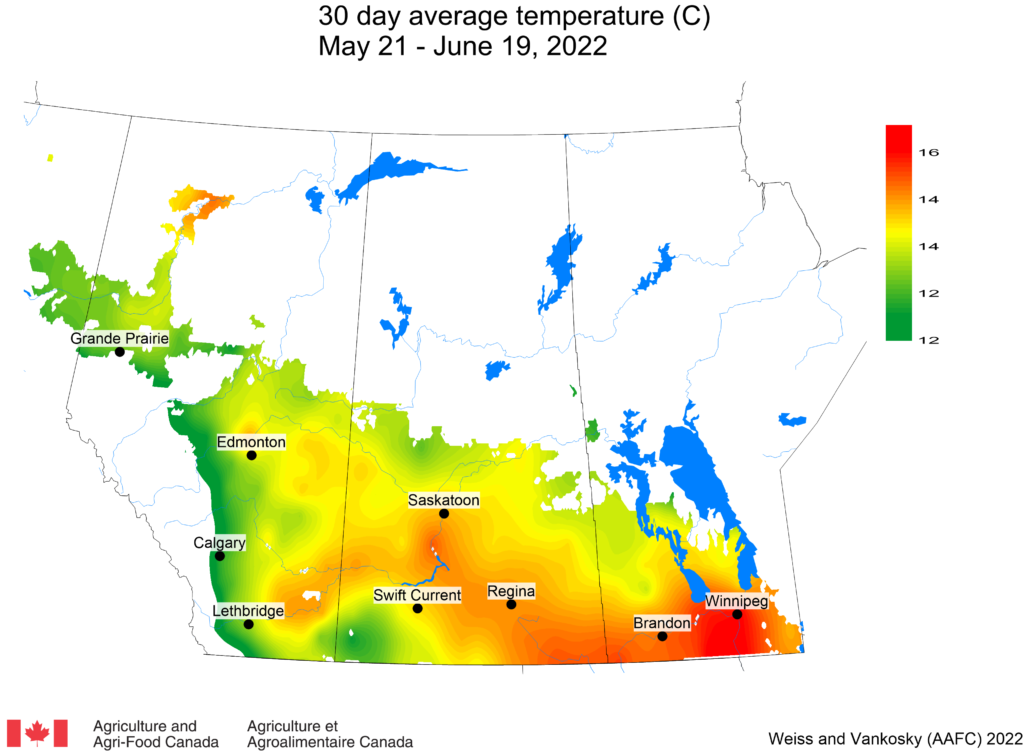
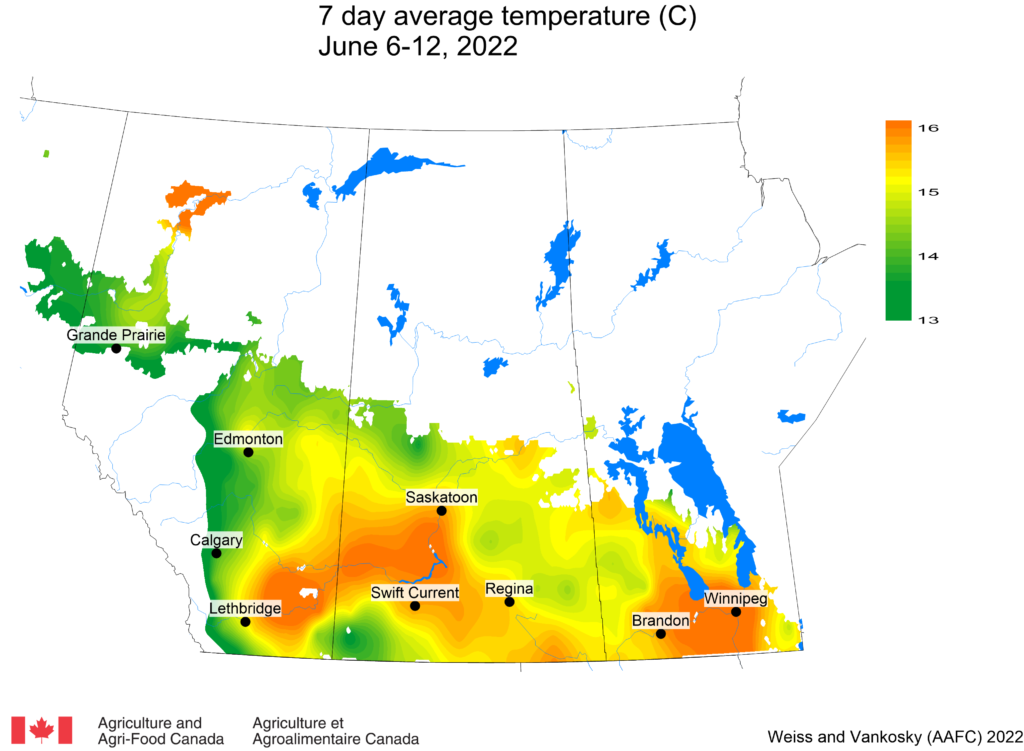
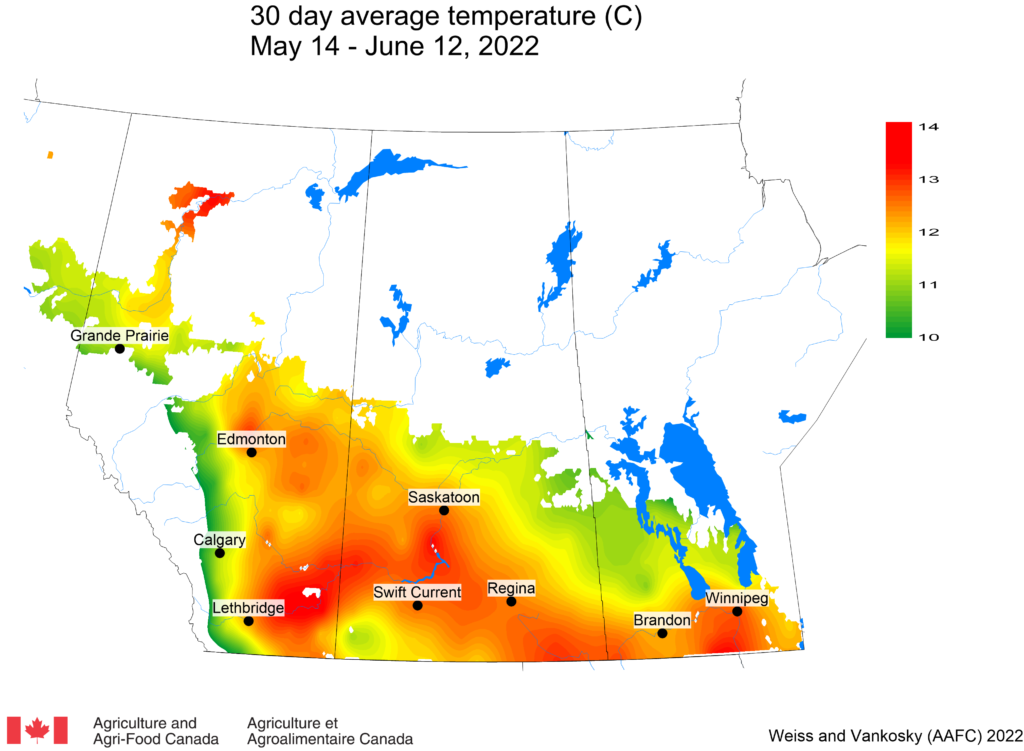
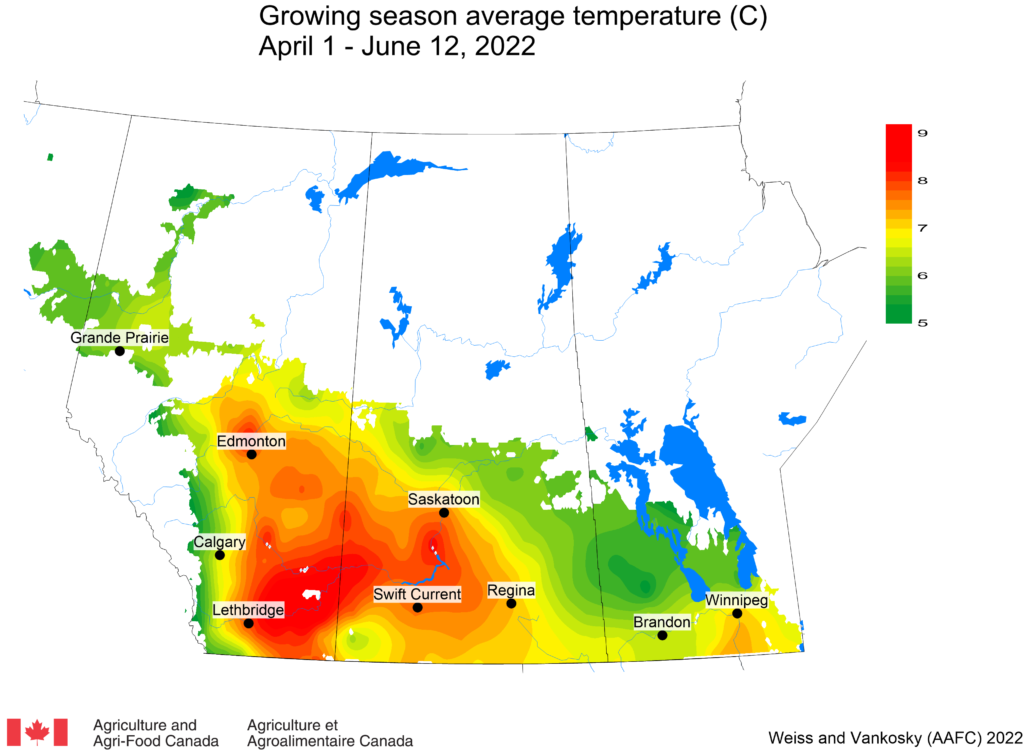
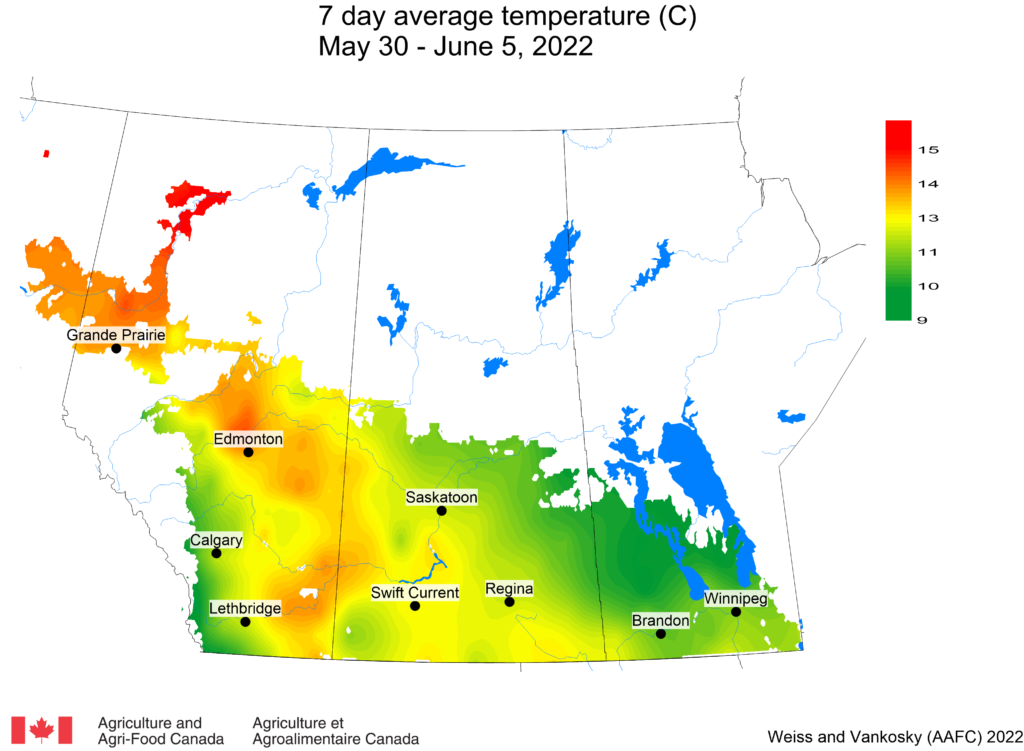
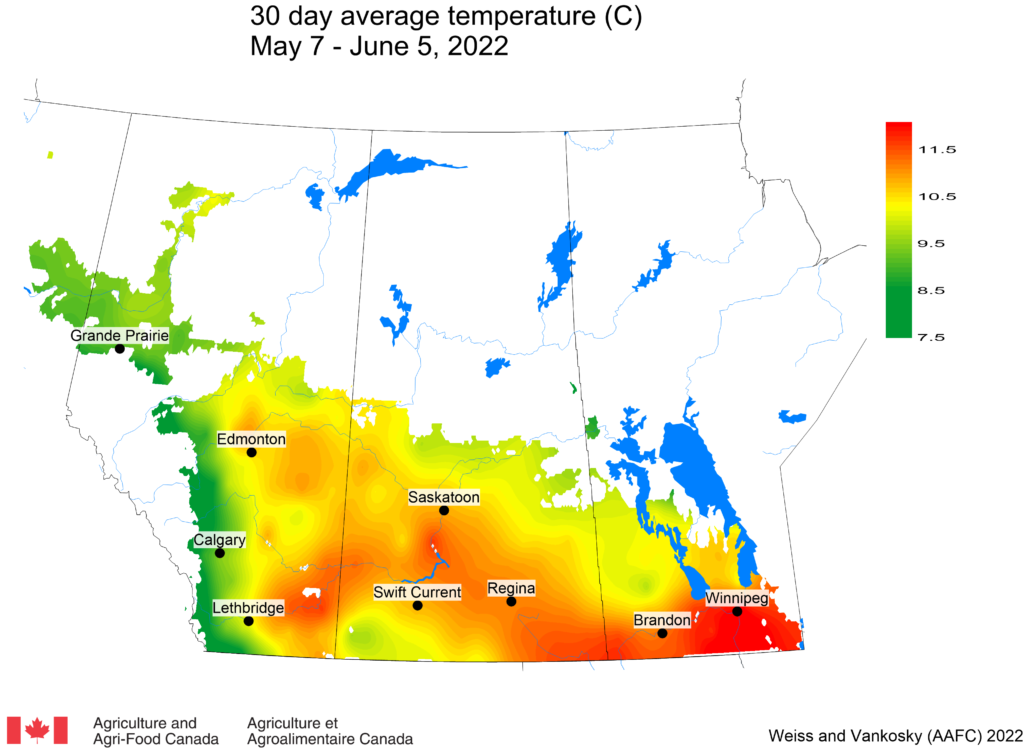
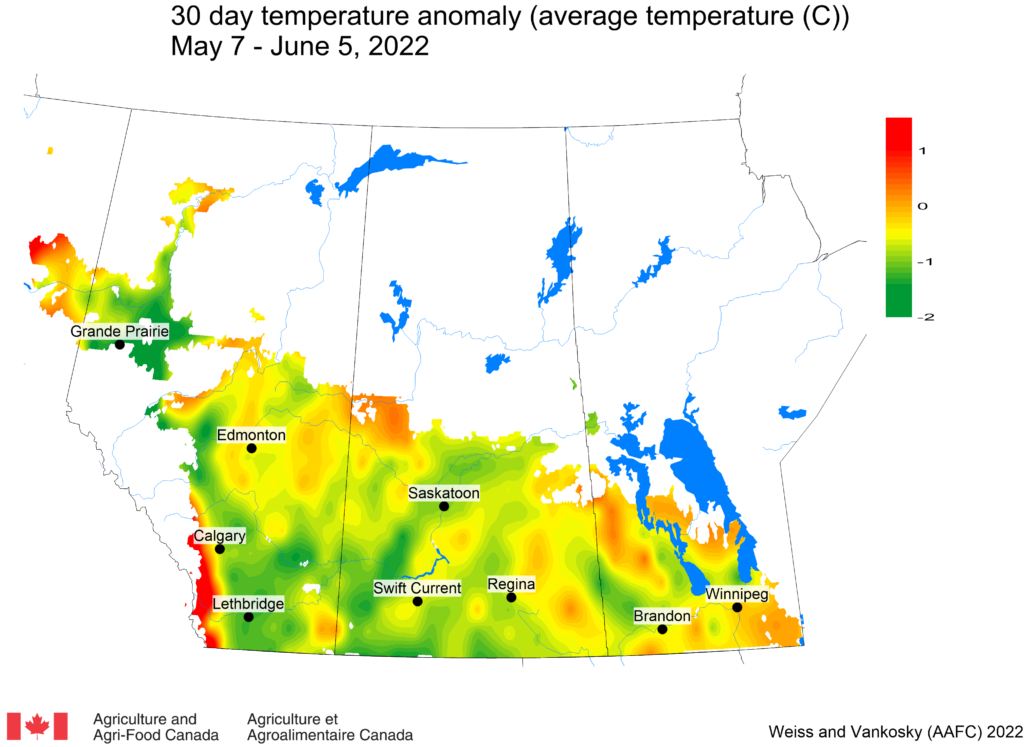
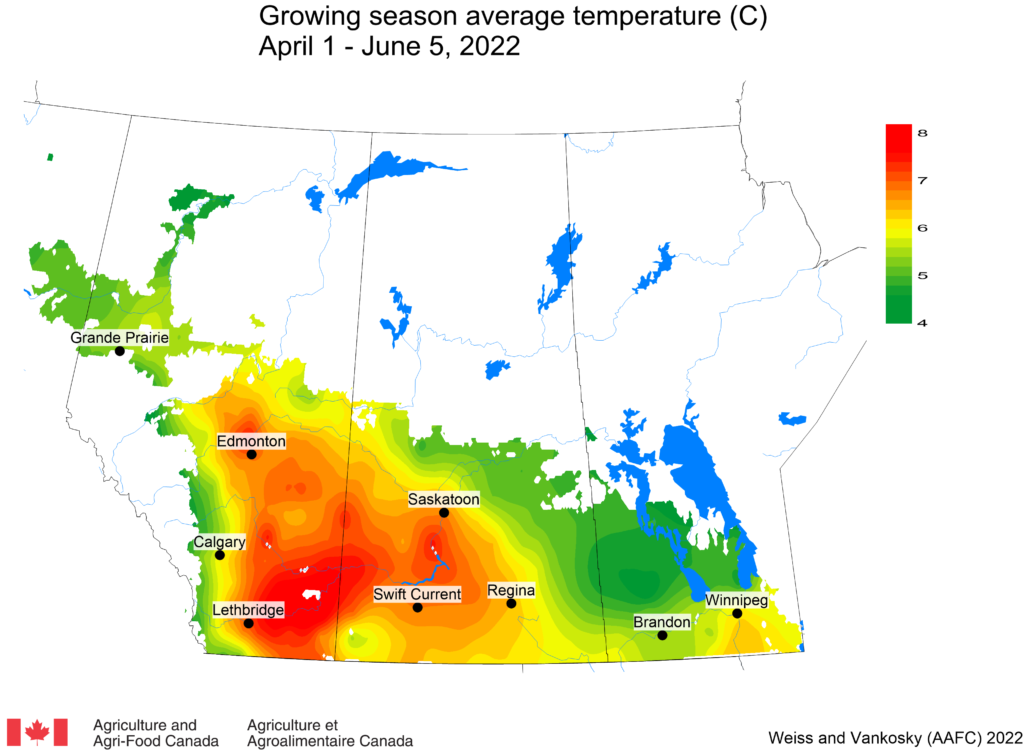
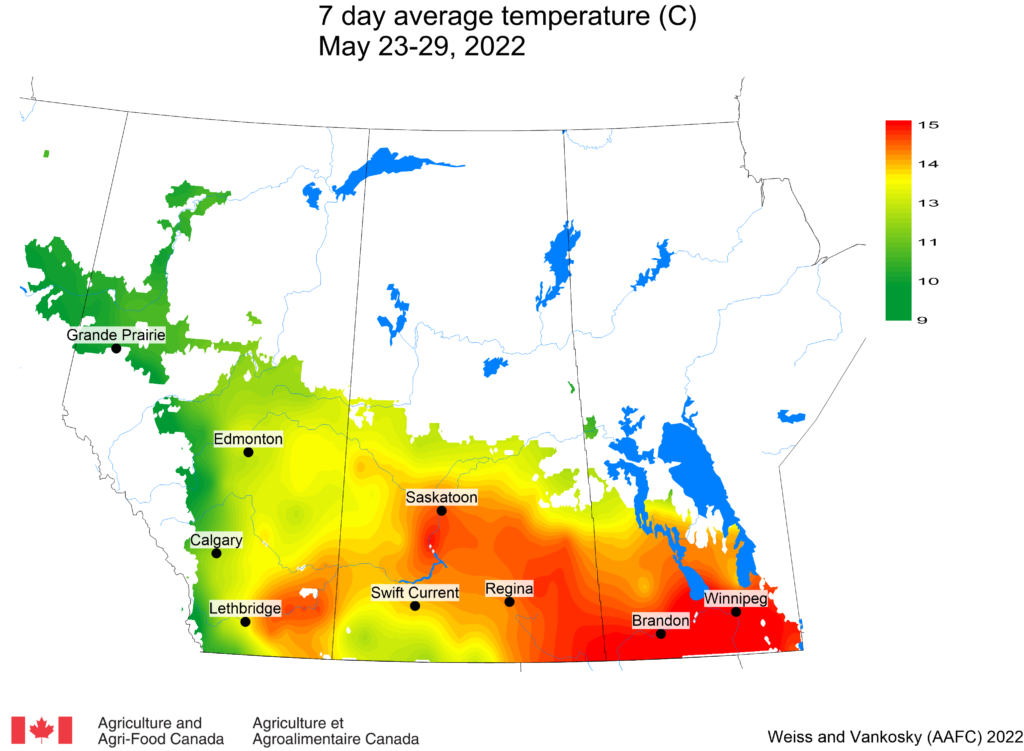
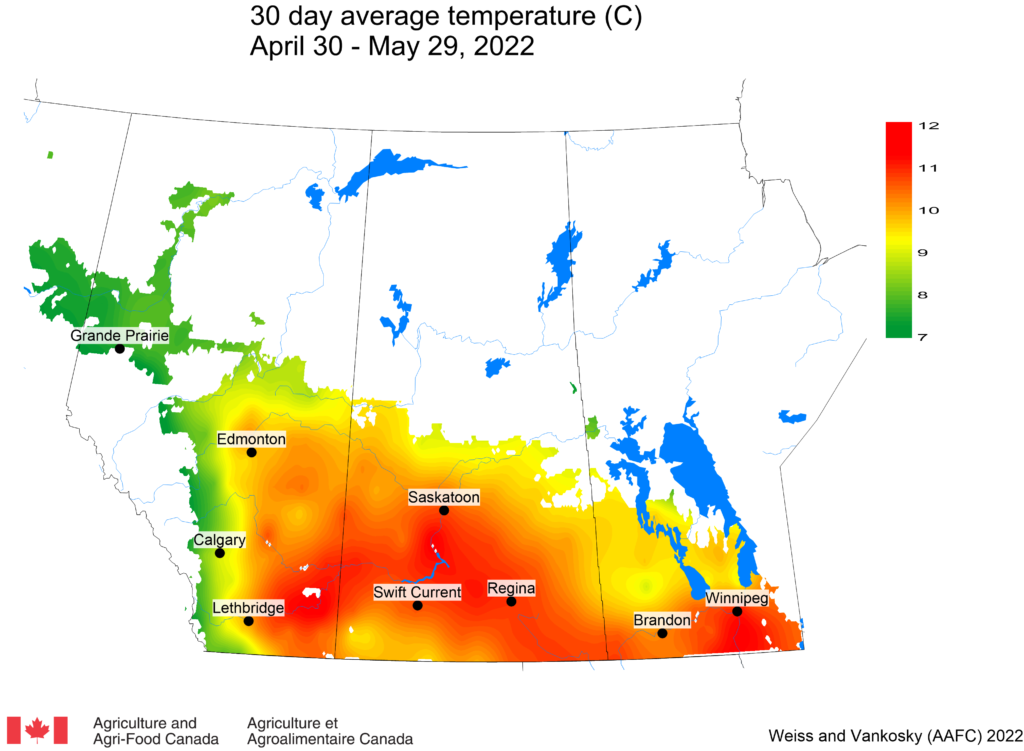
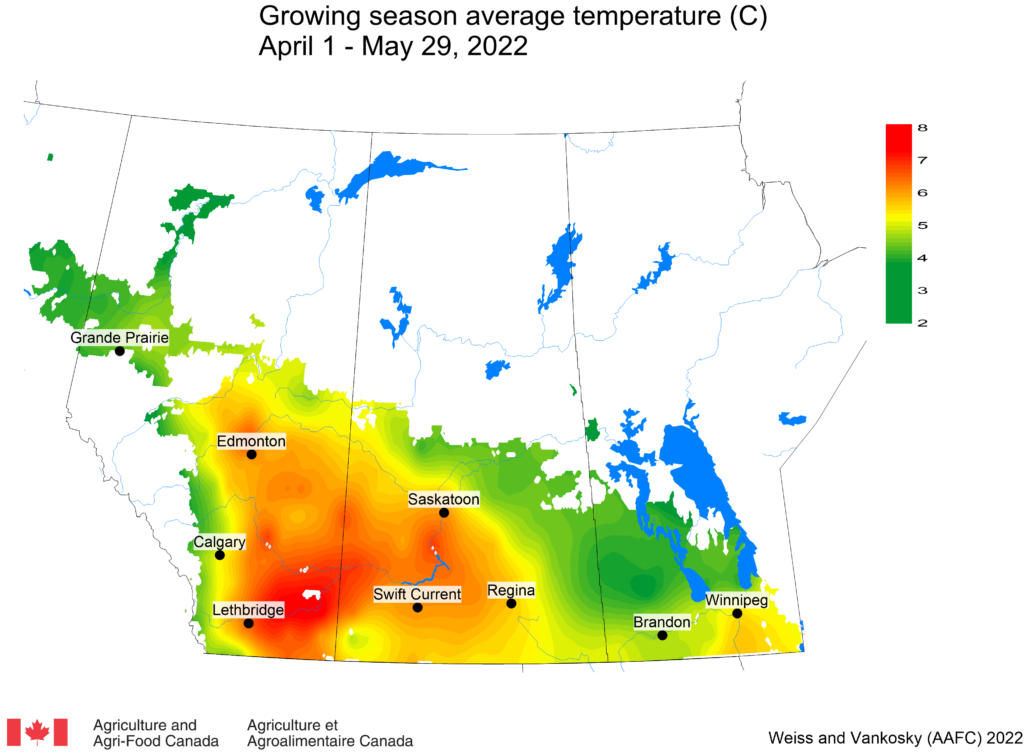
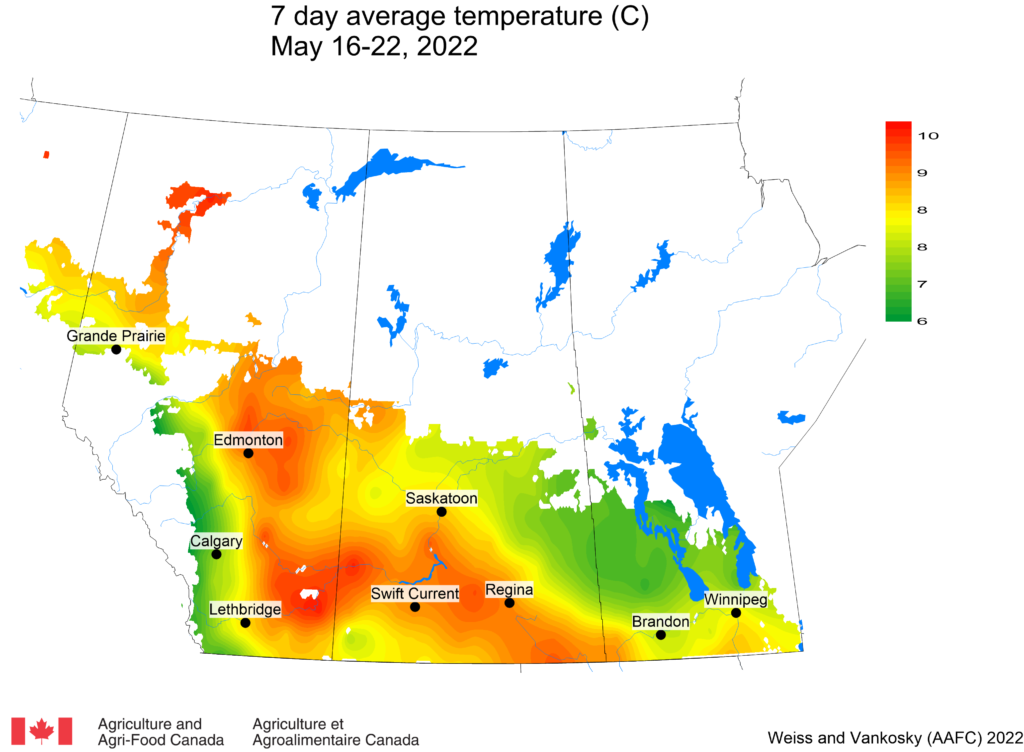
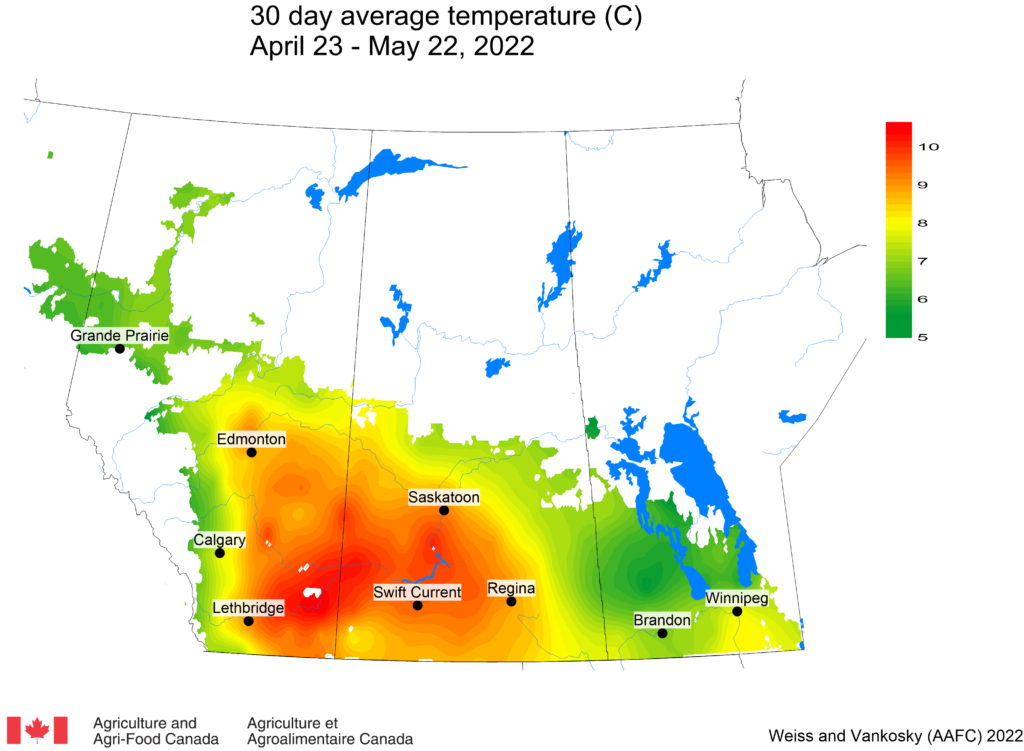
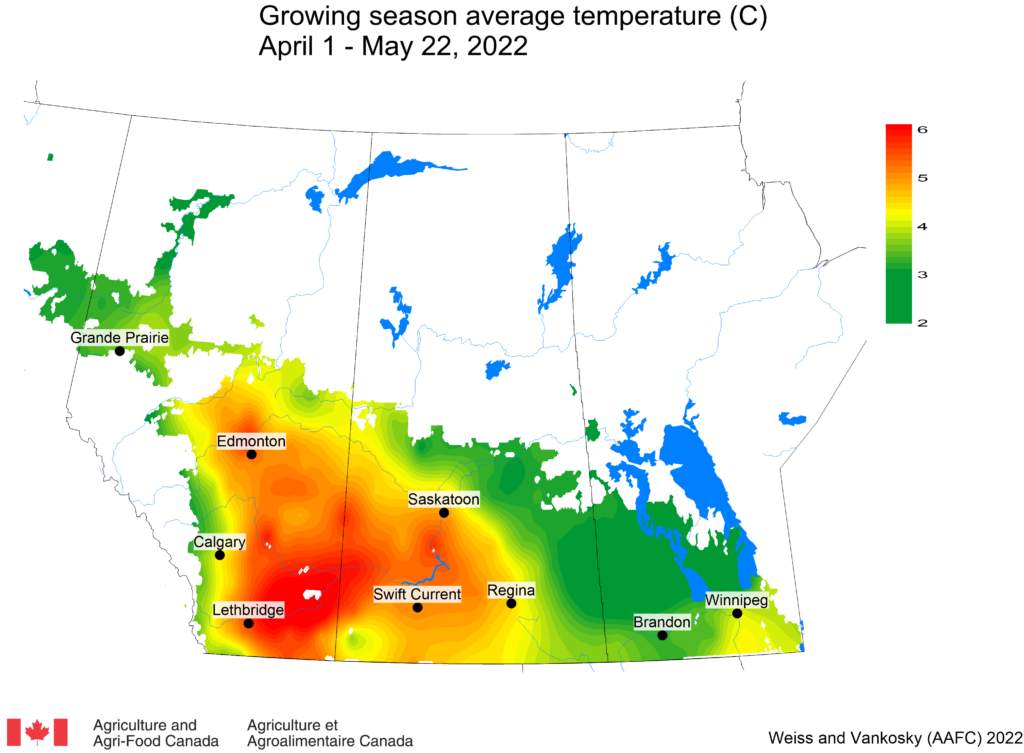
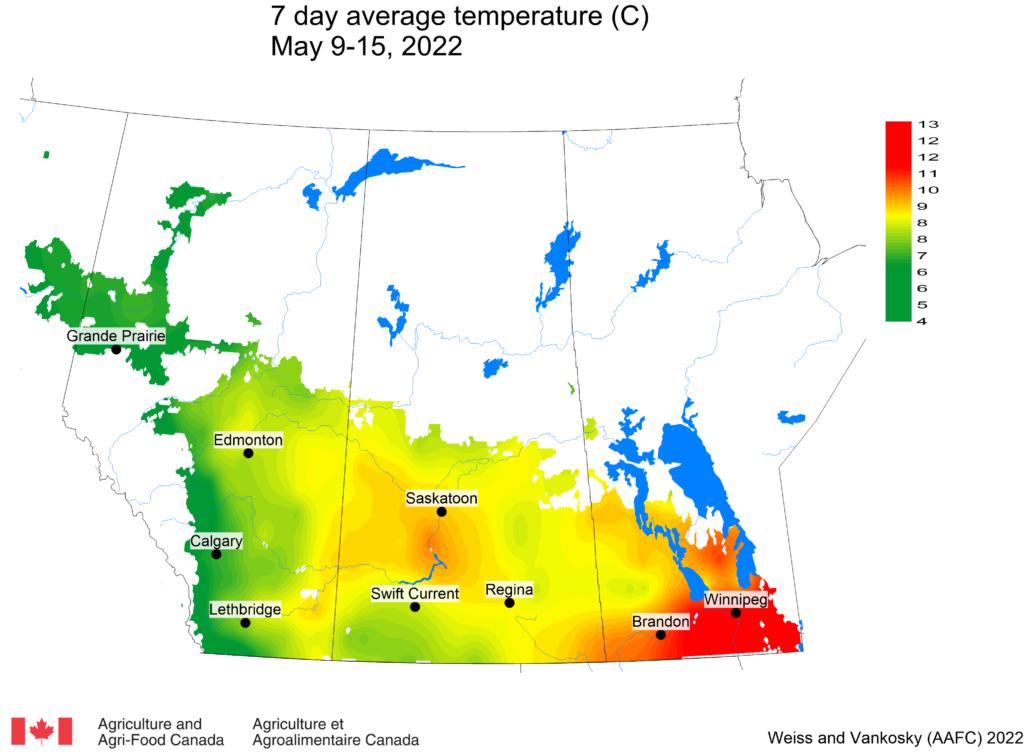
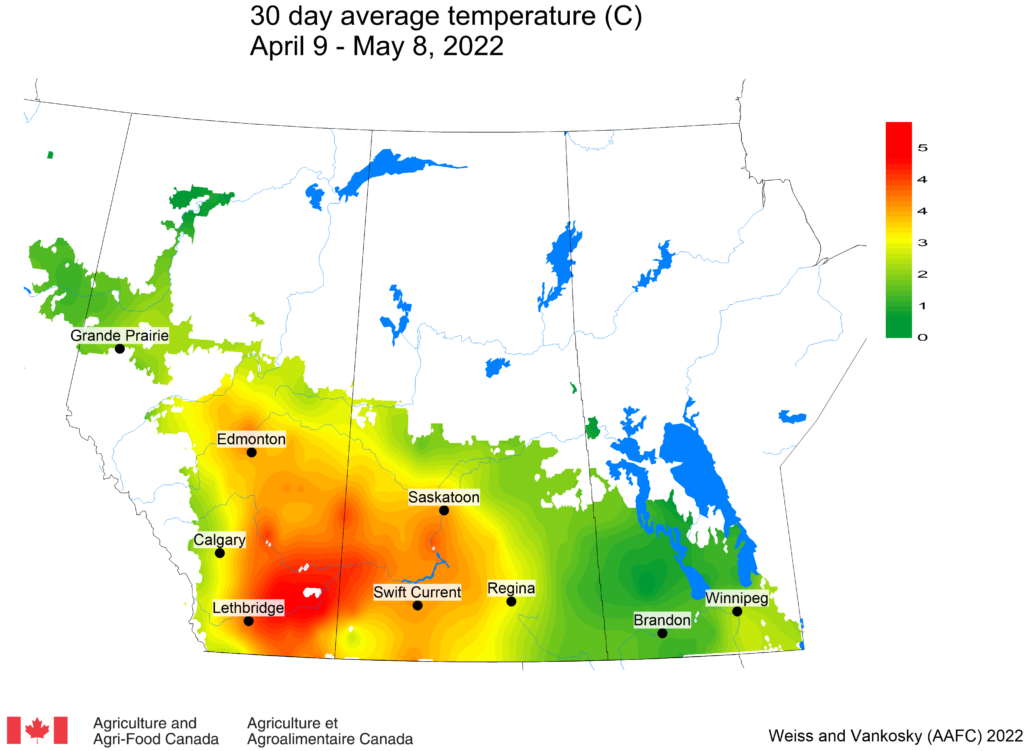
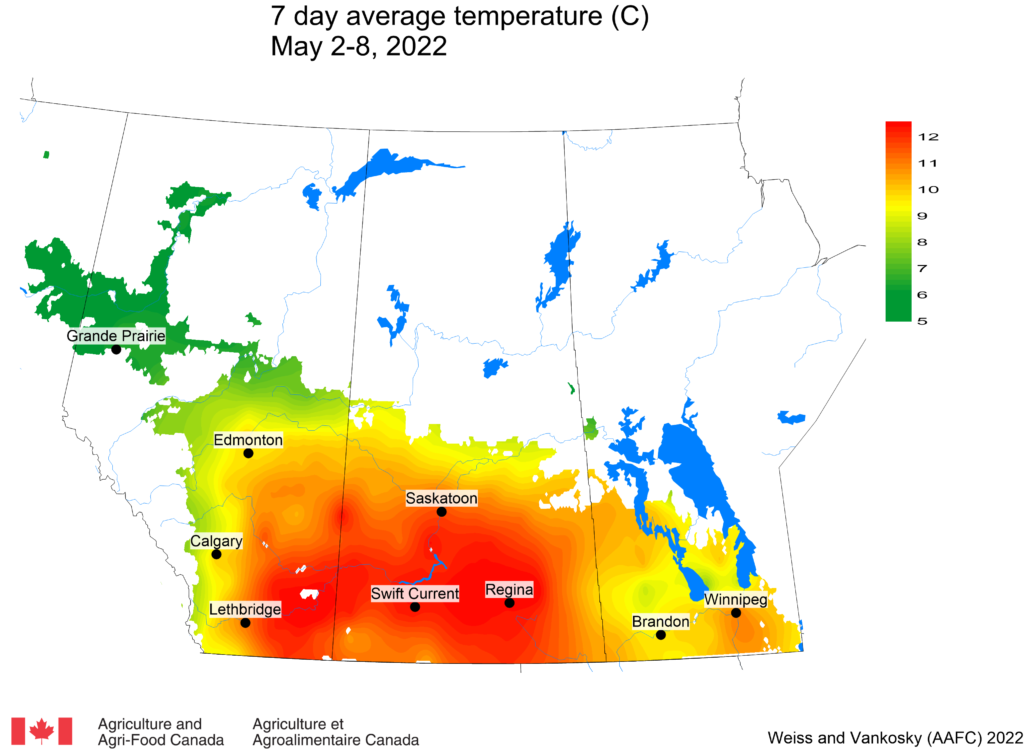
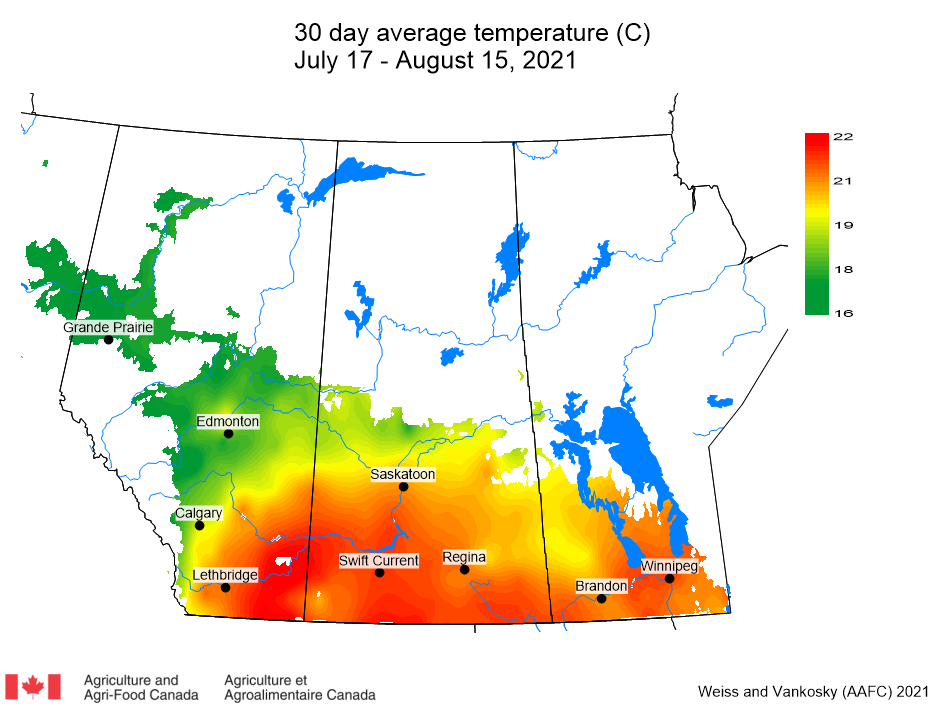
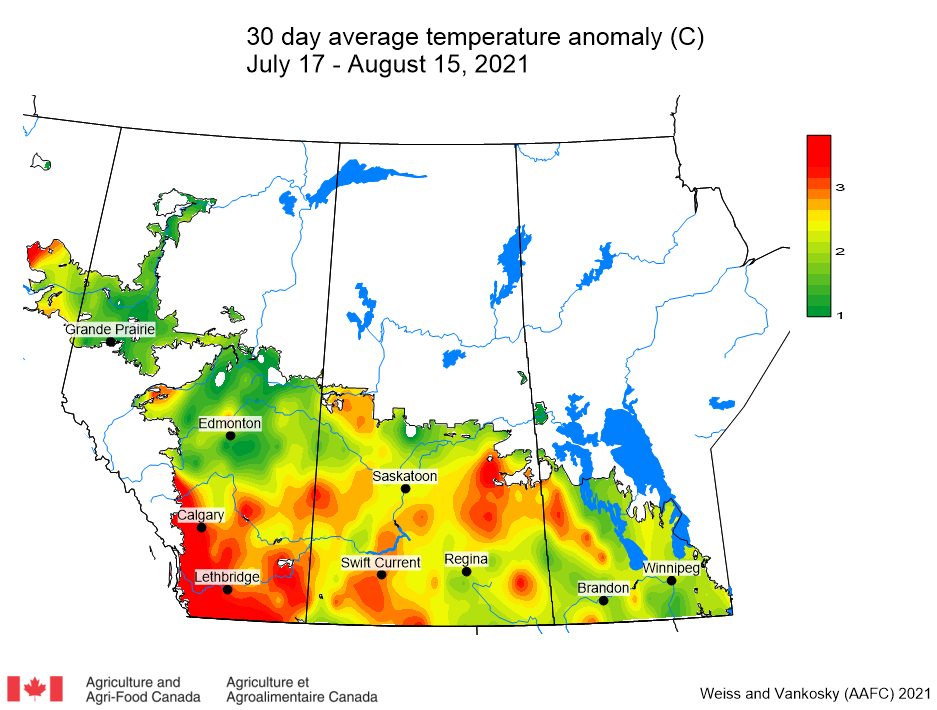
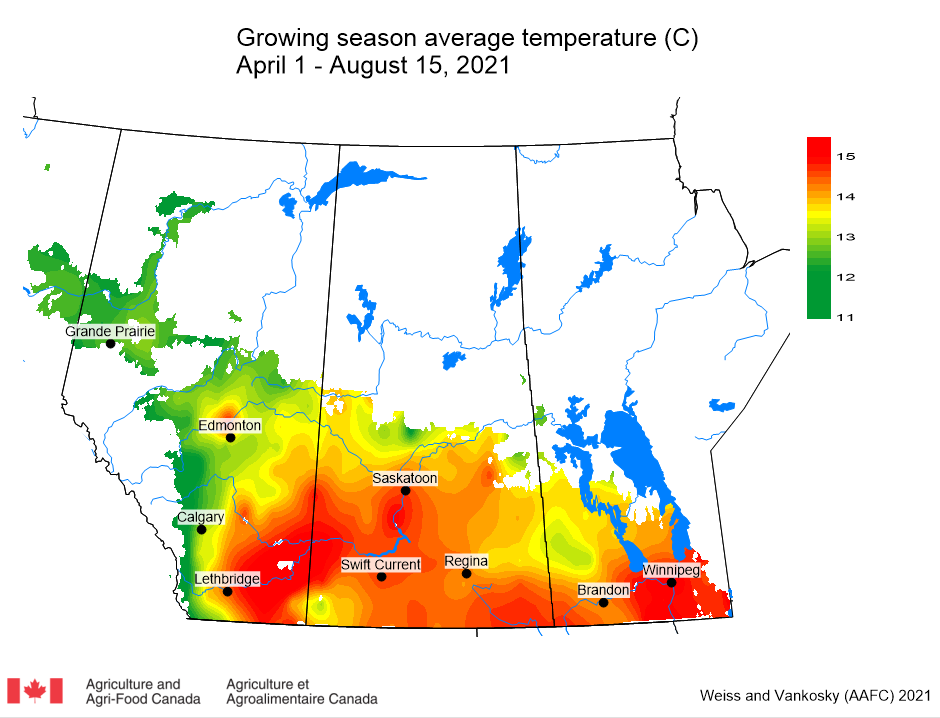
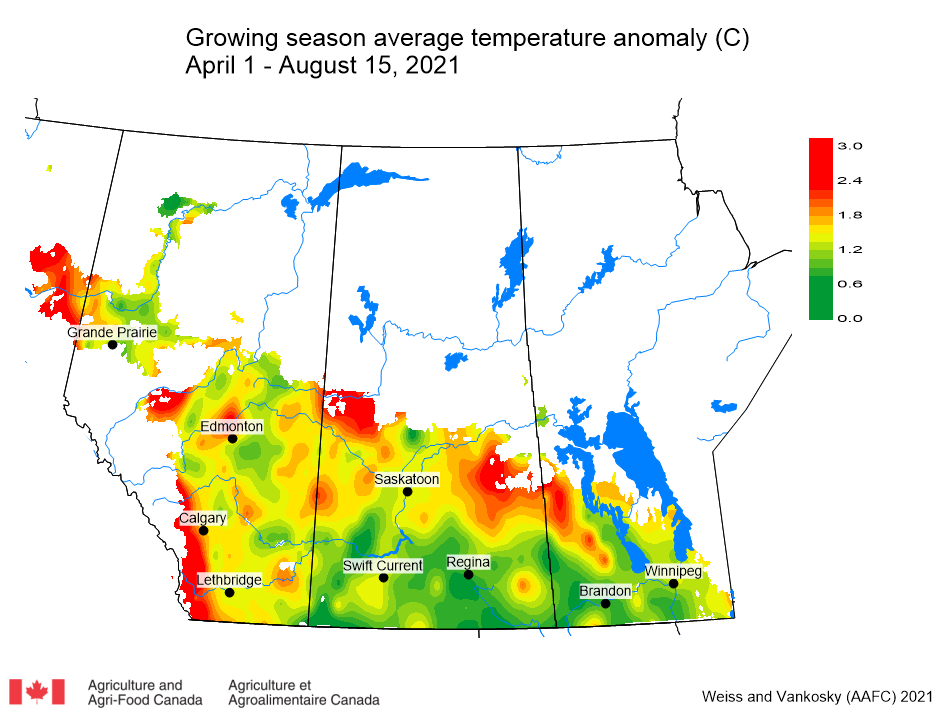
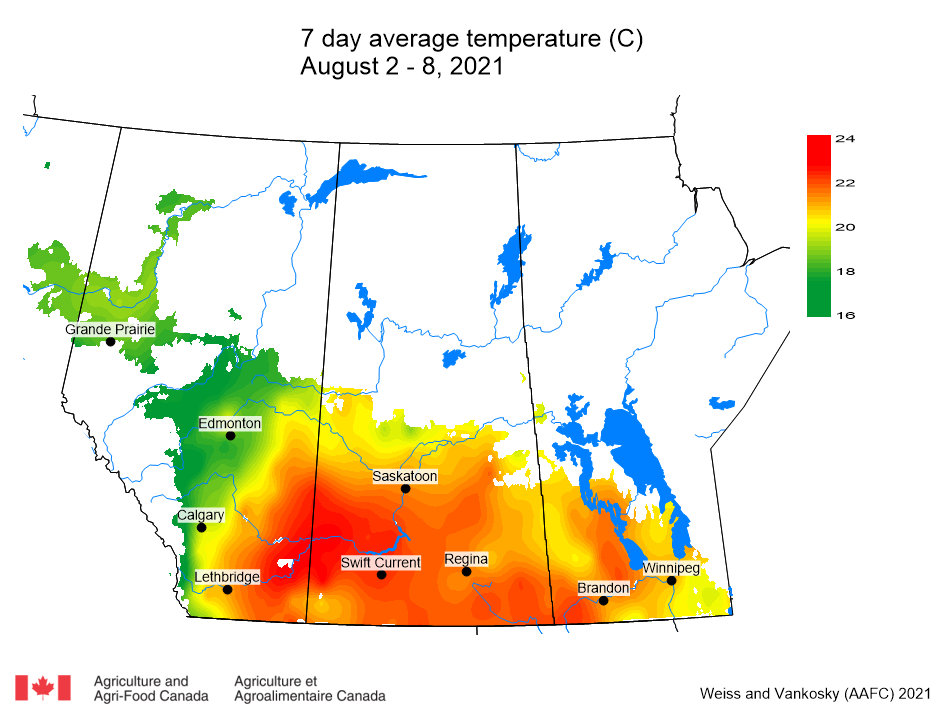
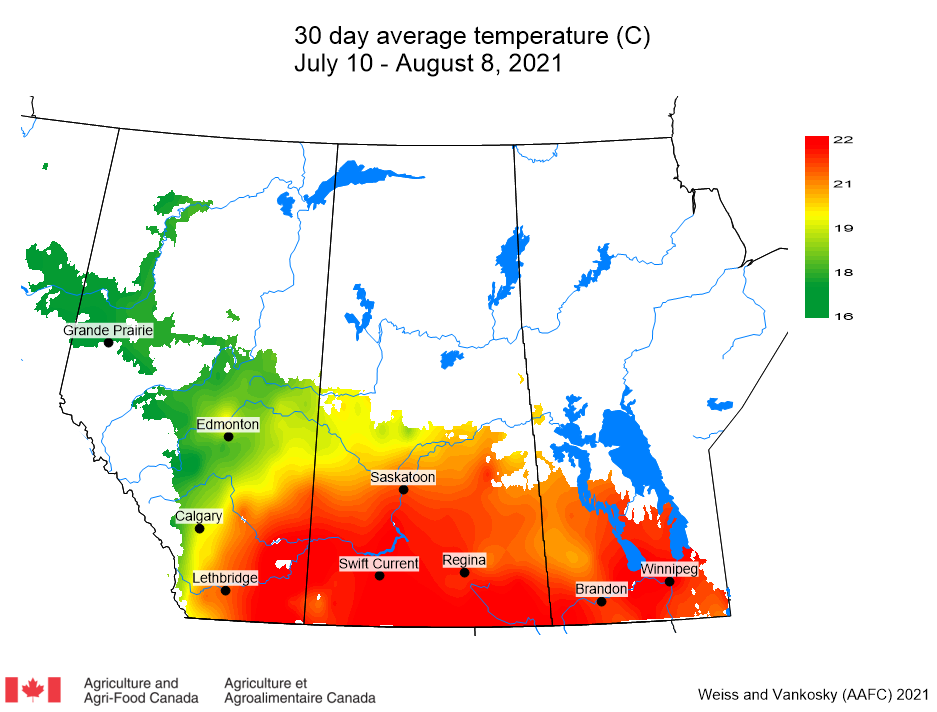
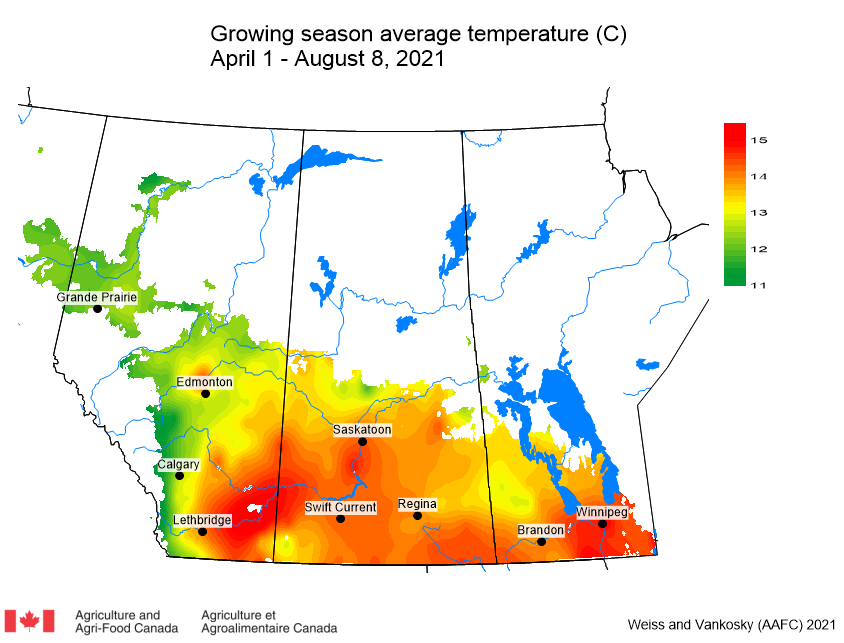
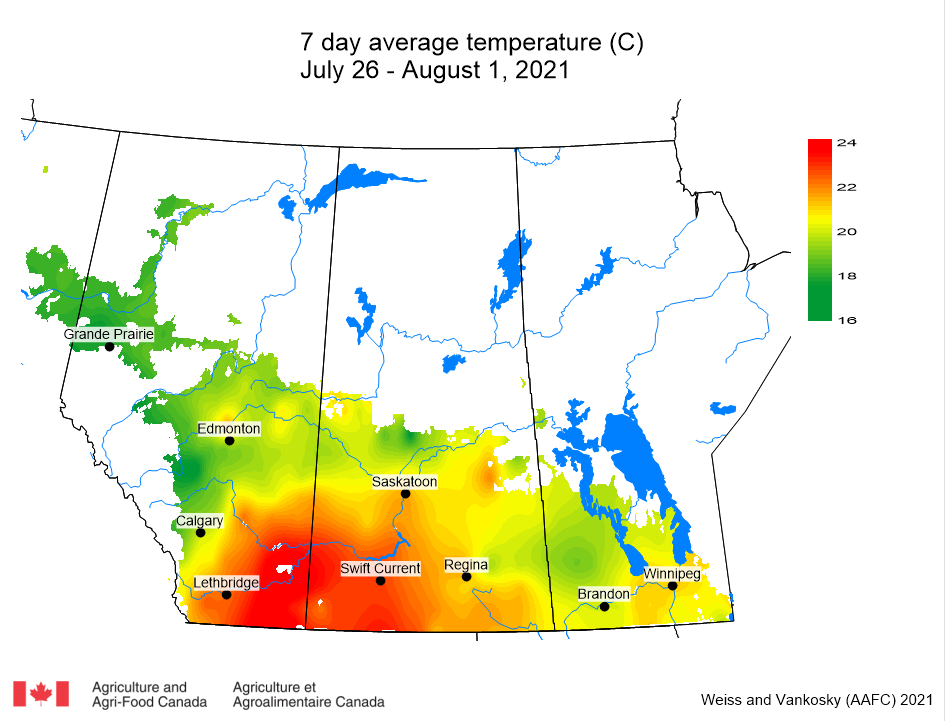
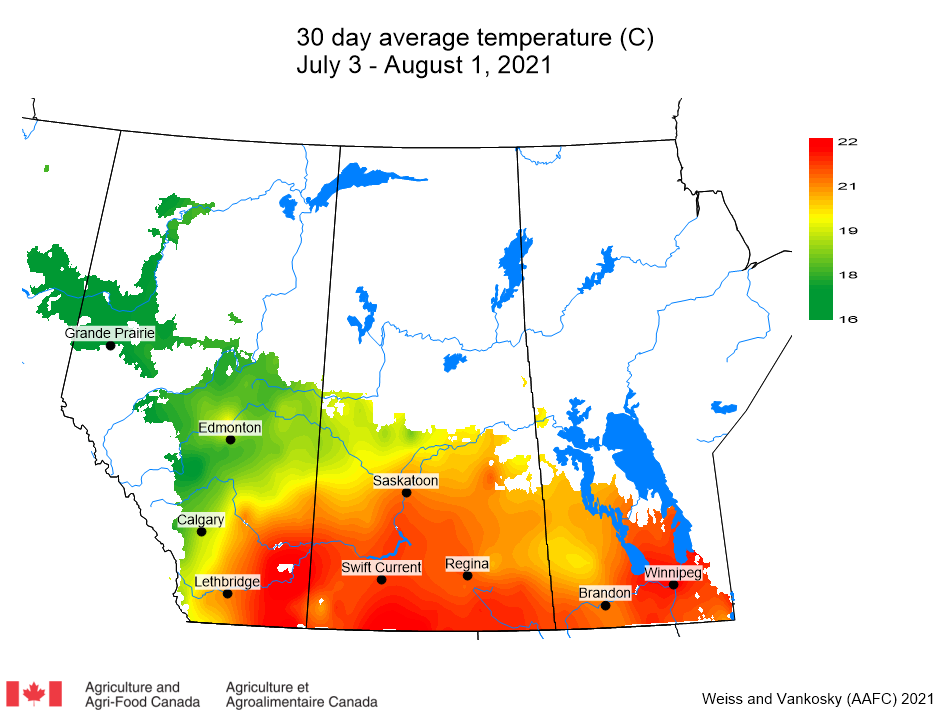
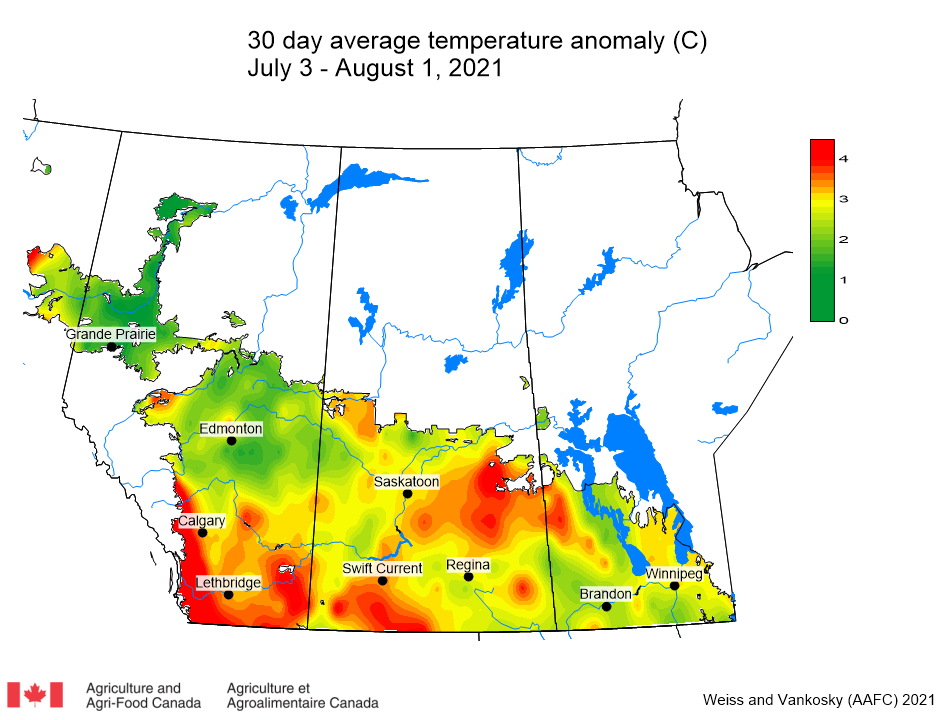
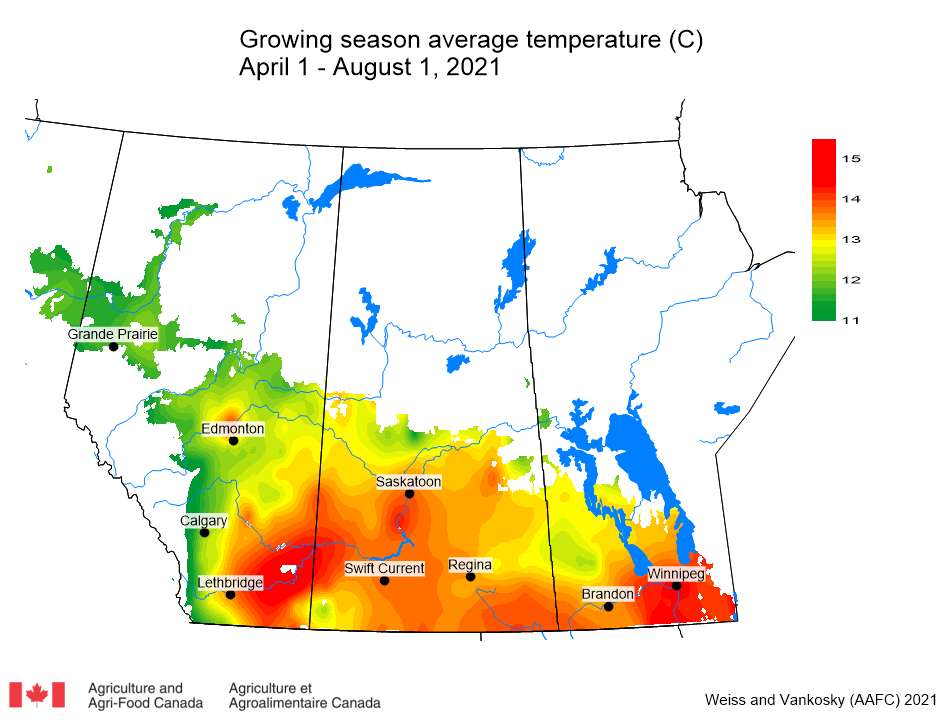
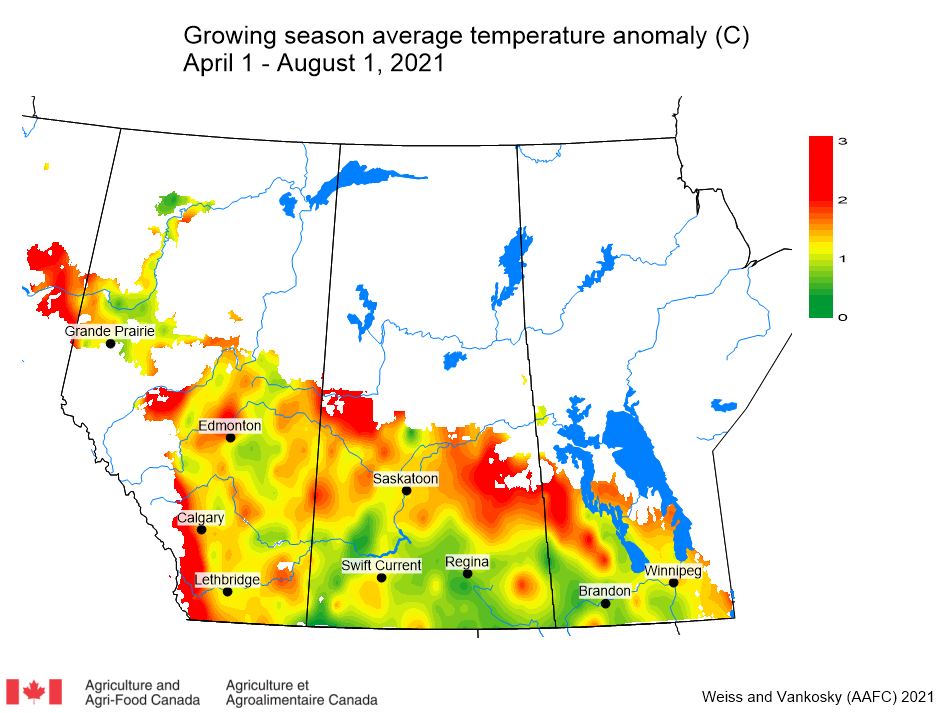
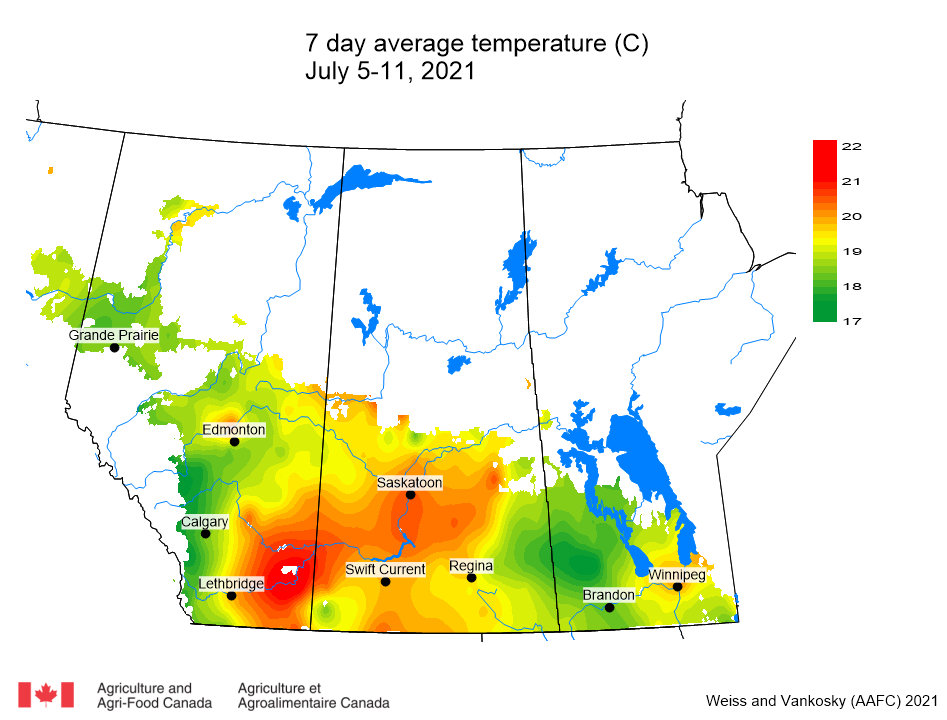
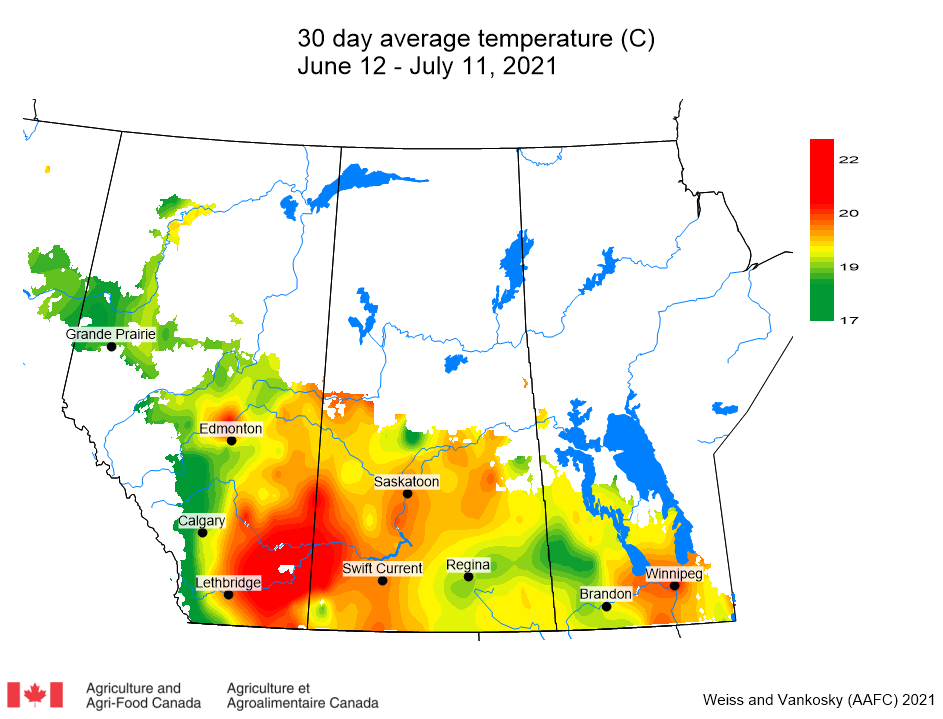
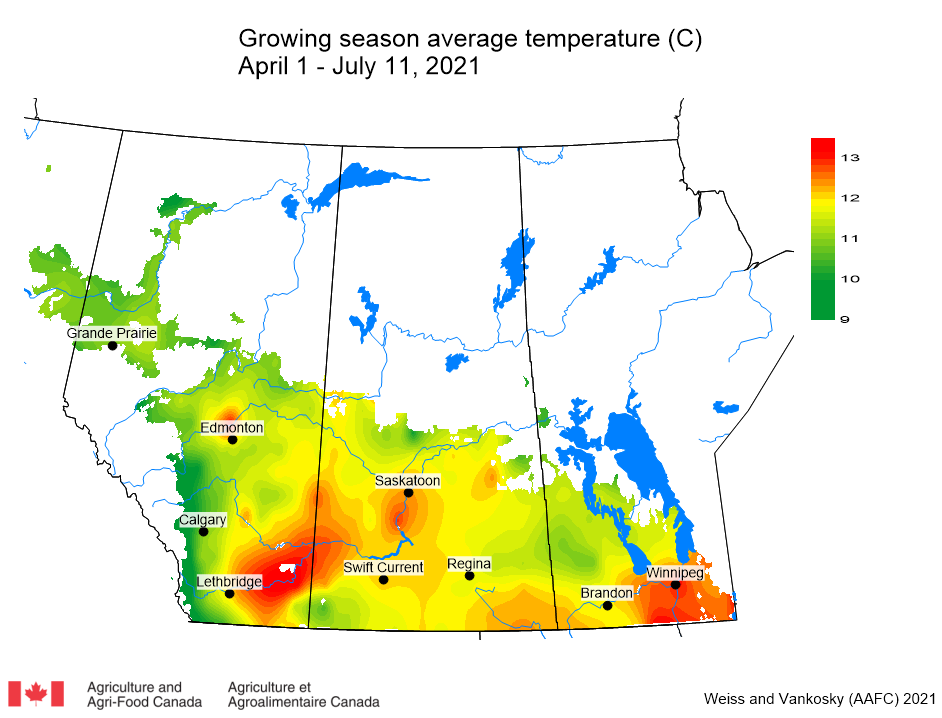
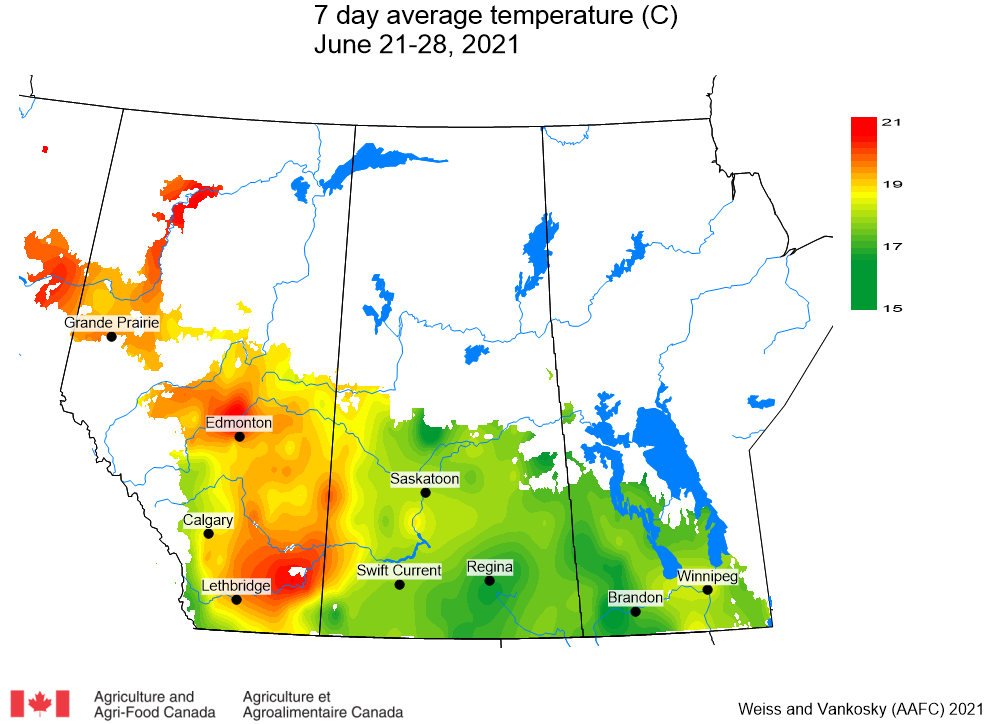
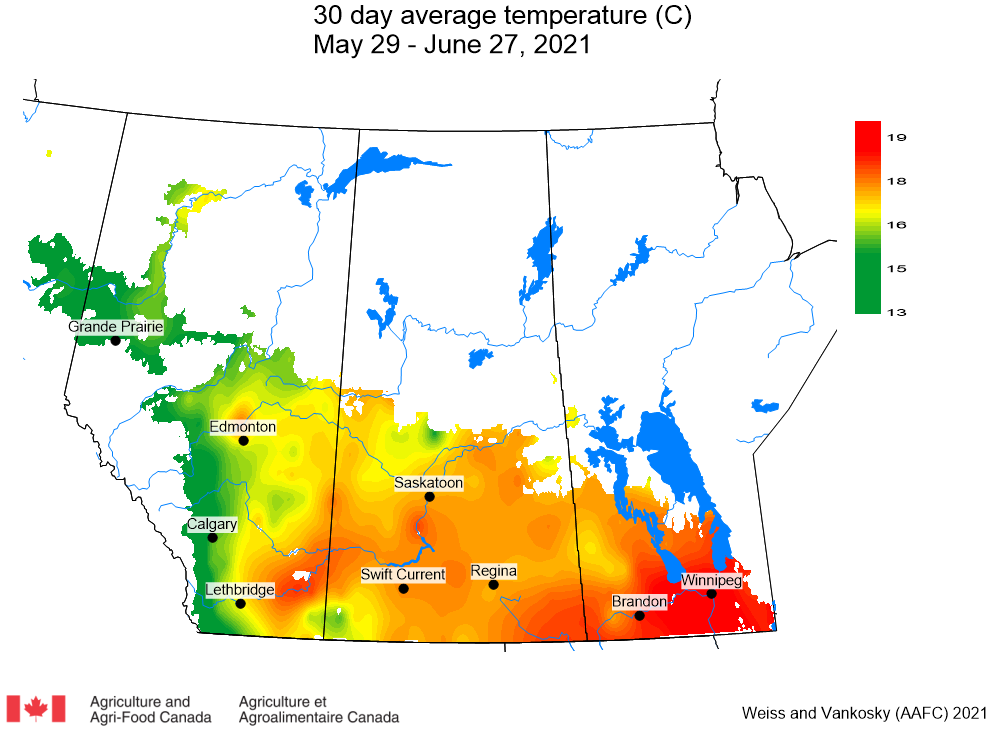
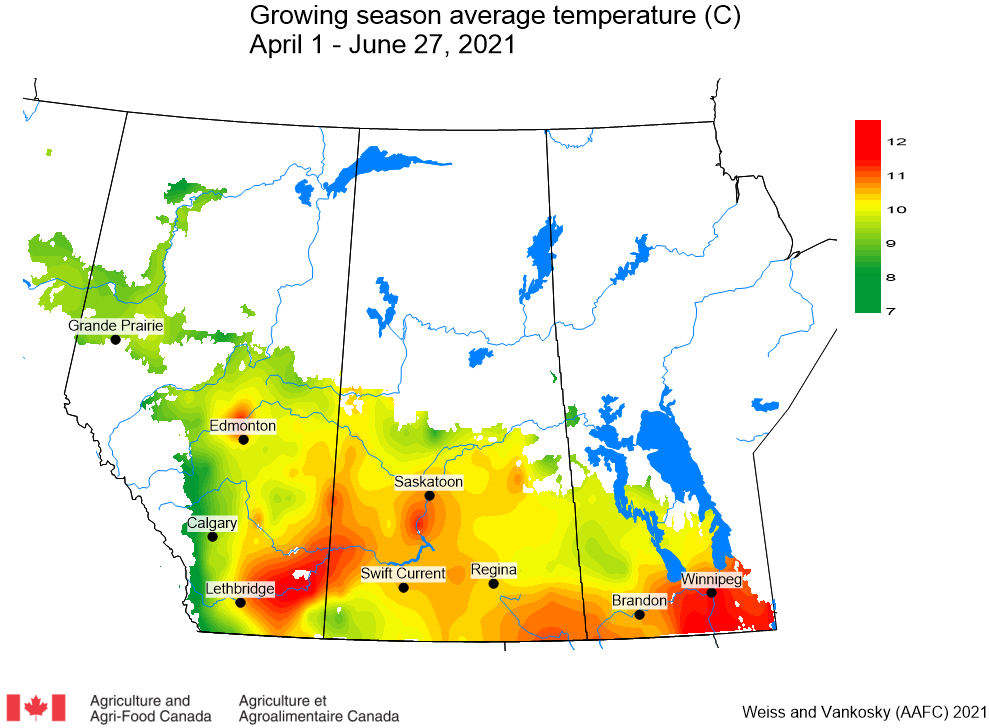
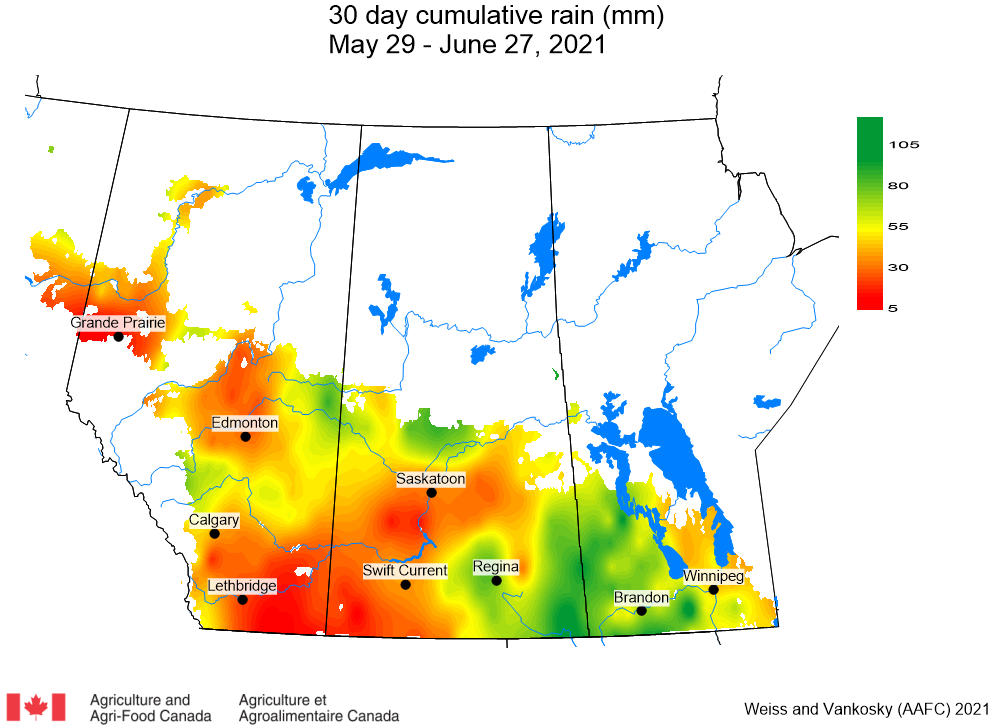
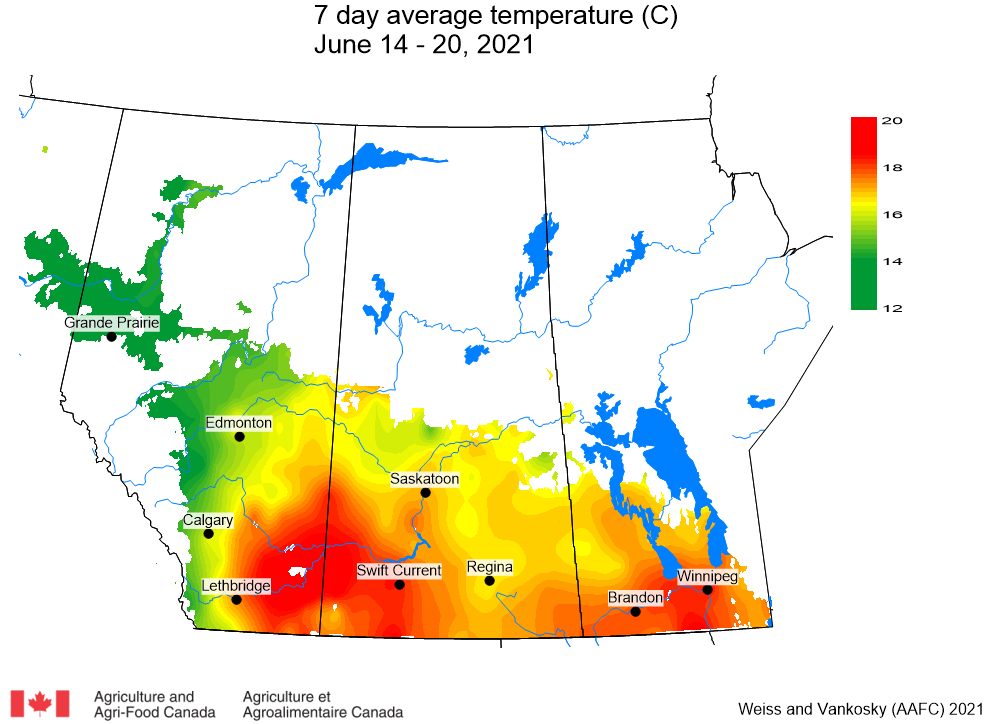
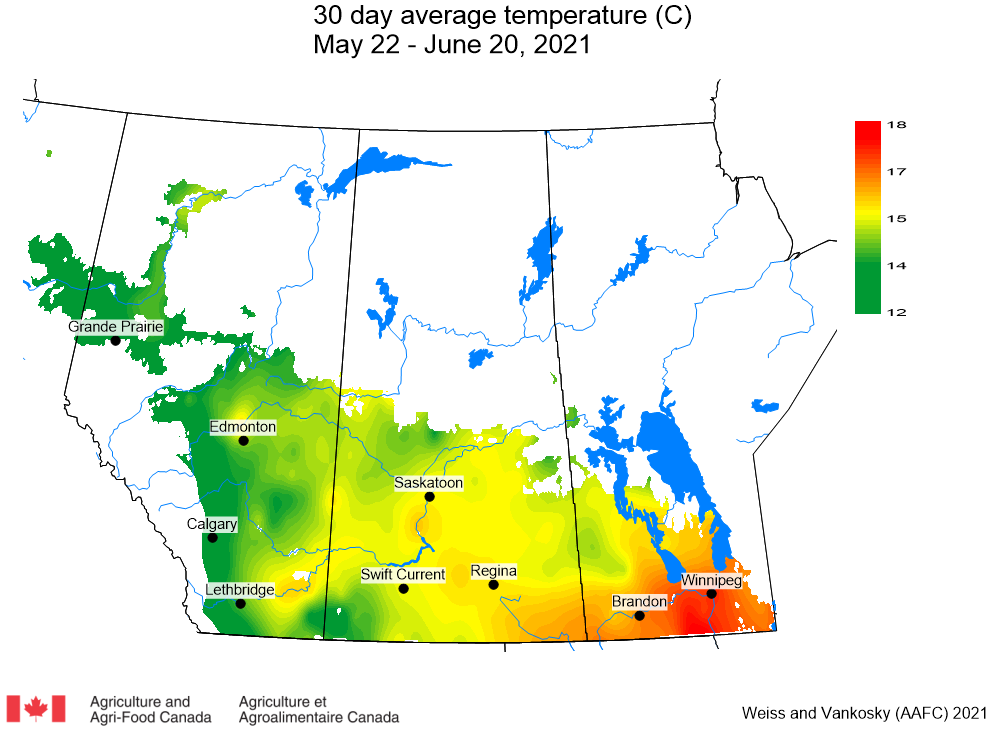
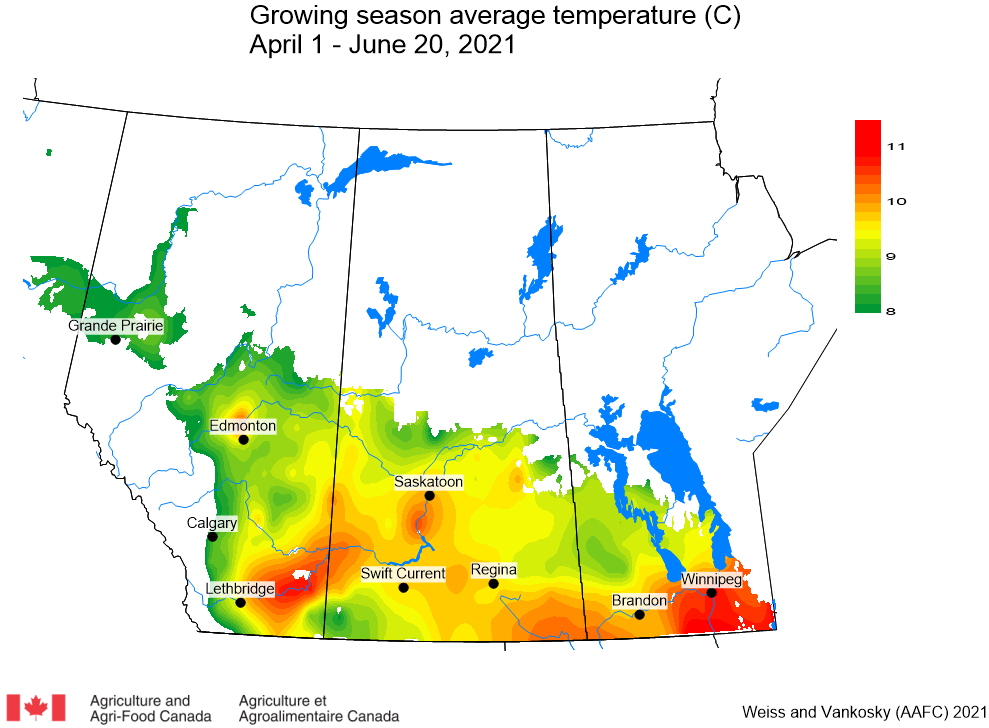
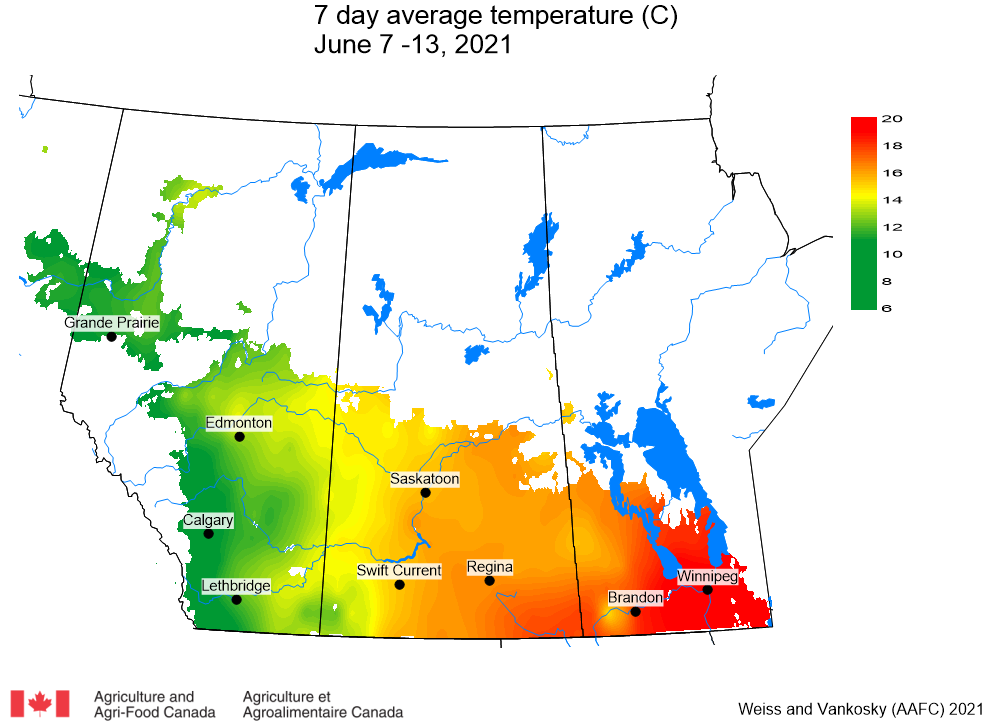
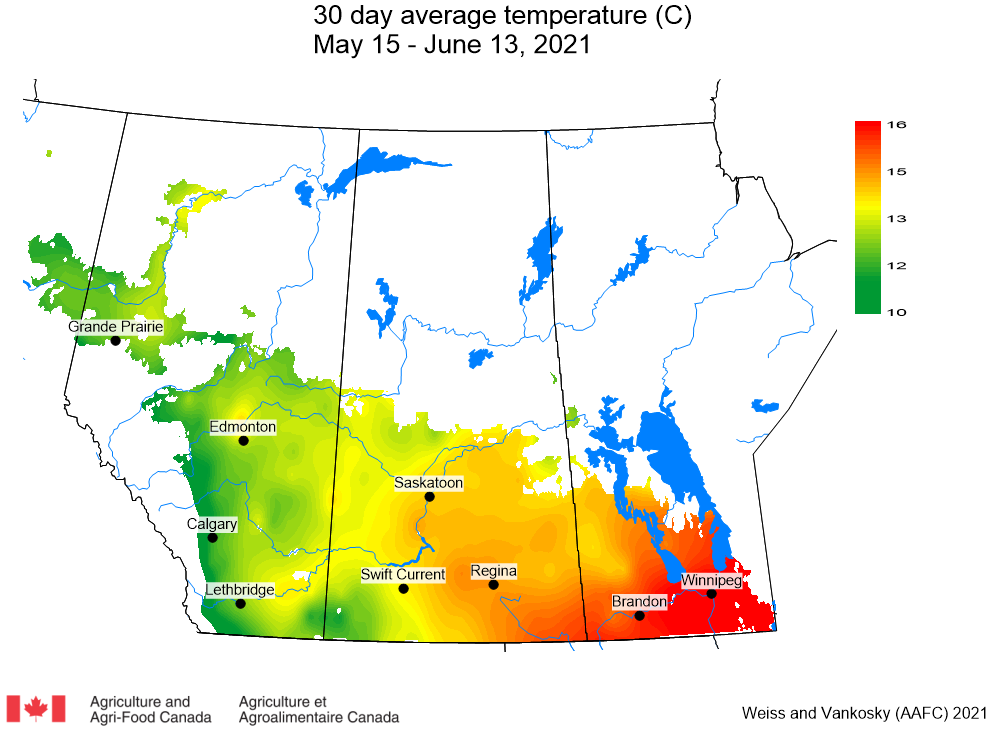
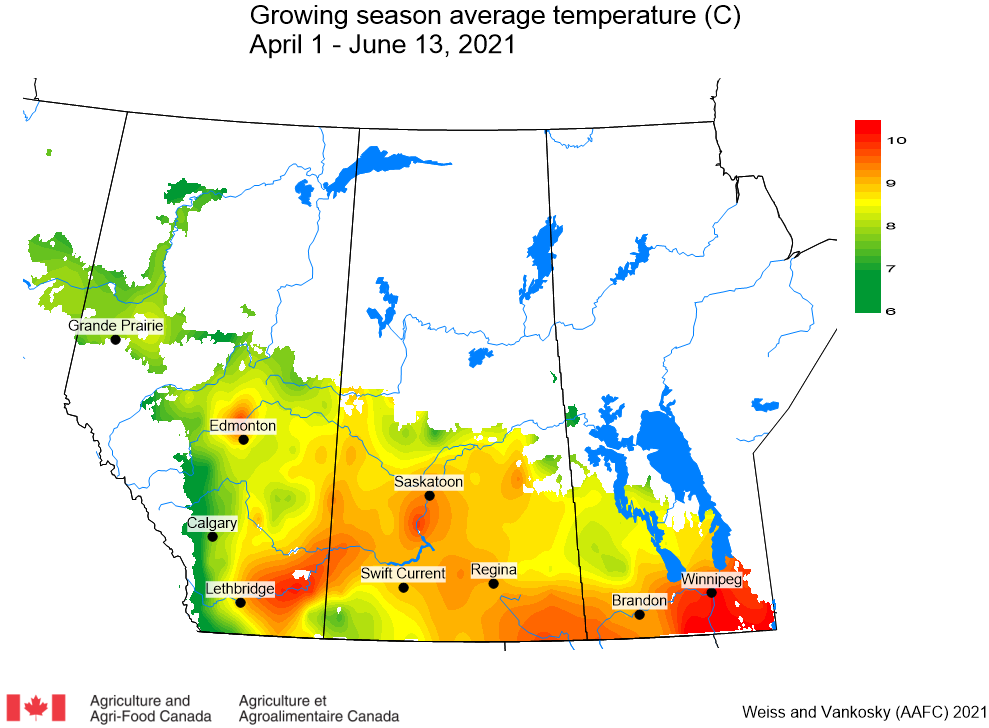
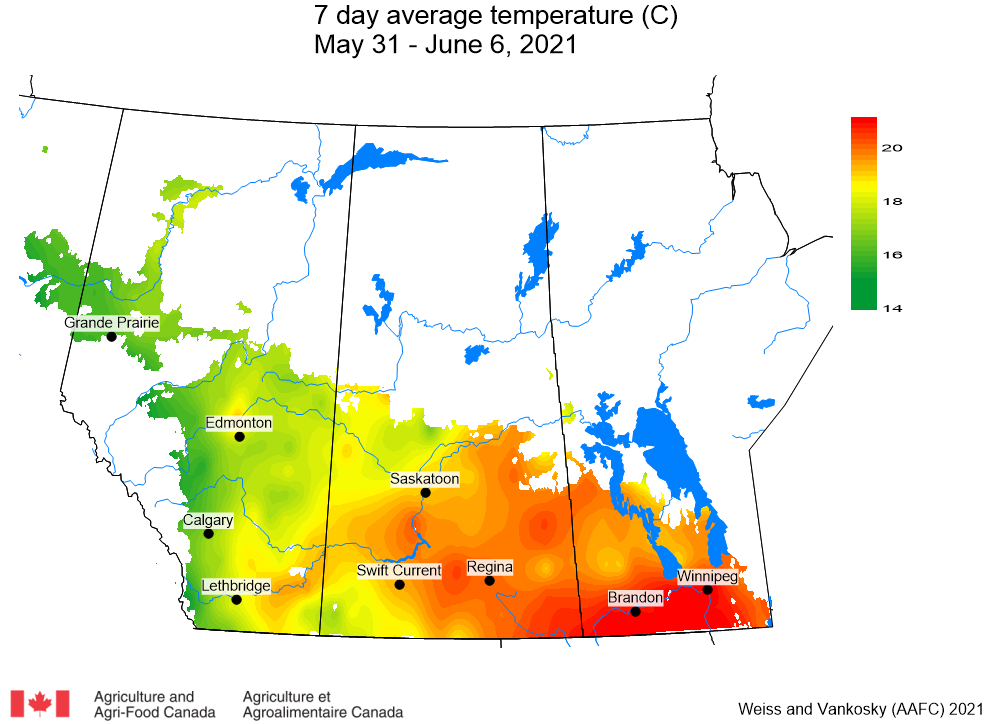
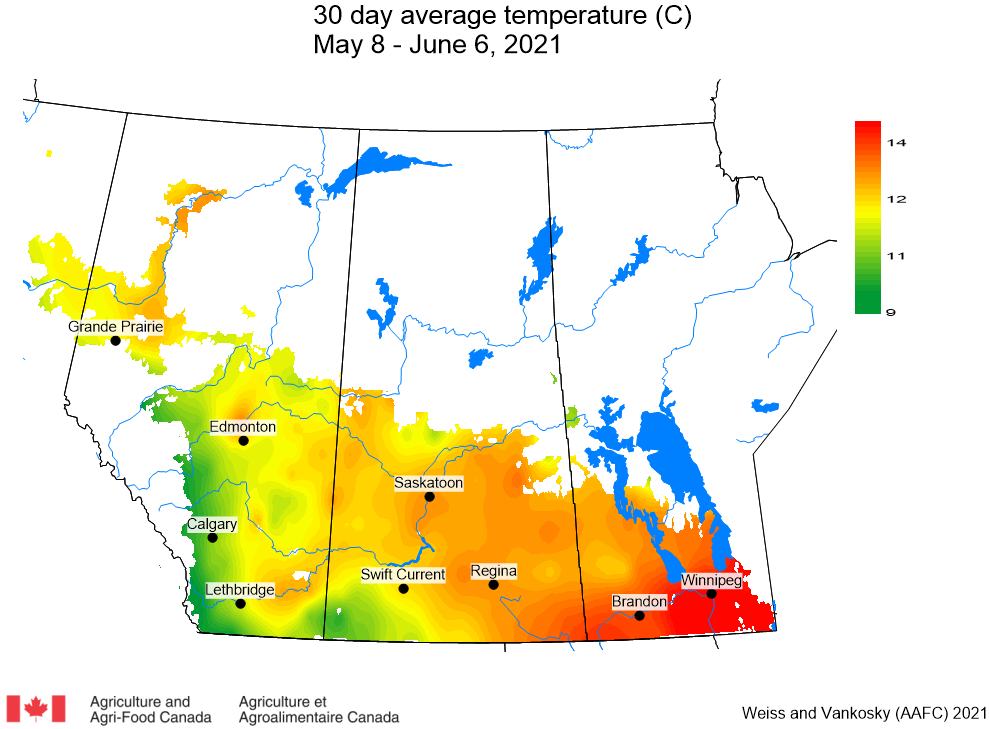
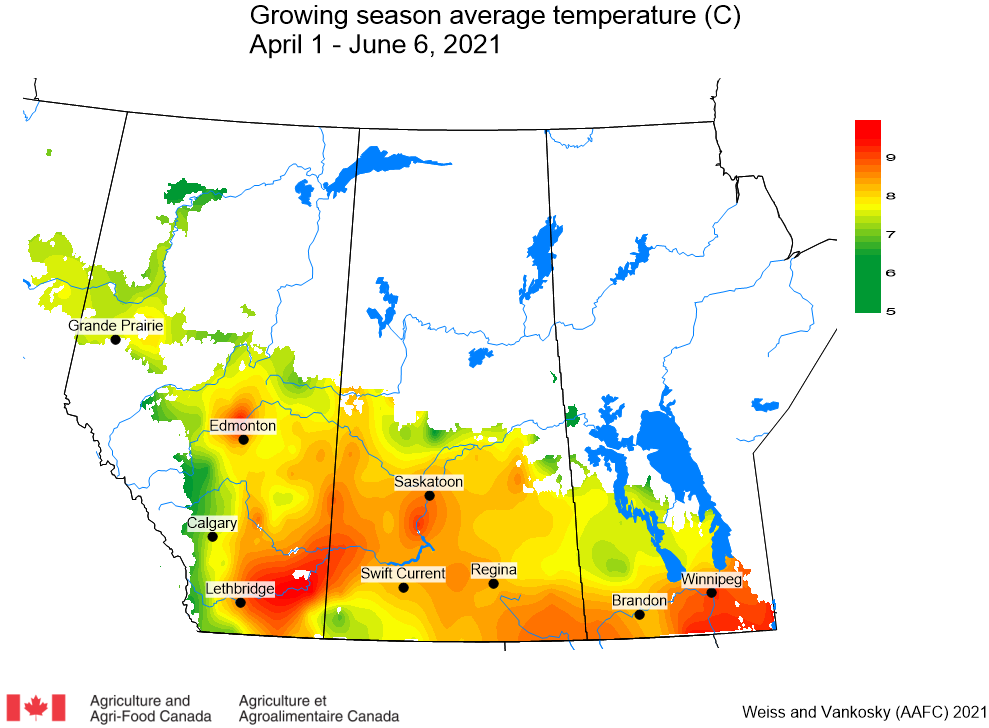
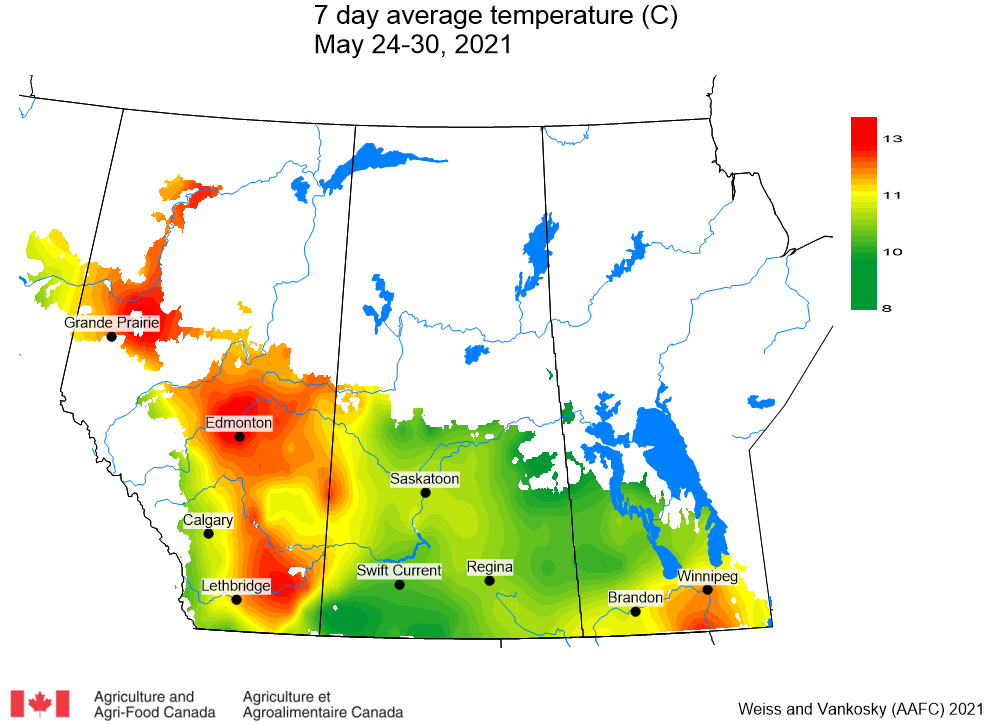
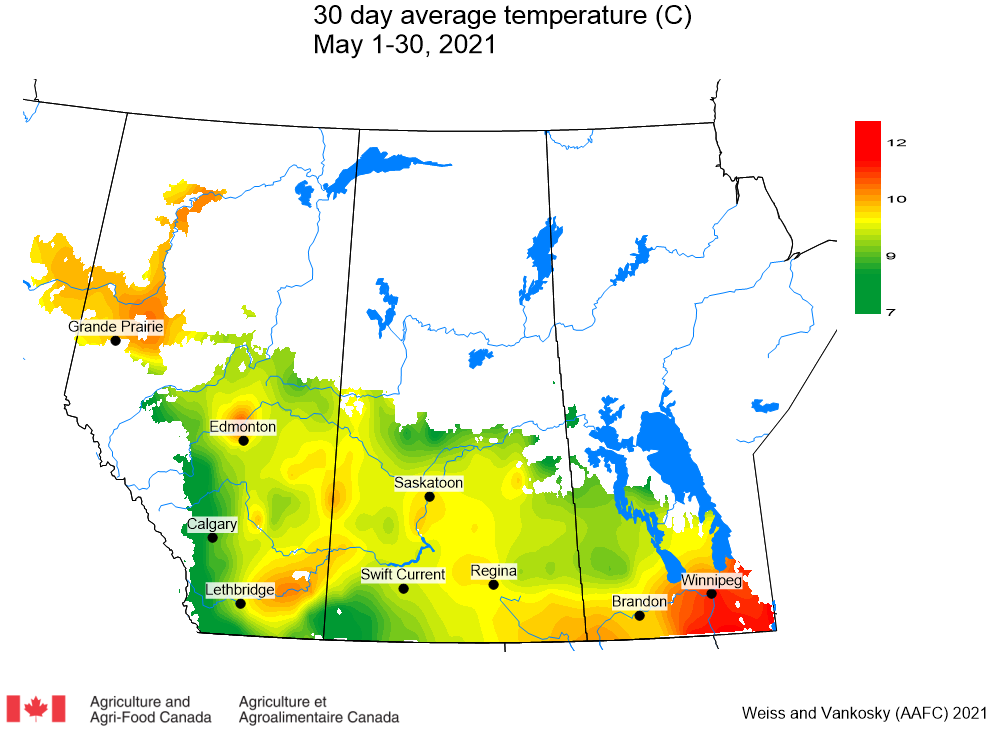
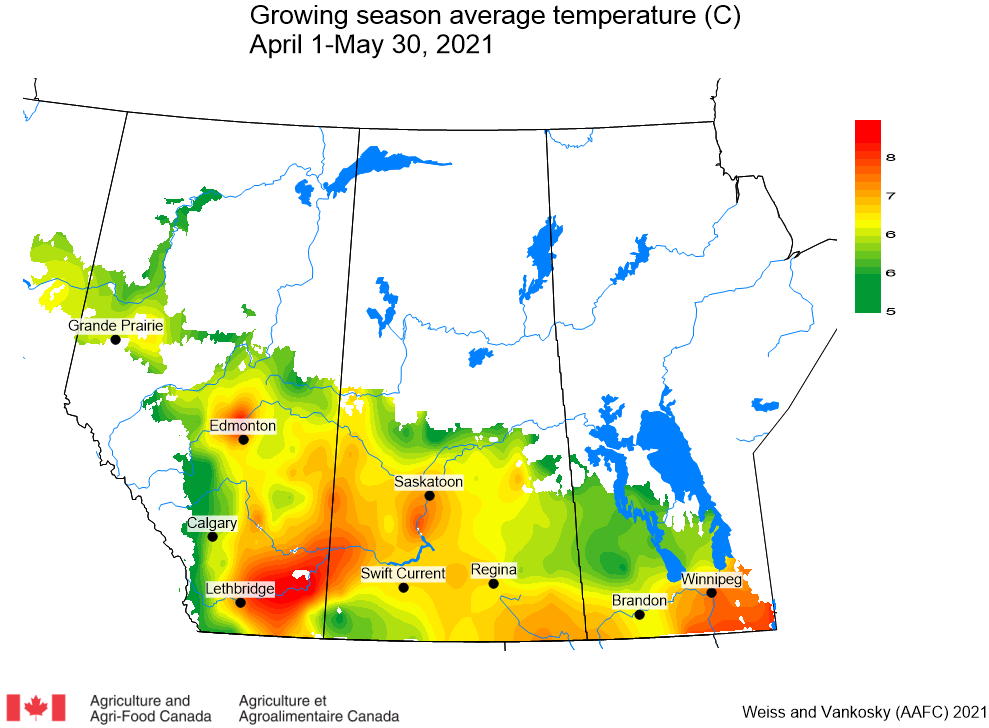
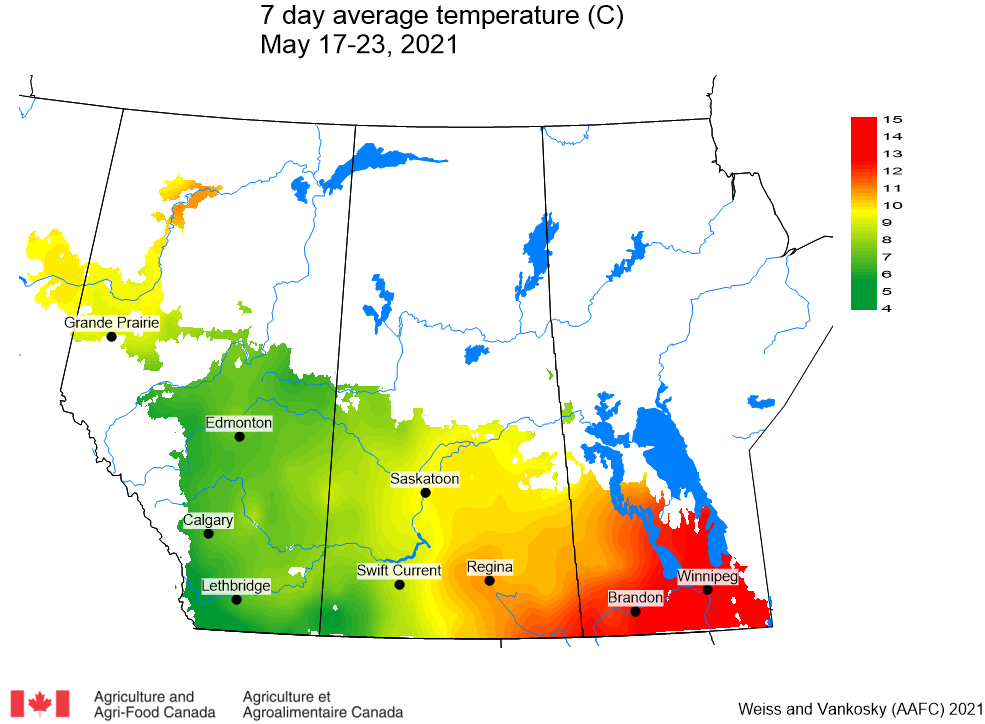
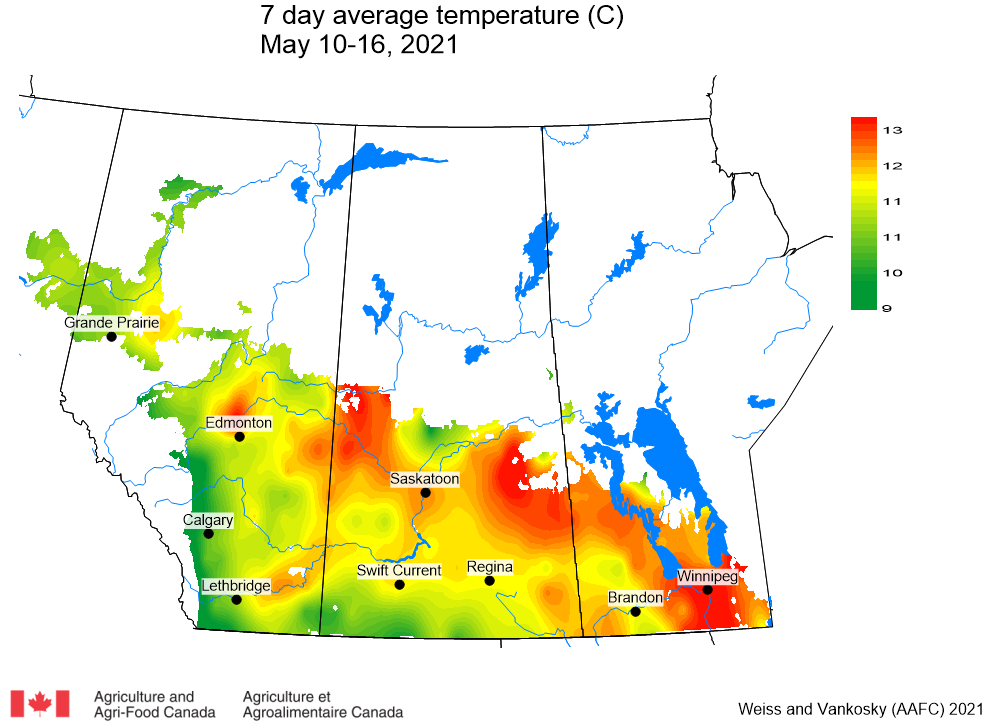
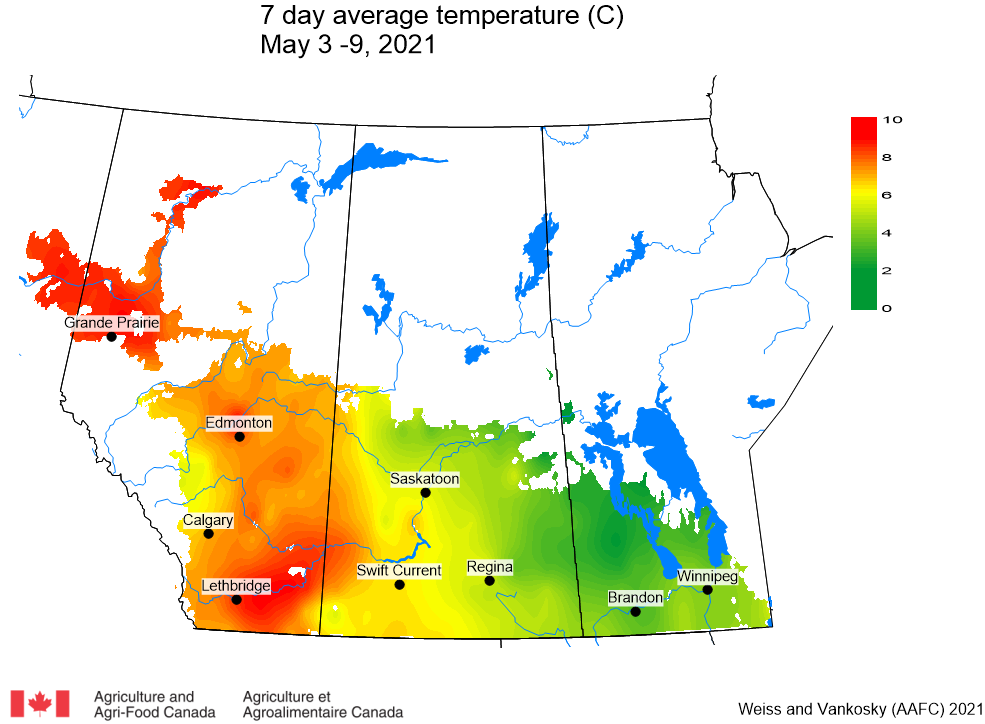
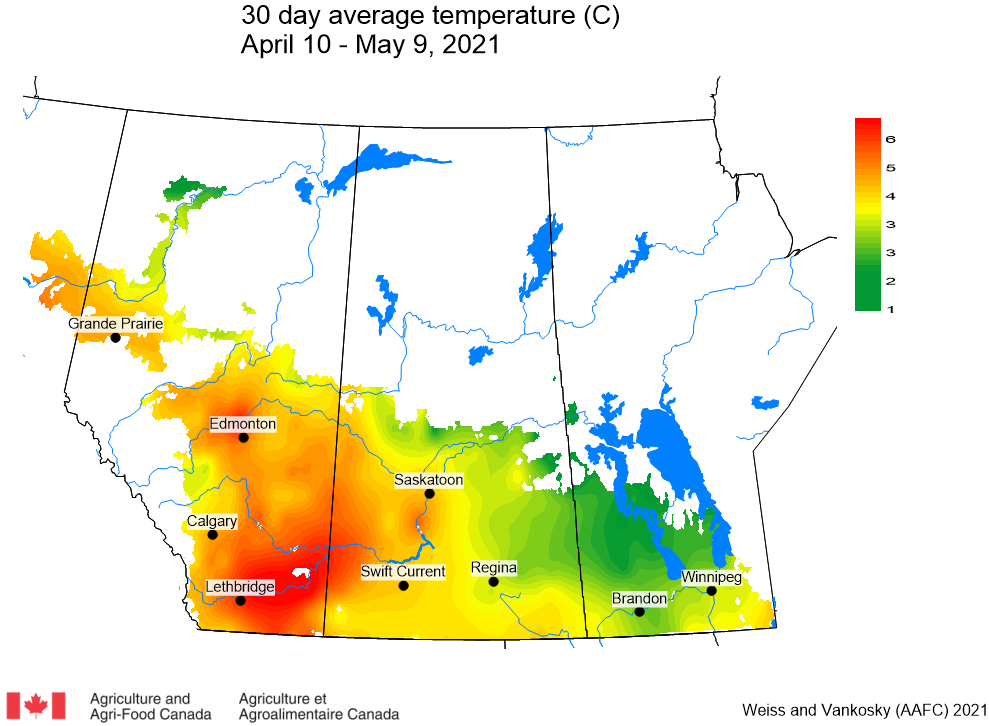
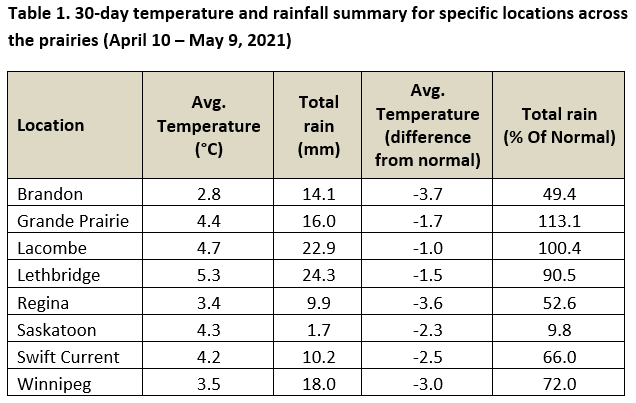
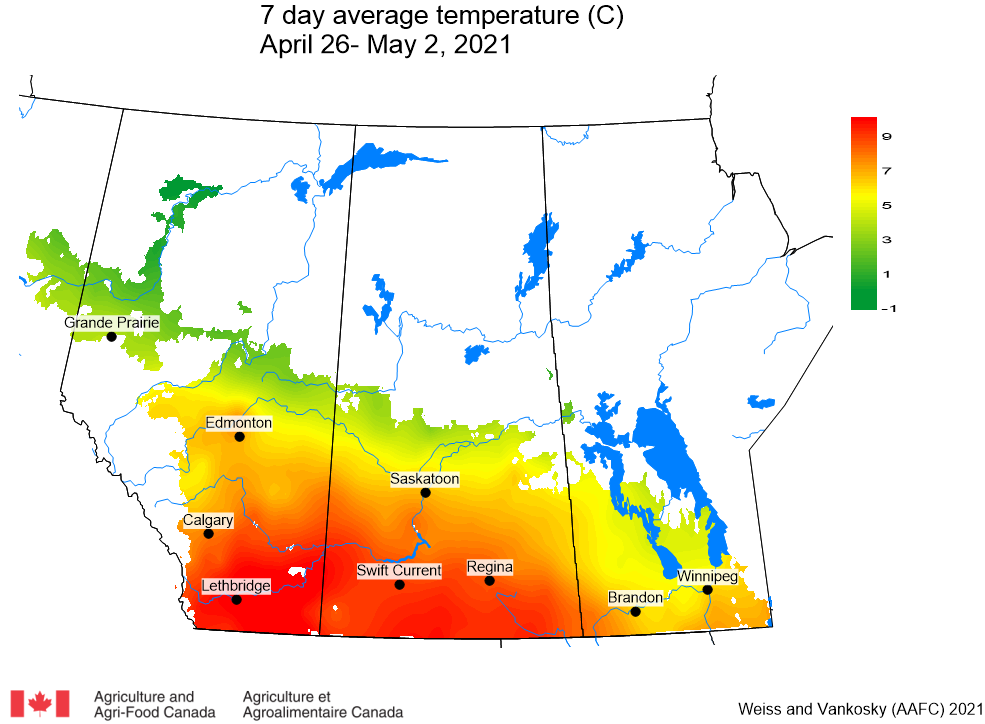
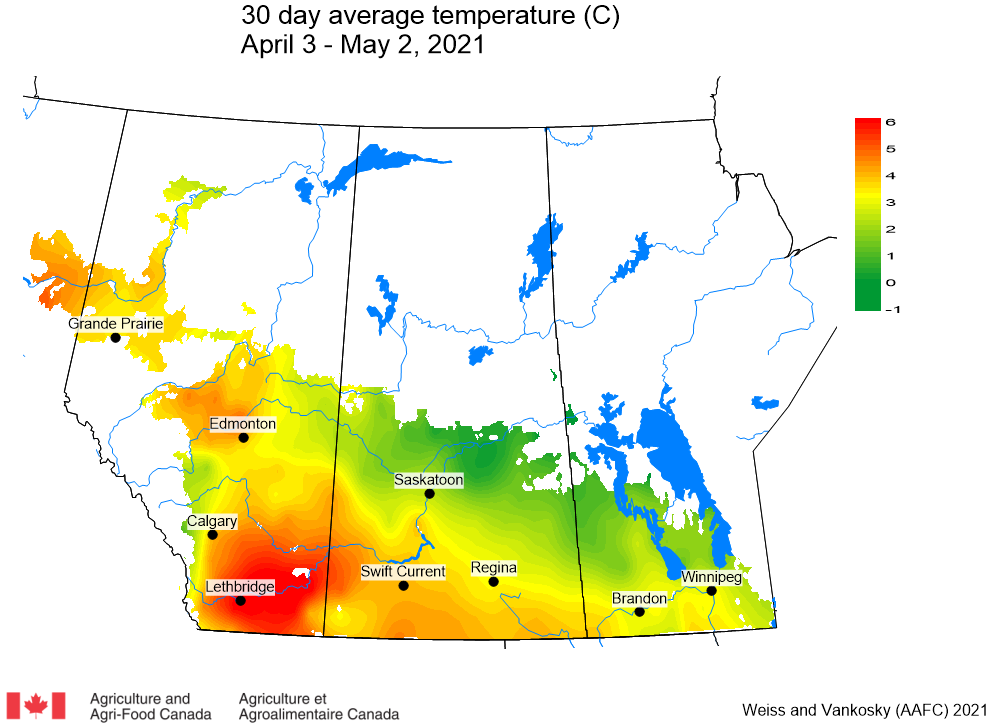
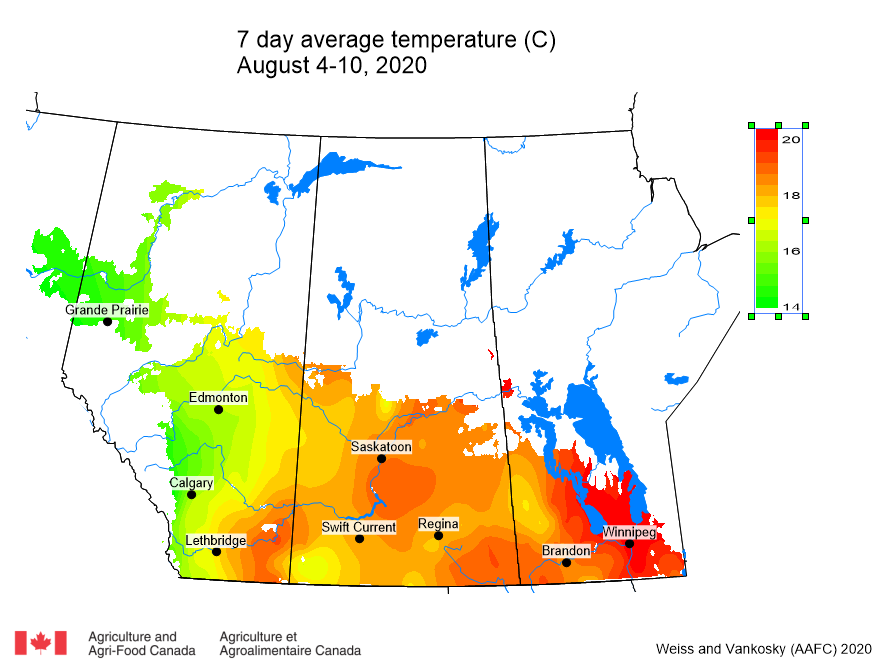
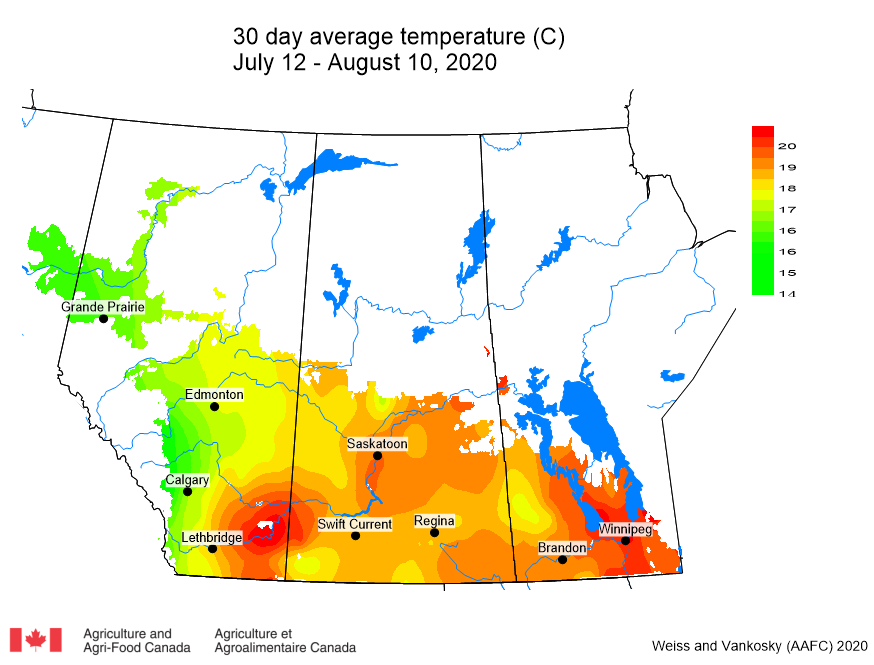
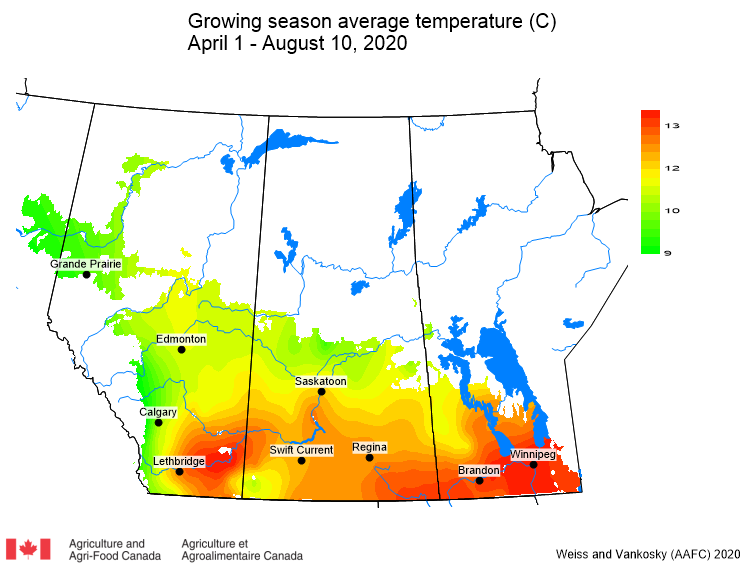
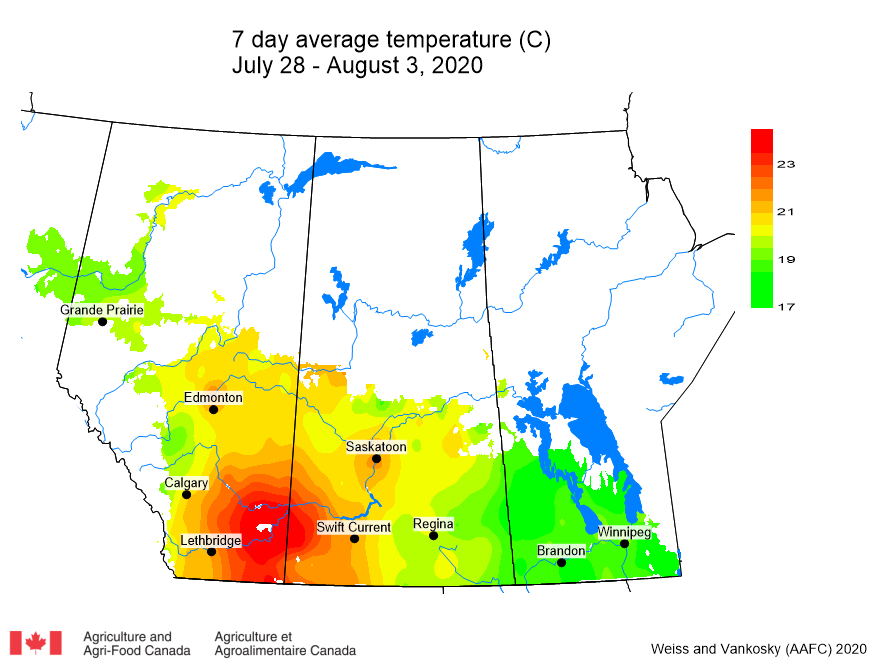
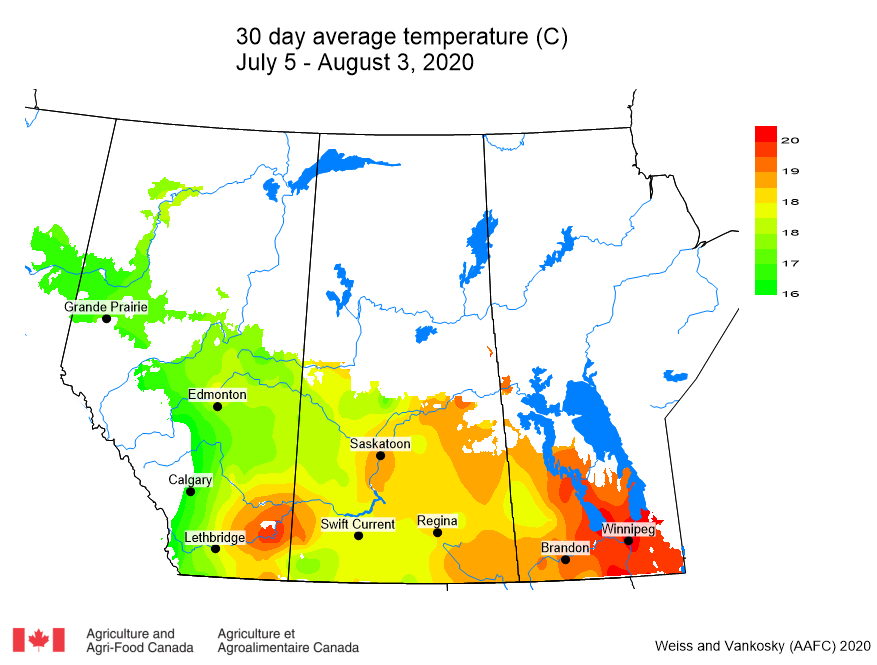
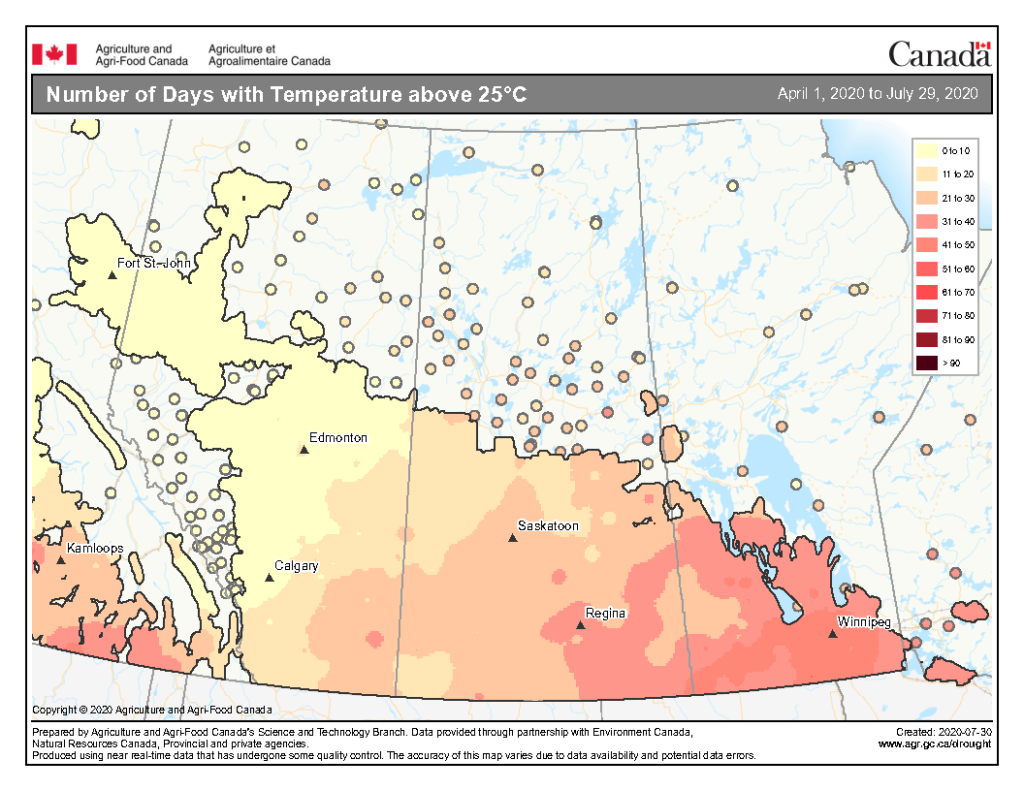
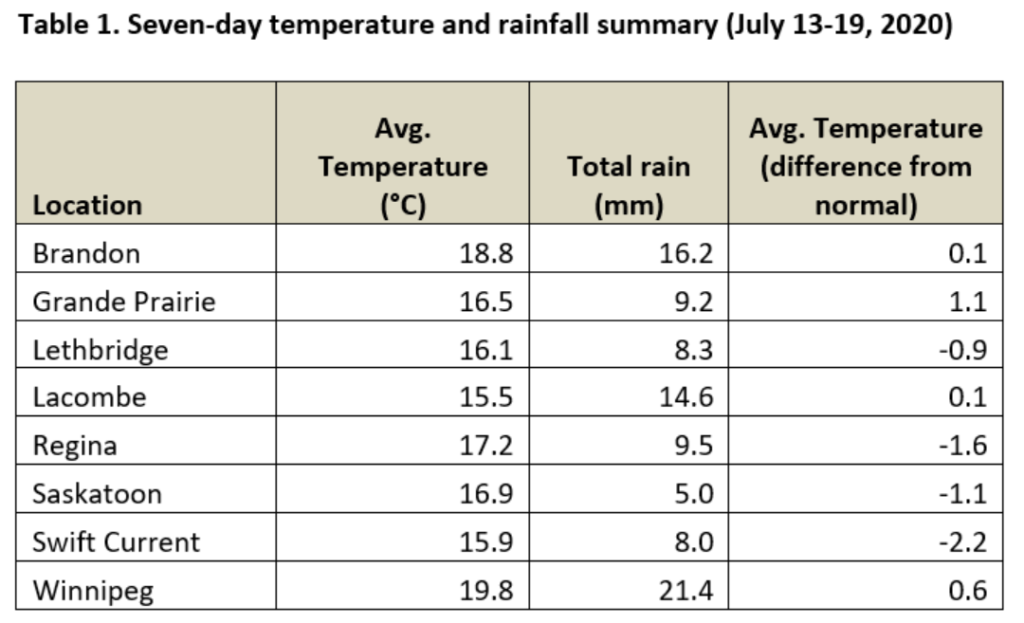
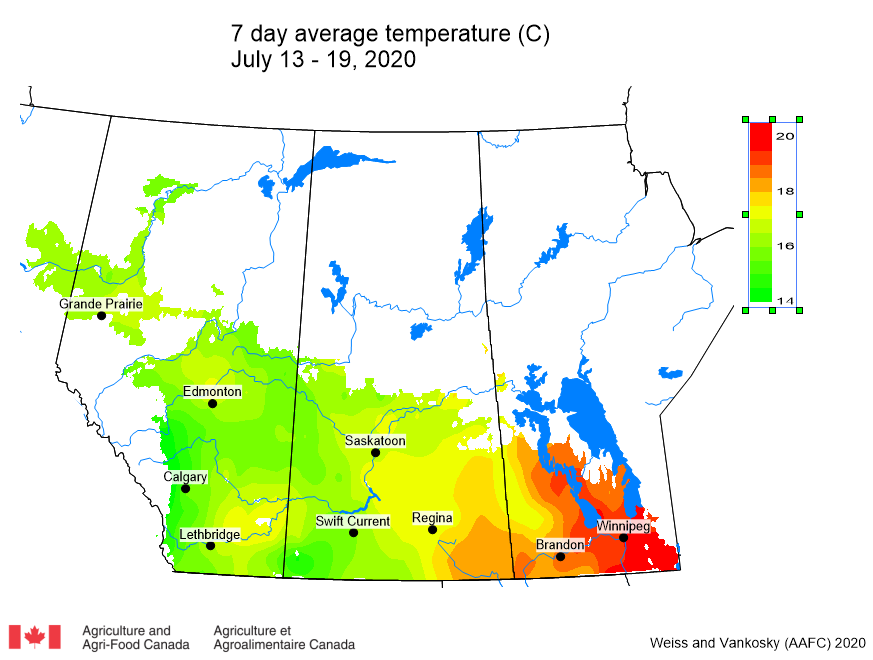
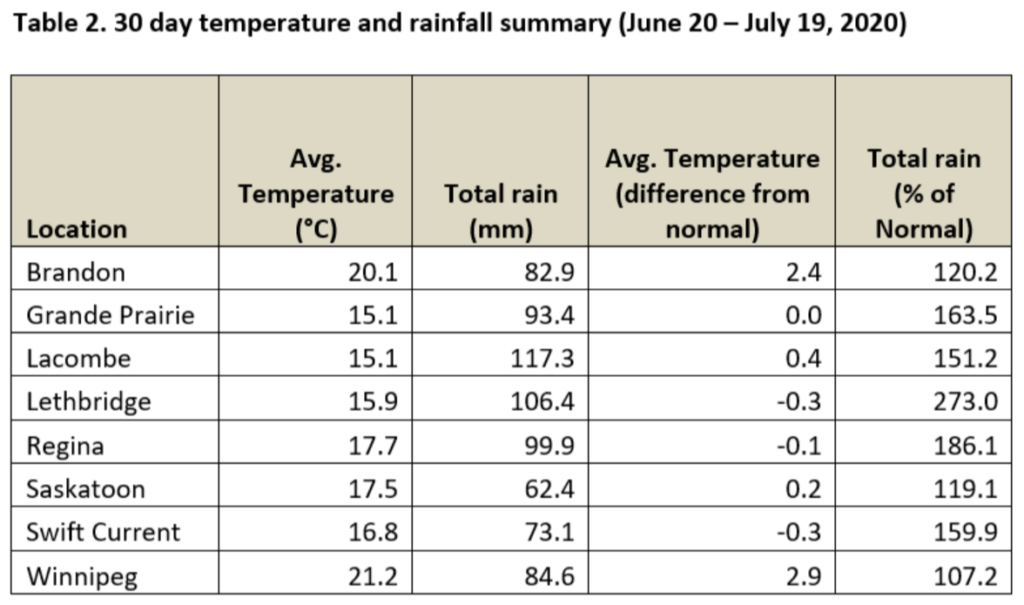
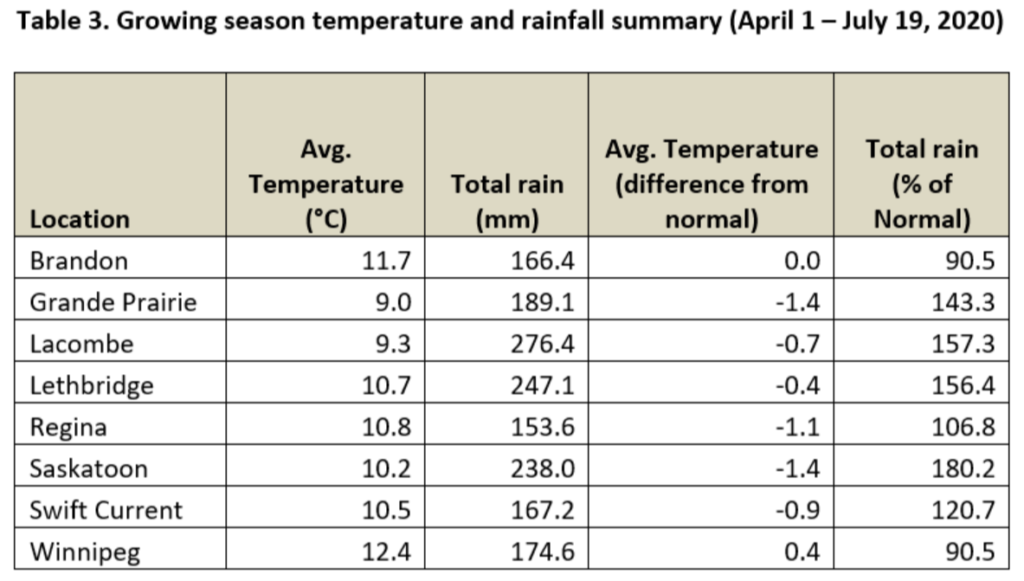
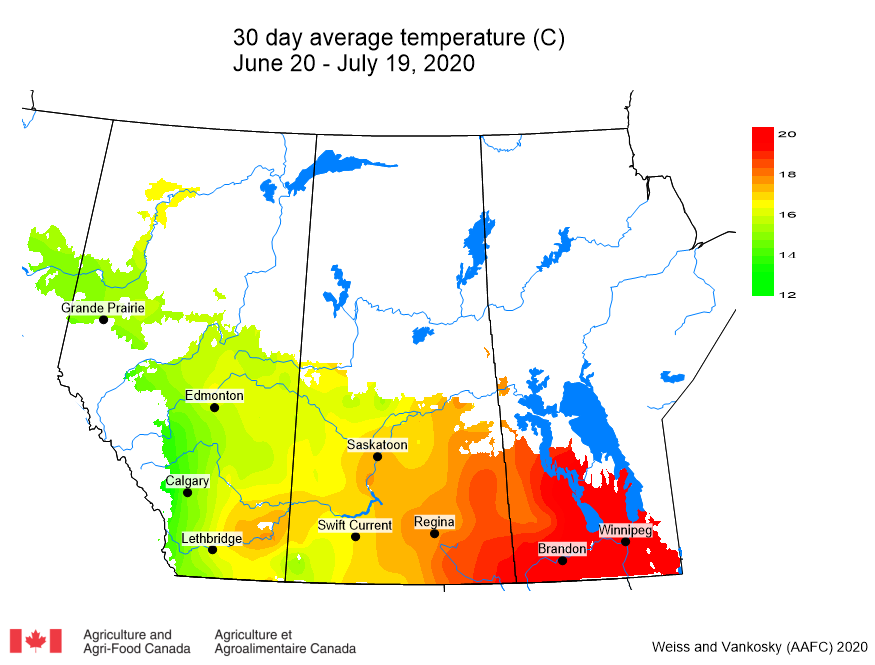
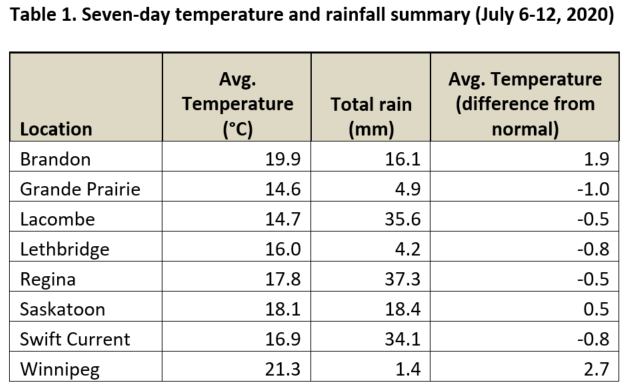
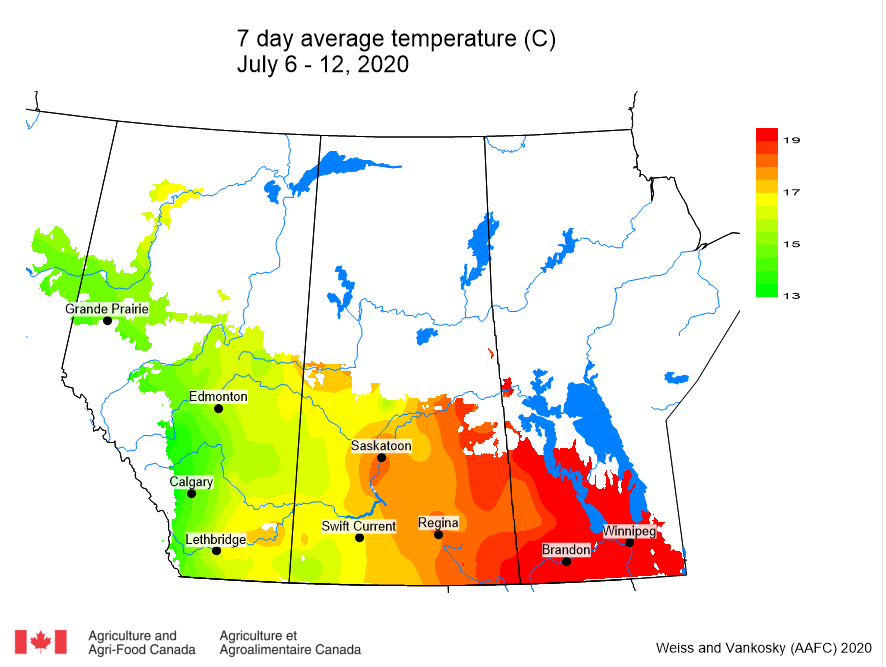
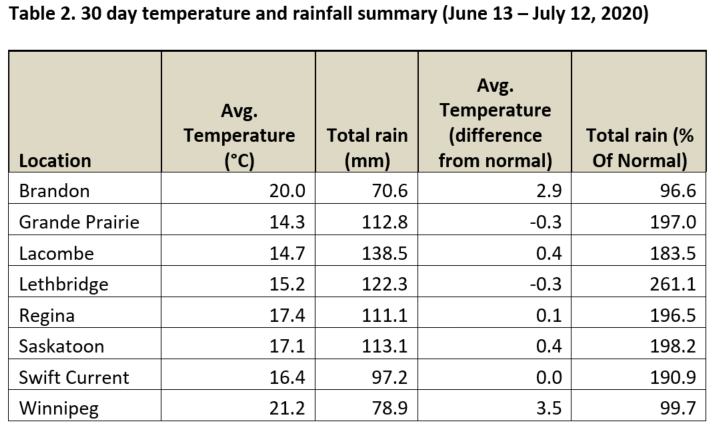
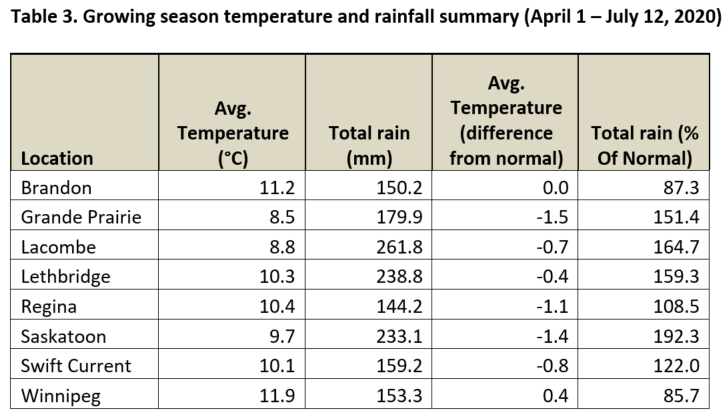
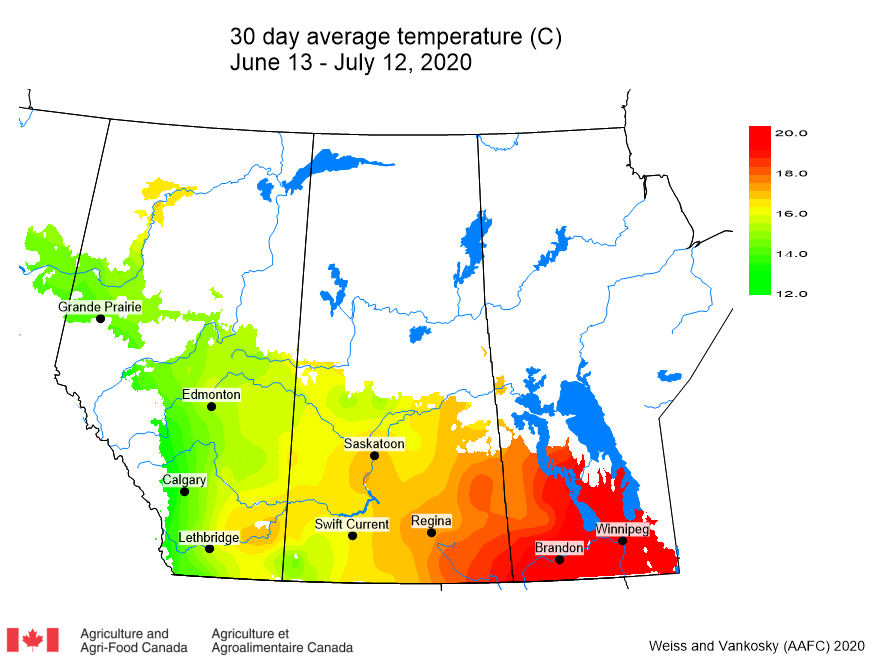
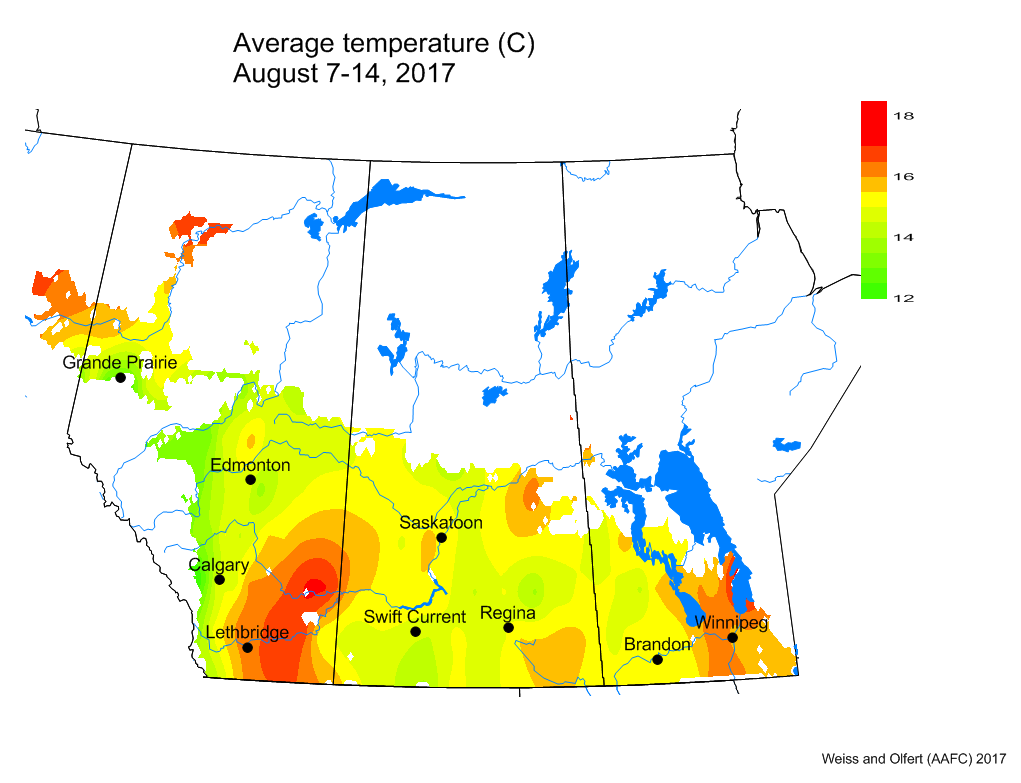
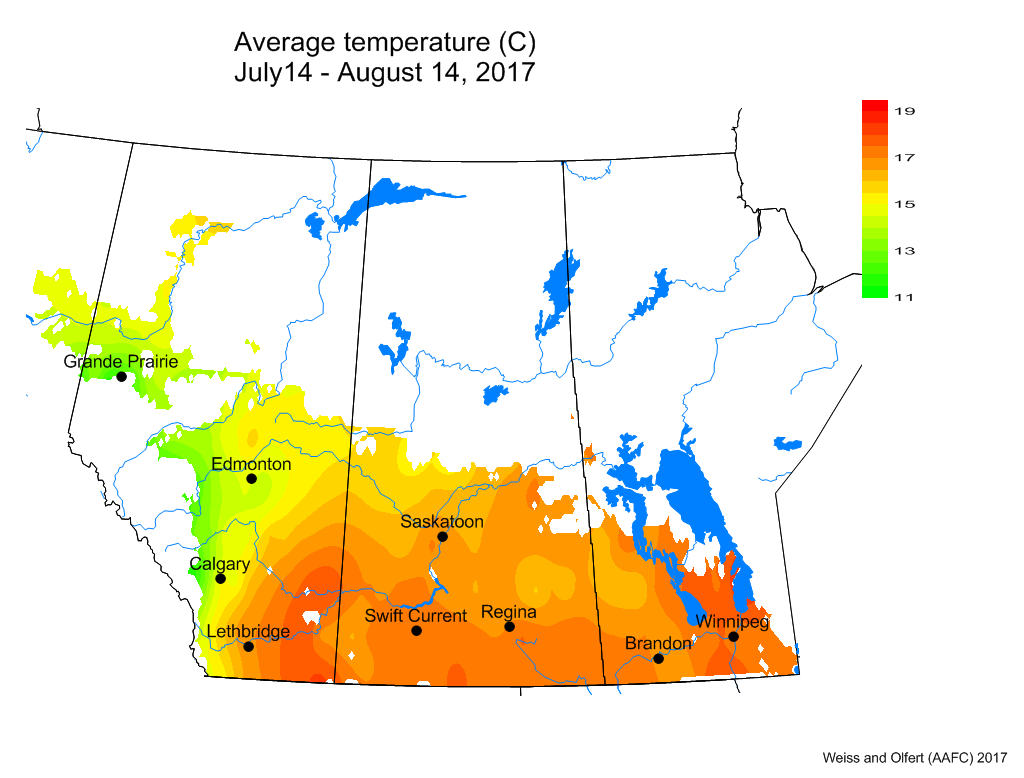
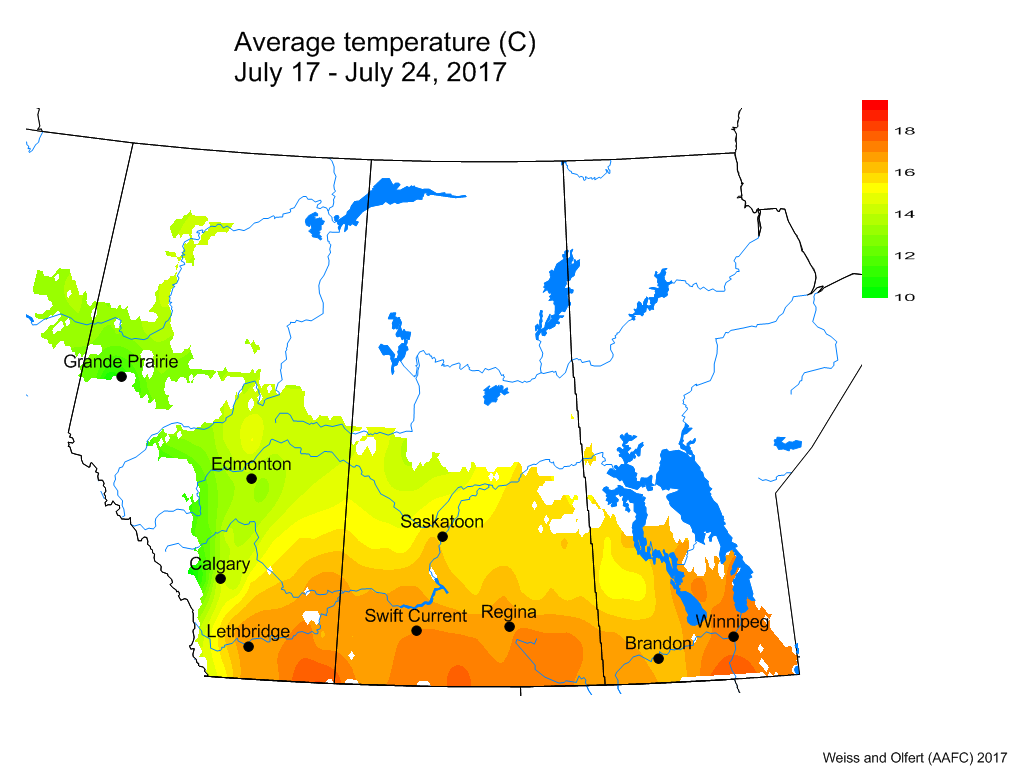
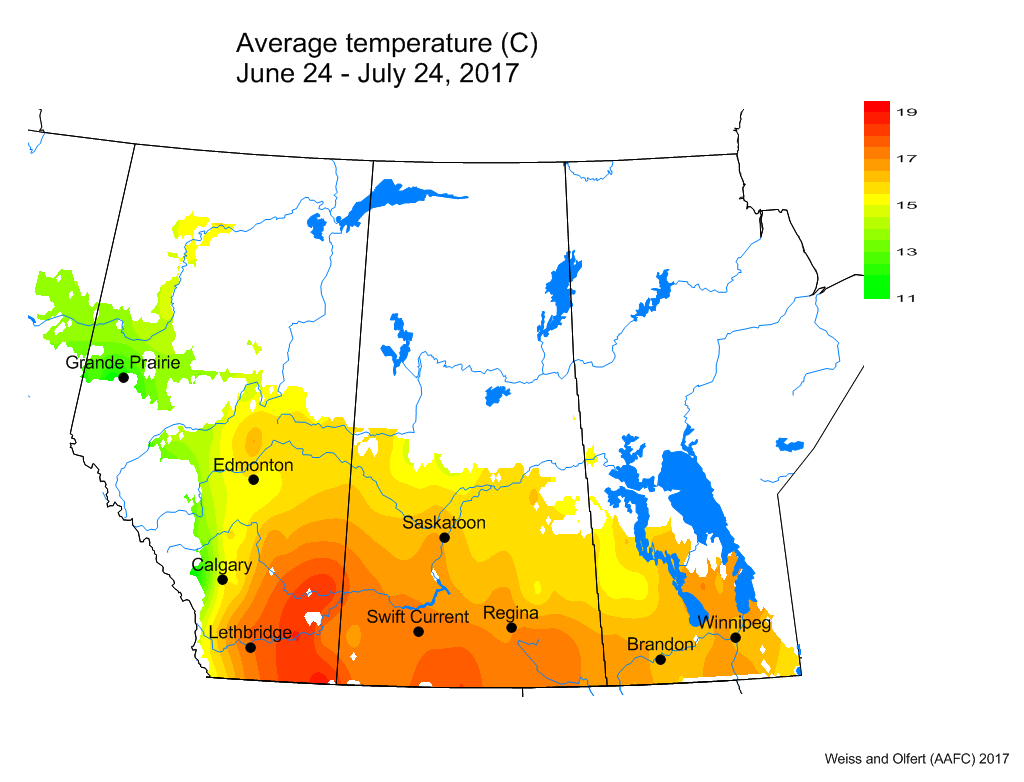
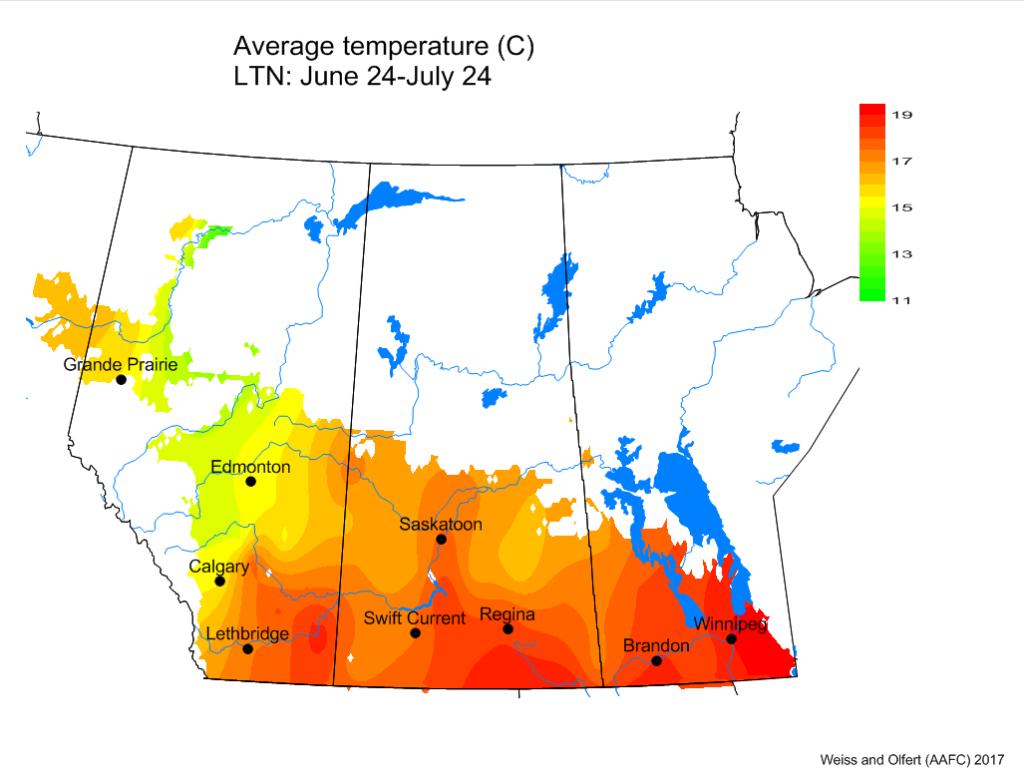
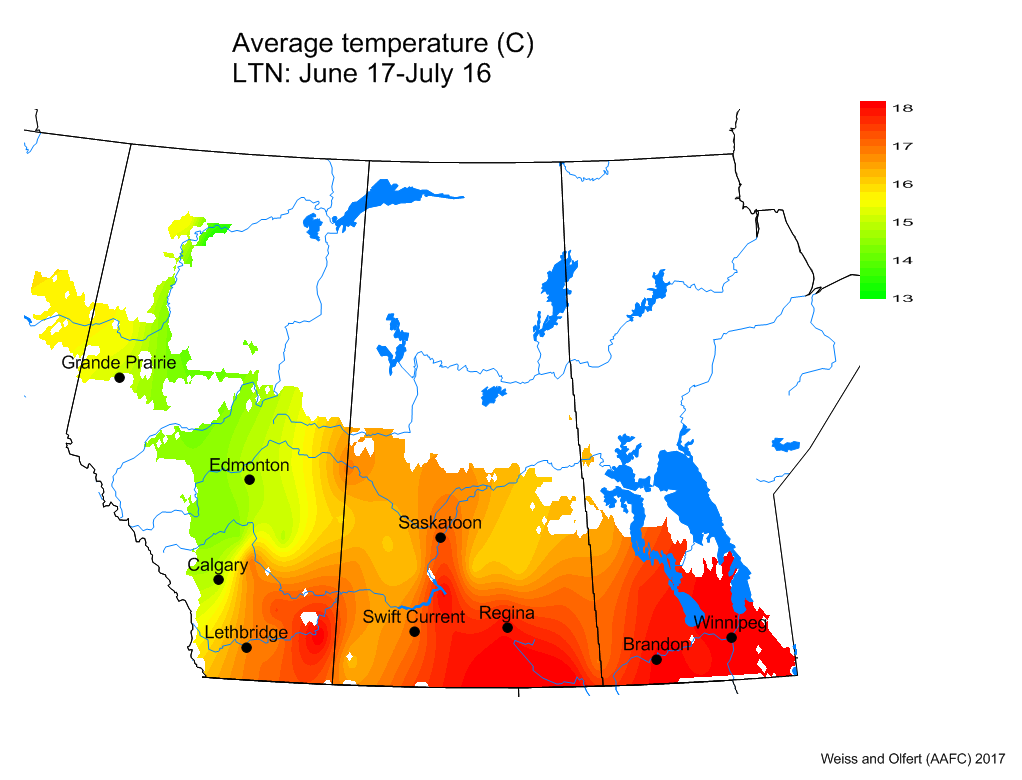
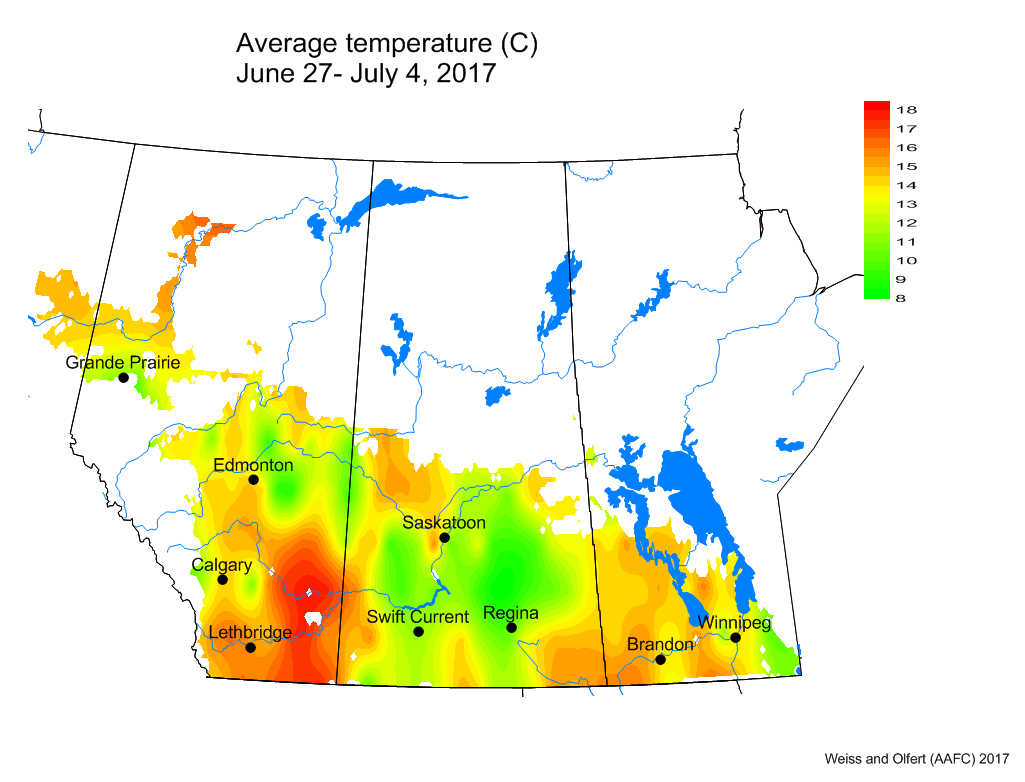
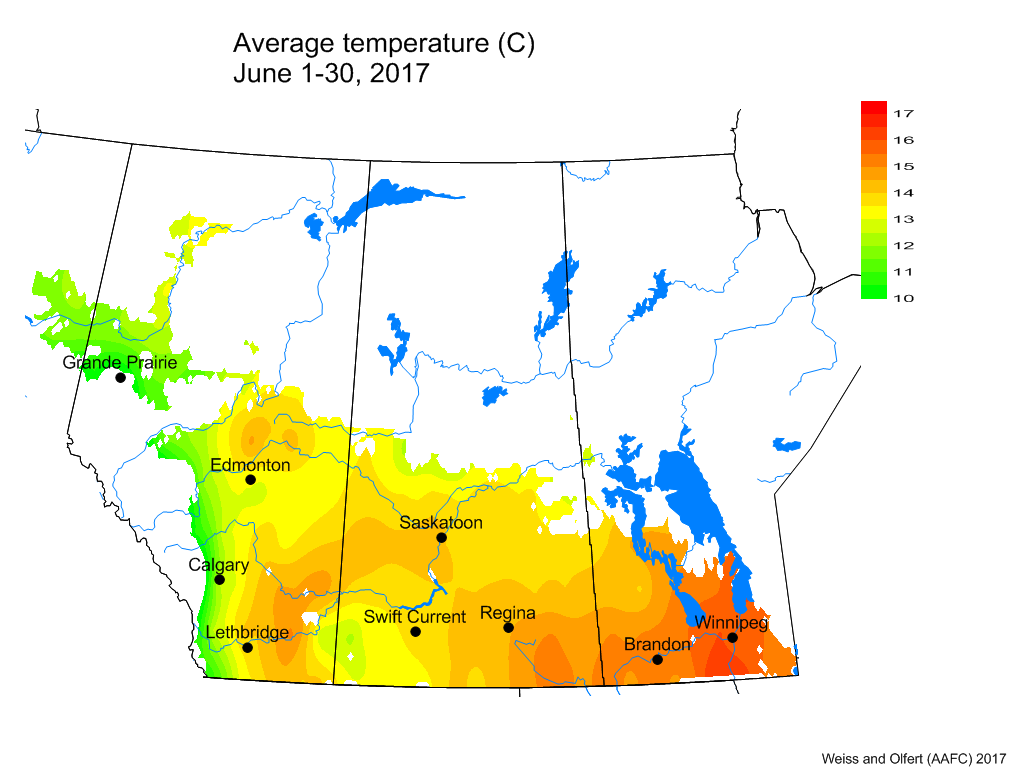
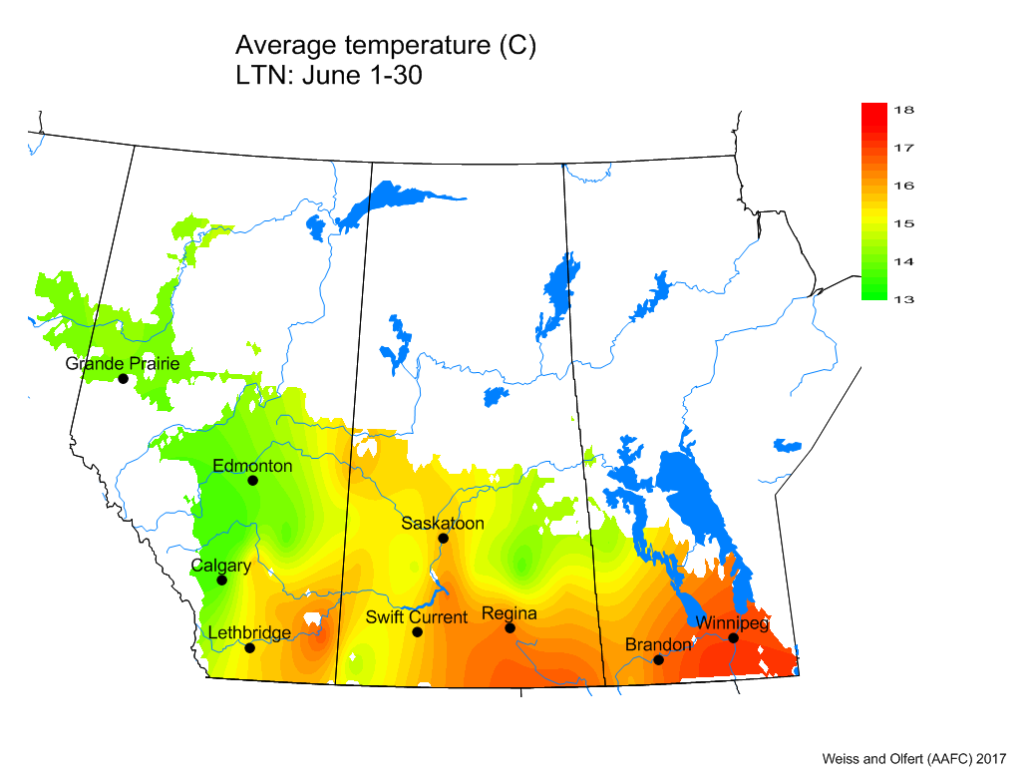
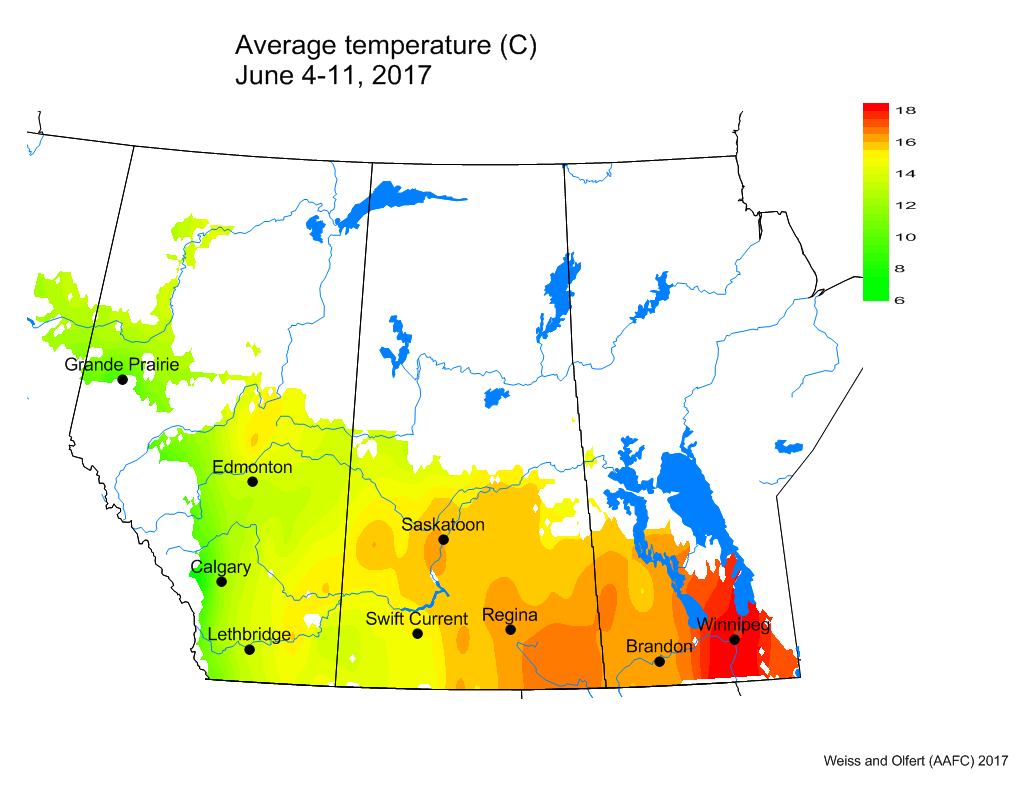
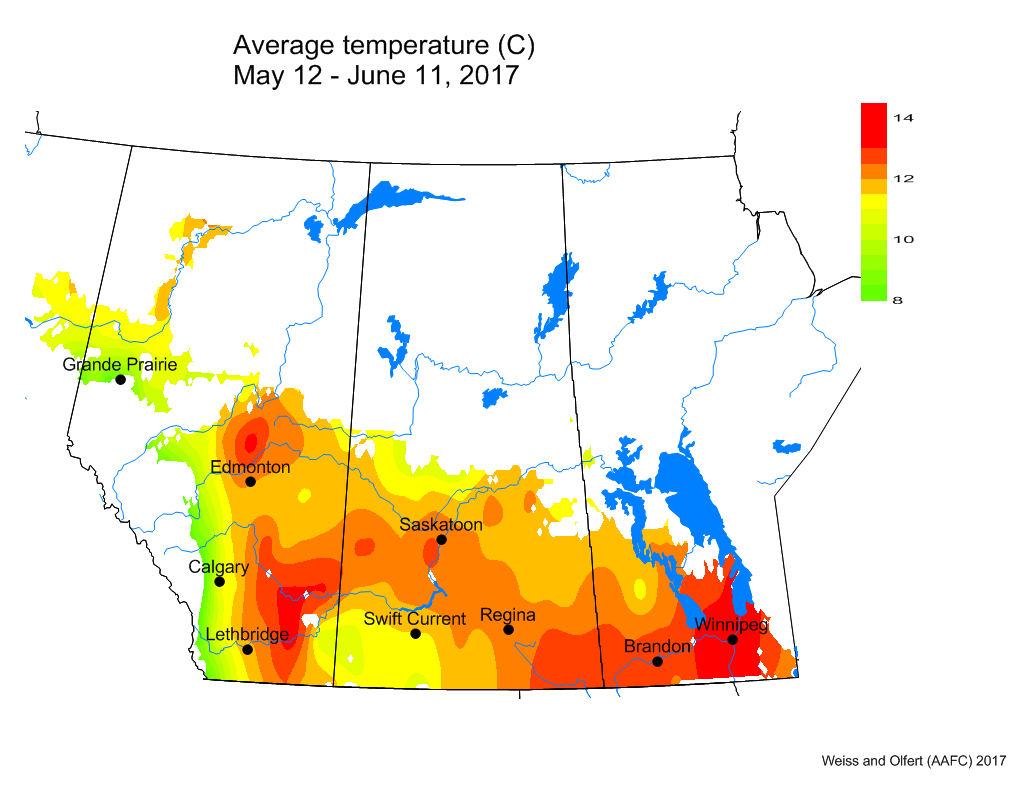
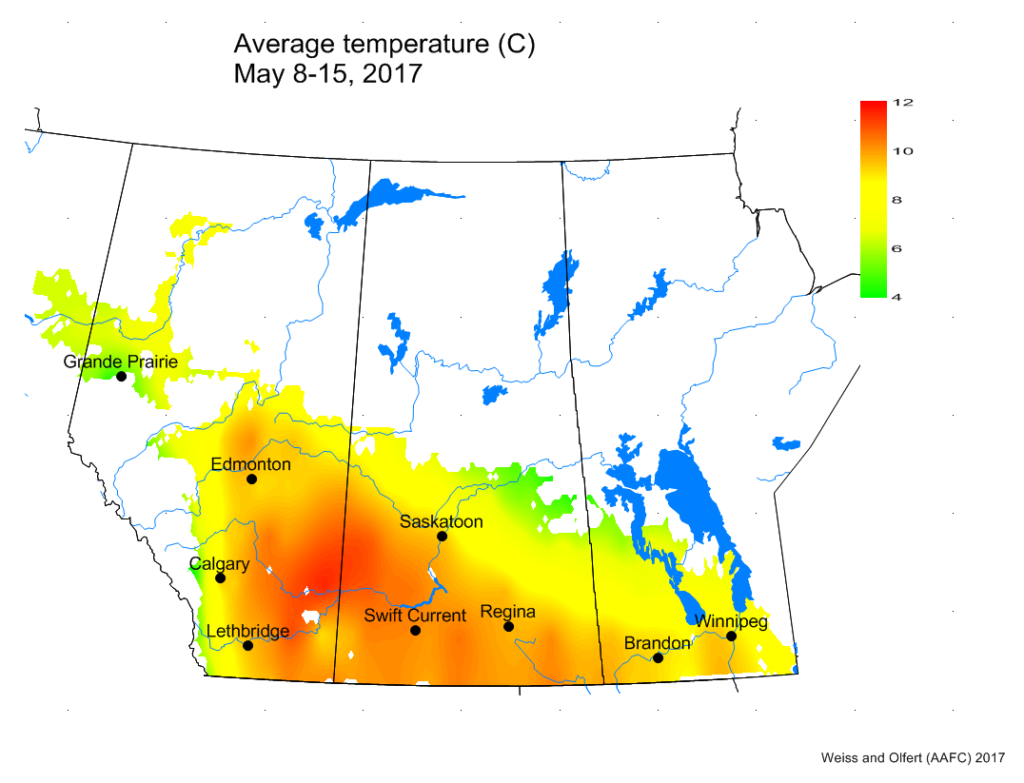
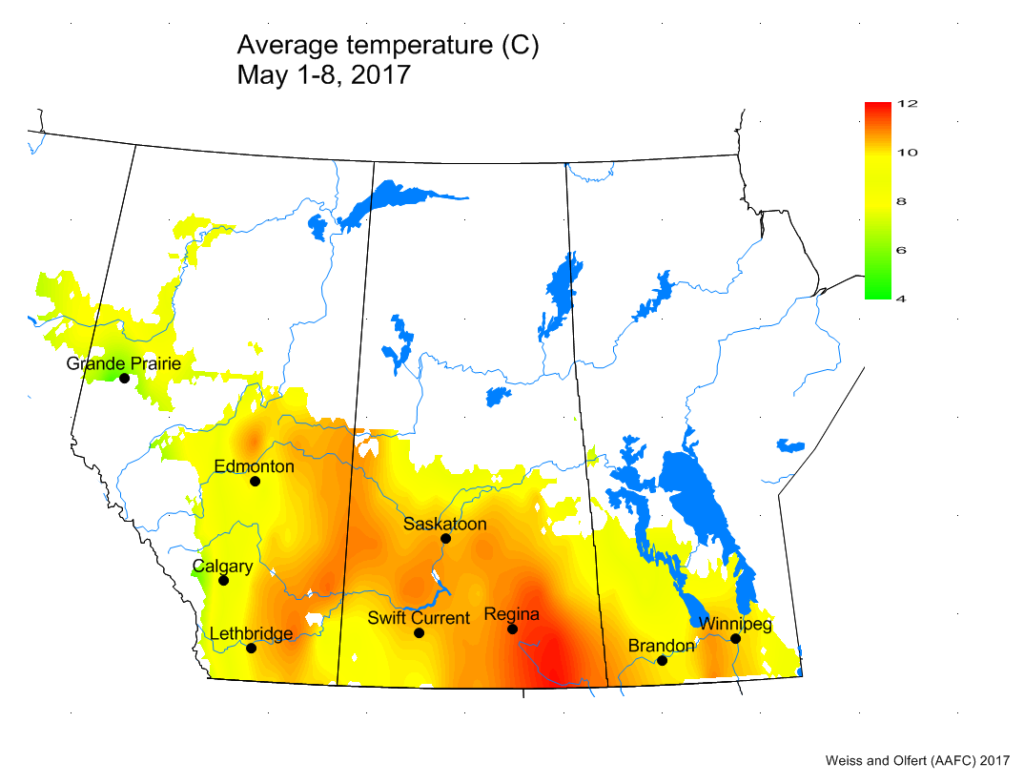
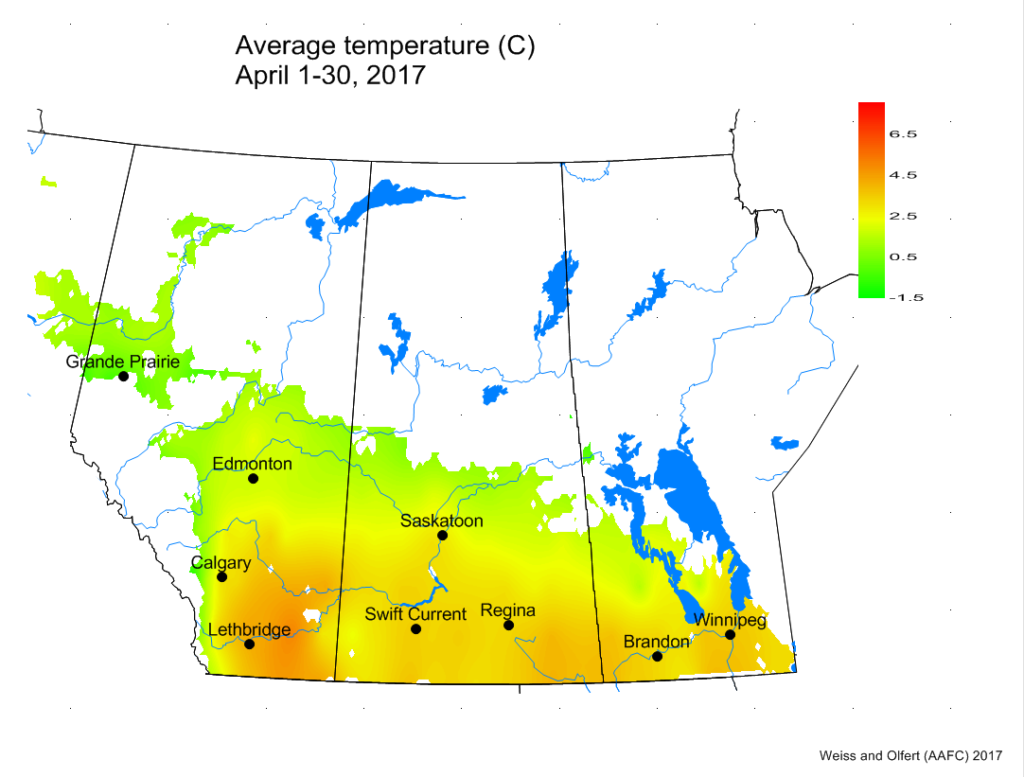
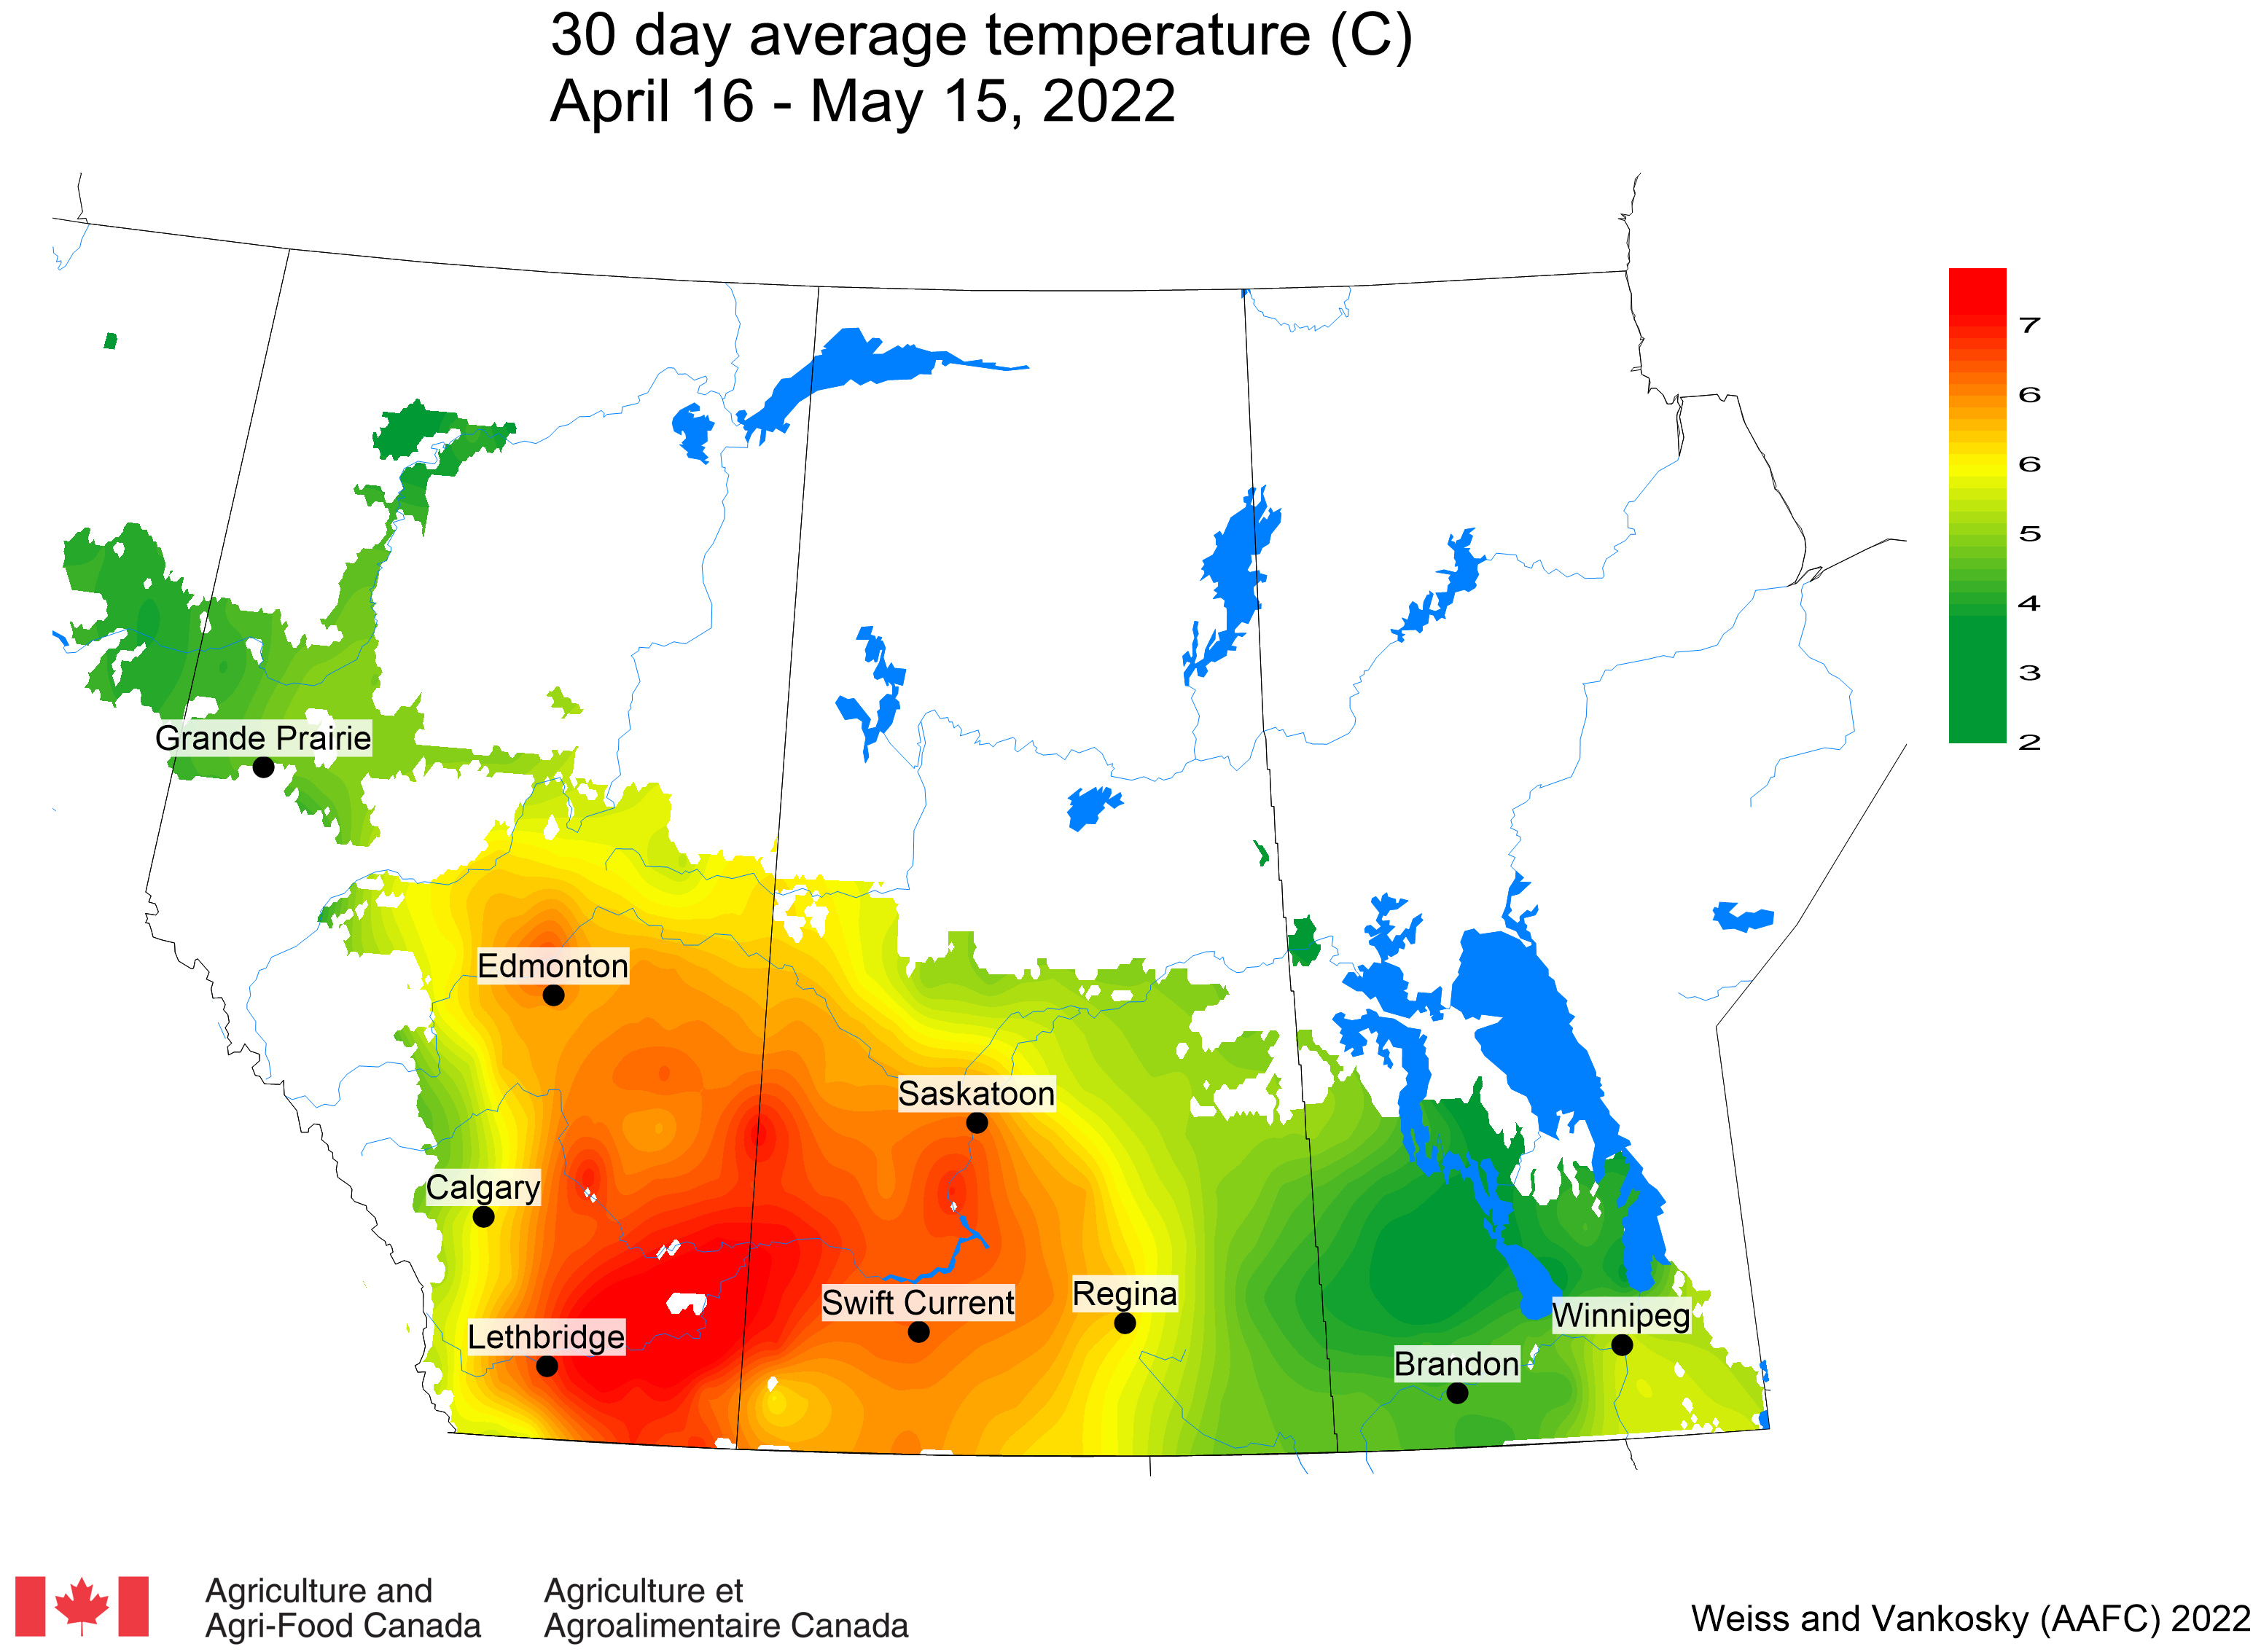
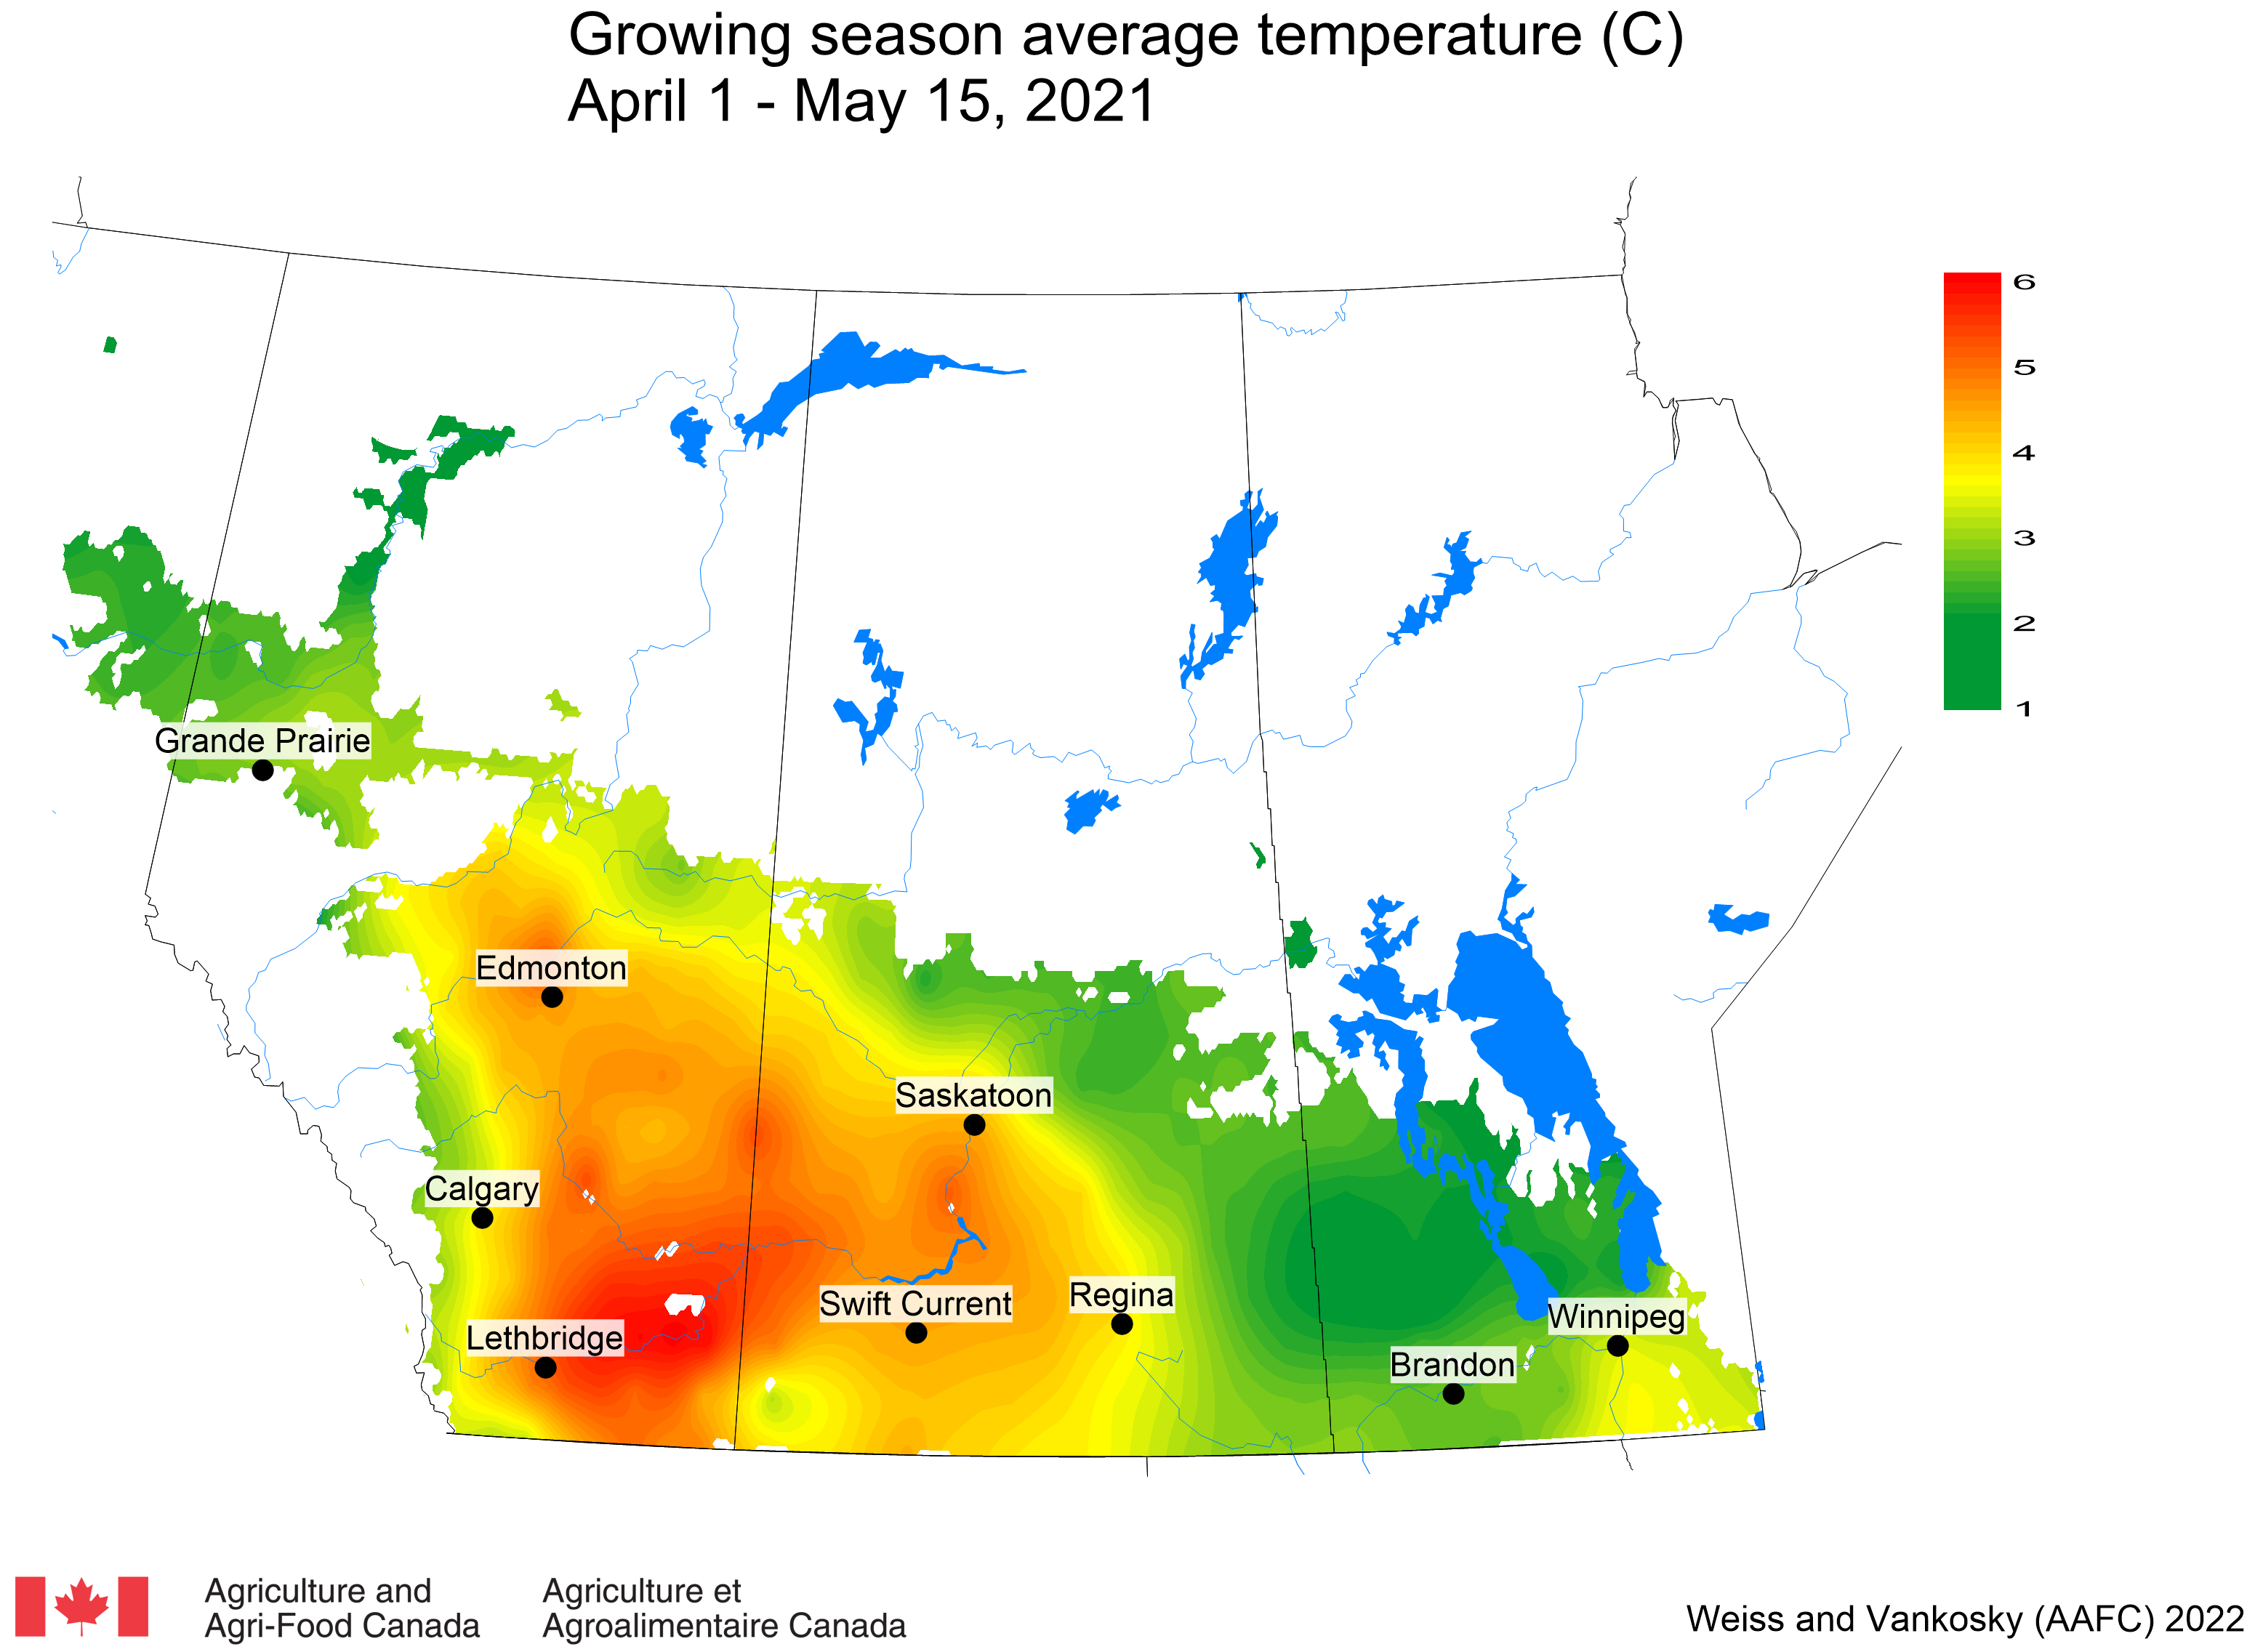
The seven-day average temperature across the Canadian prairies was slightly above 14 °C from June 16-22, 2025 (Fig. 1). Areas surrounding Winnipeg and Brandon received the warmest average temperatures, while areas around Calgary and Grand Prairie experienced the coolest temperatures. Over the past 30 days, the average temperature across the Canadian prairies was around 15 °C (Fig. 2), which is slightly above the long-term climate normal. Since April 1, 2025, production areas near Lethbridge AB and Winnipeg MB have been the warmest, whereas areas near Grande Prairie AB have been the coolest (Fig. 3).
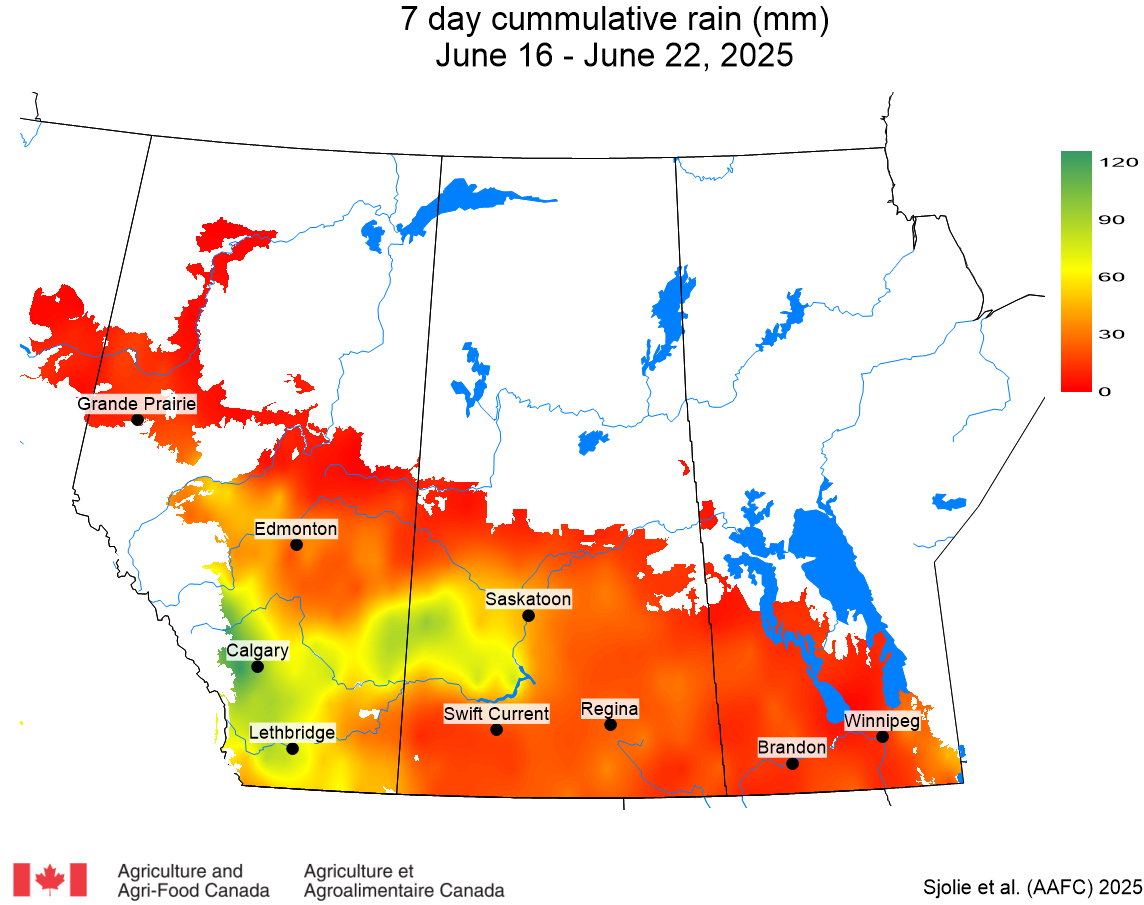
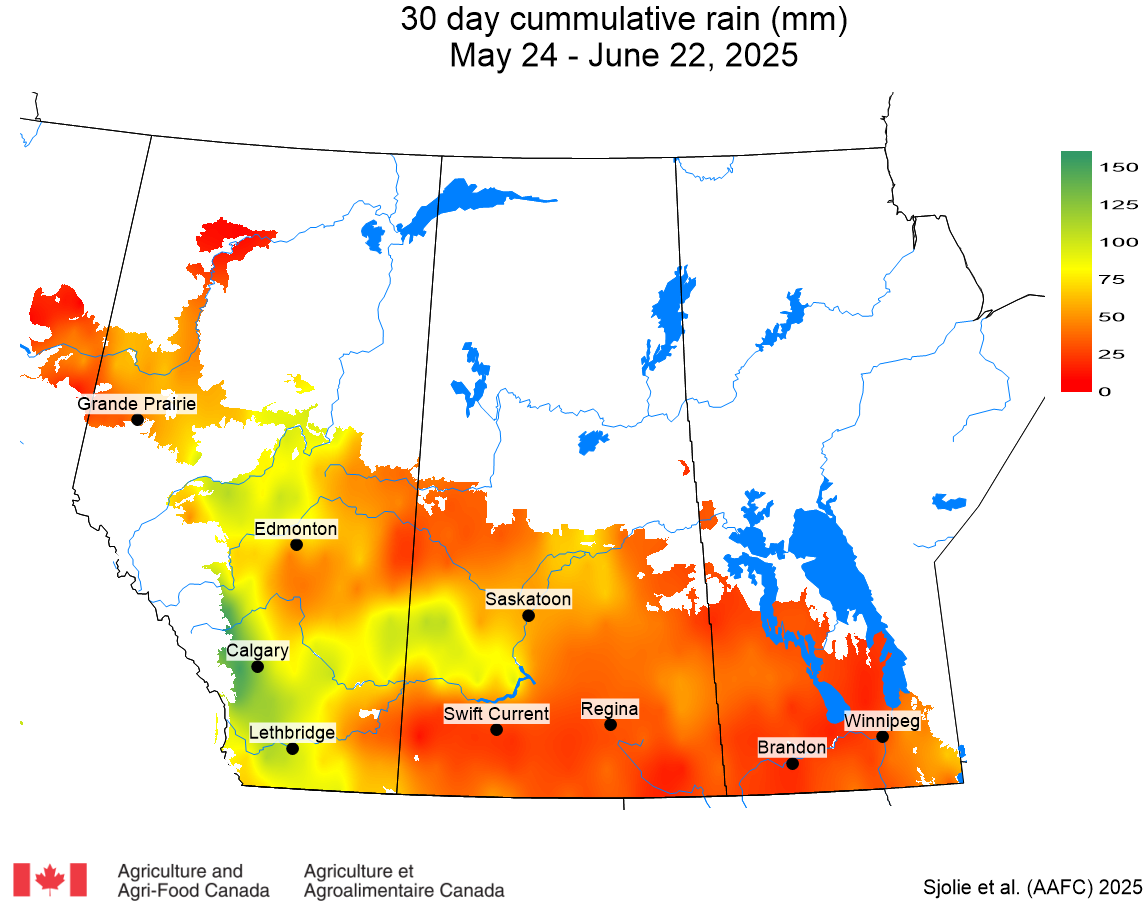
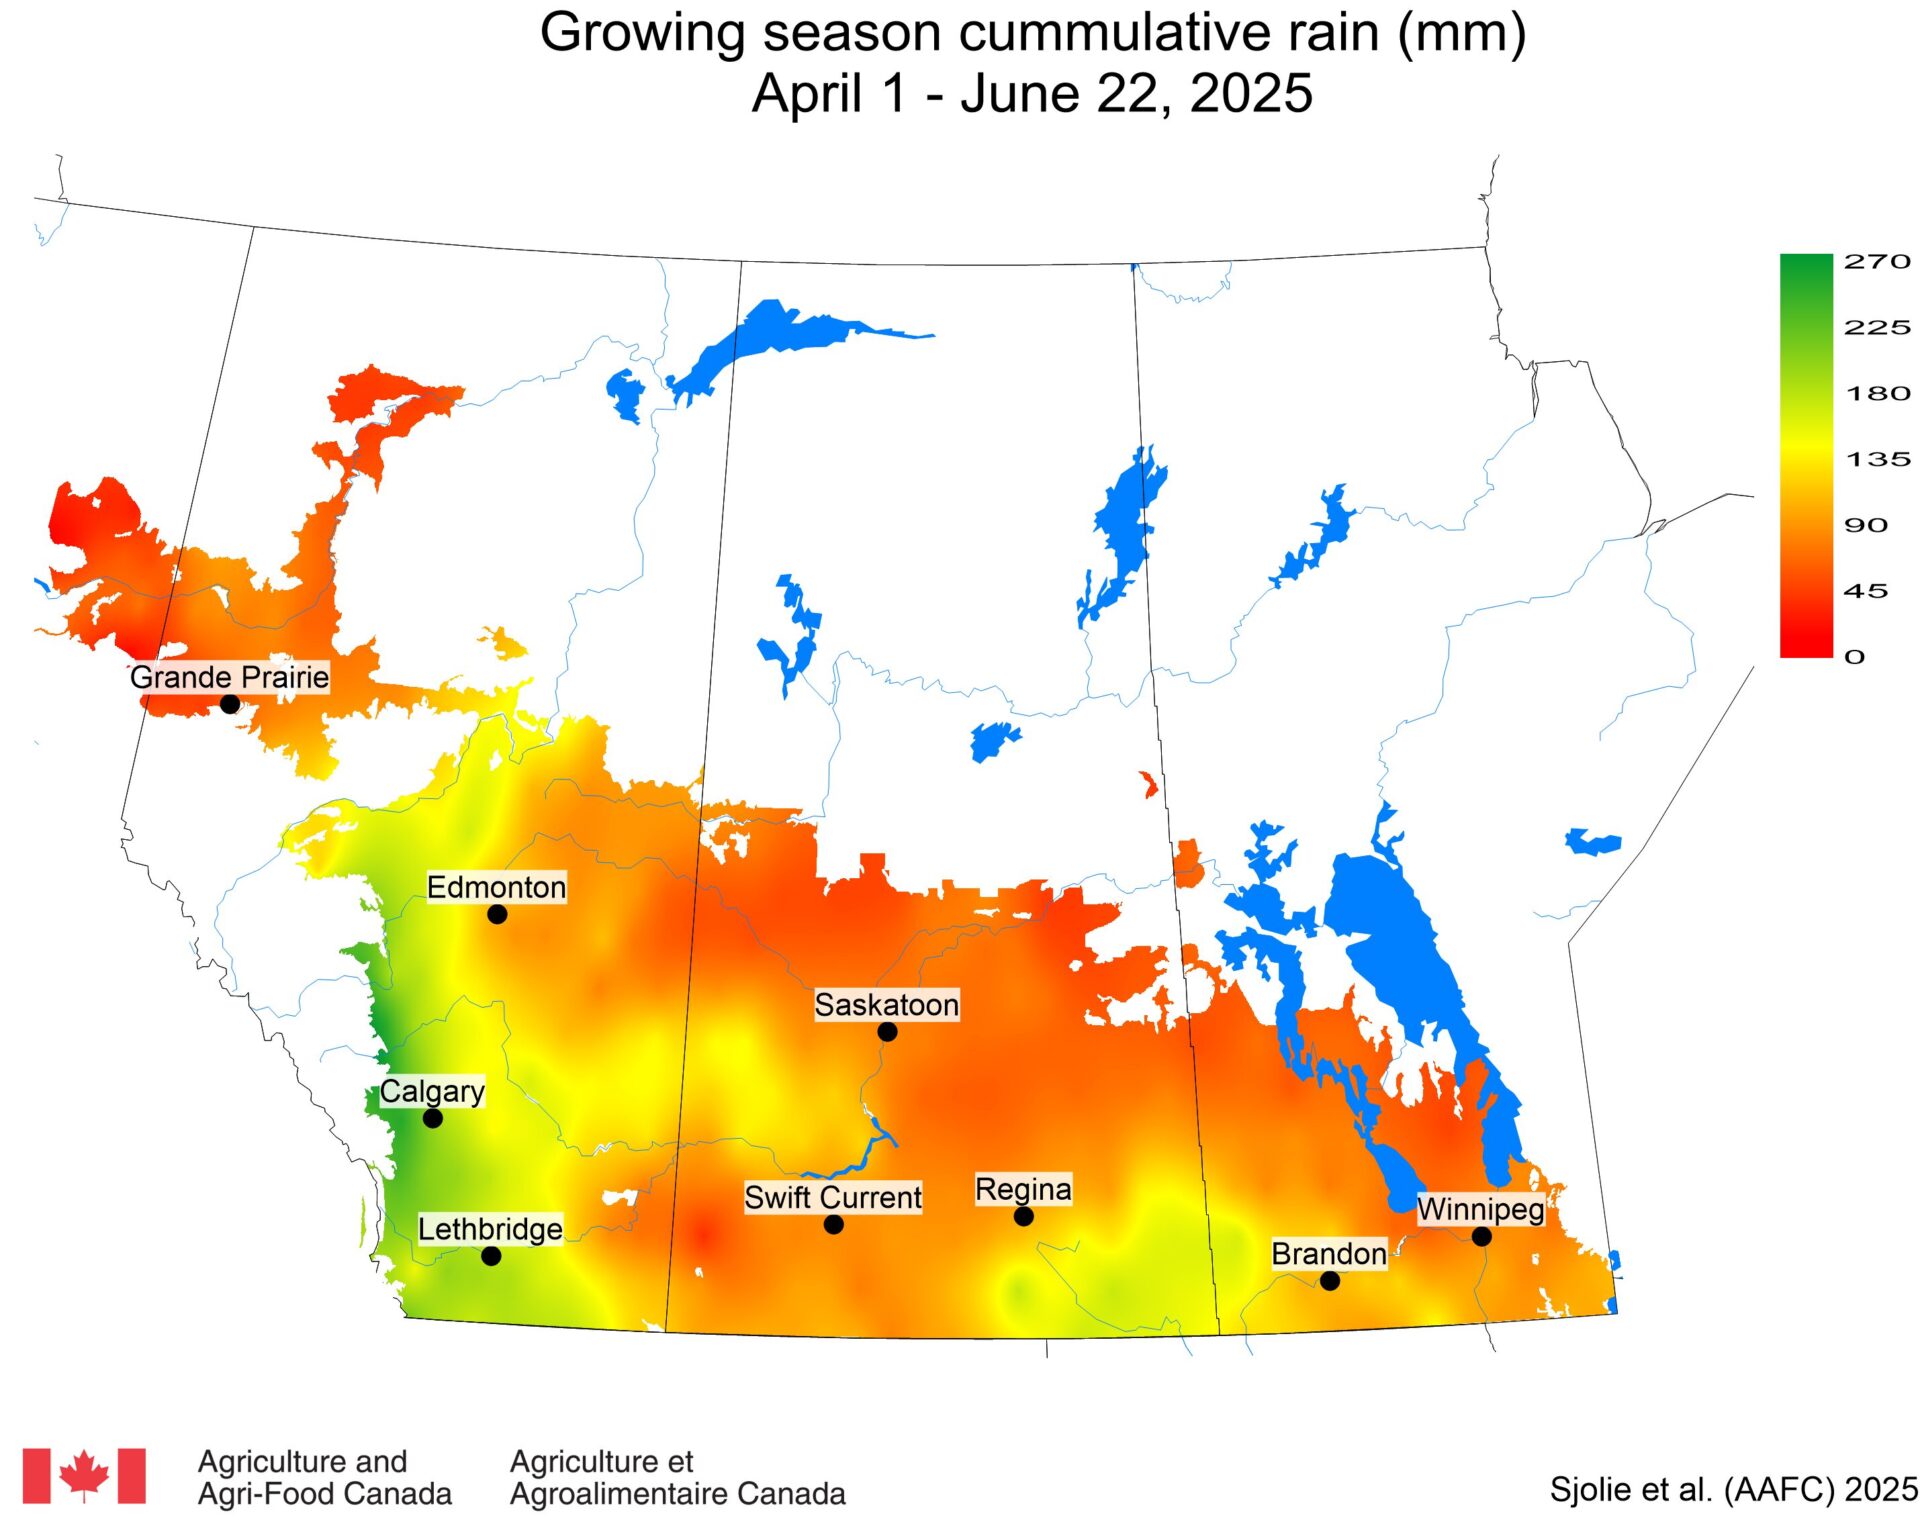
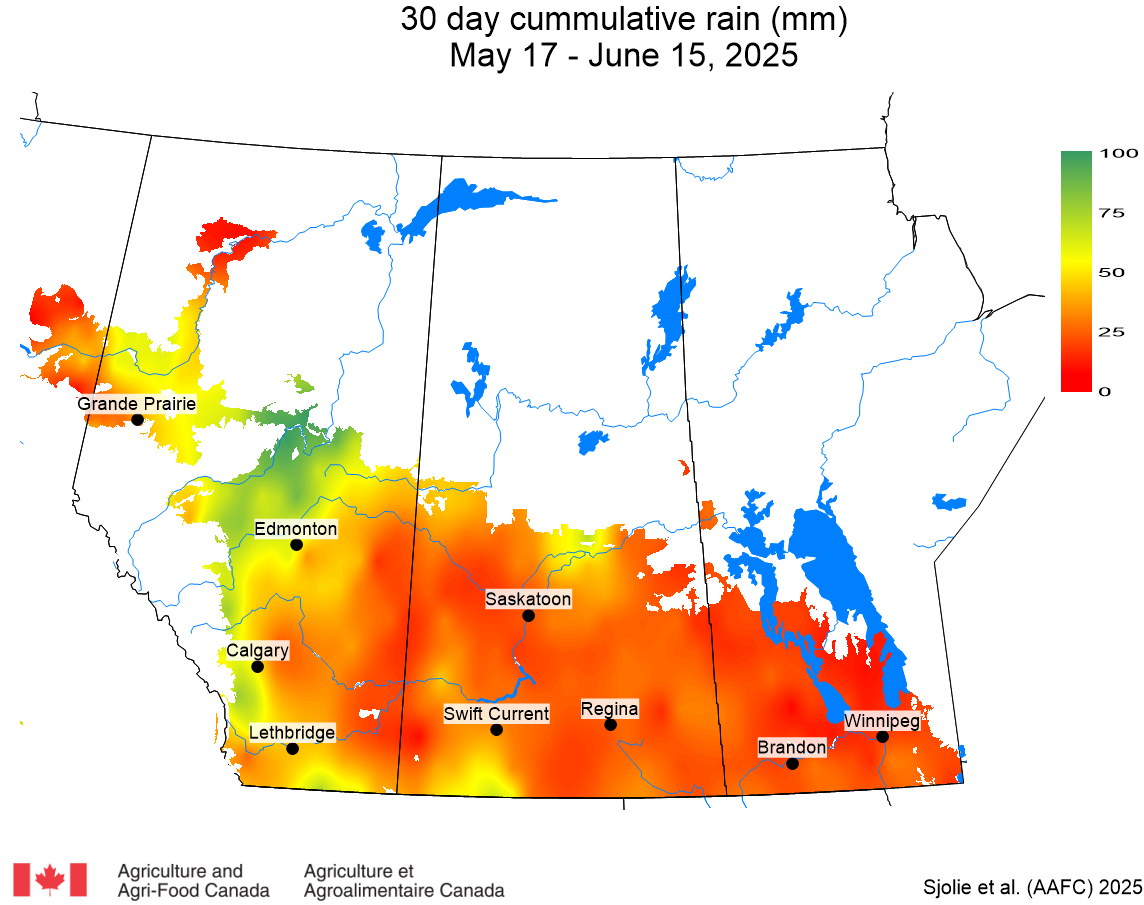
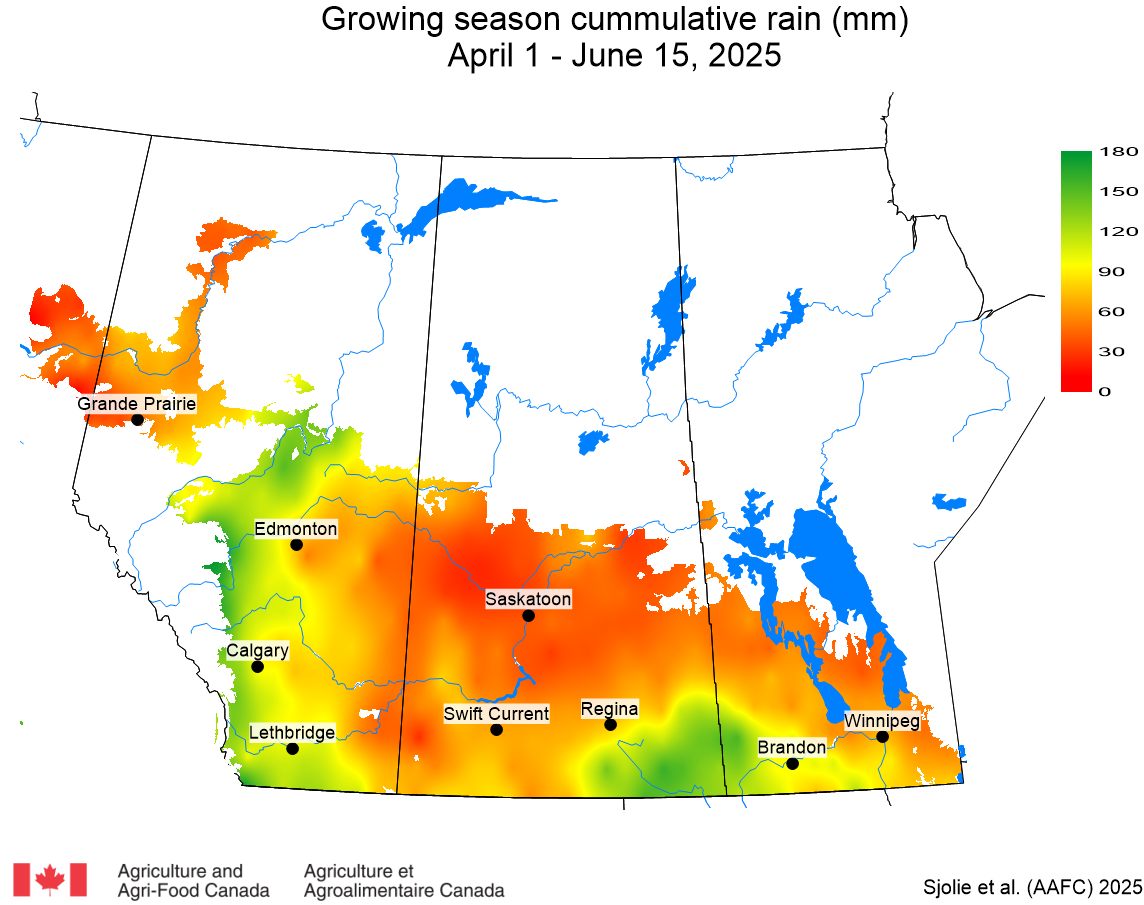
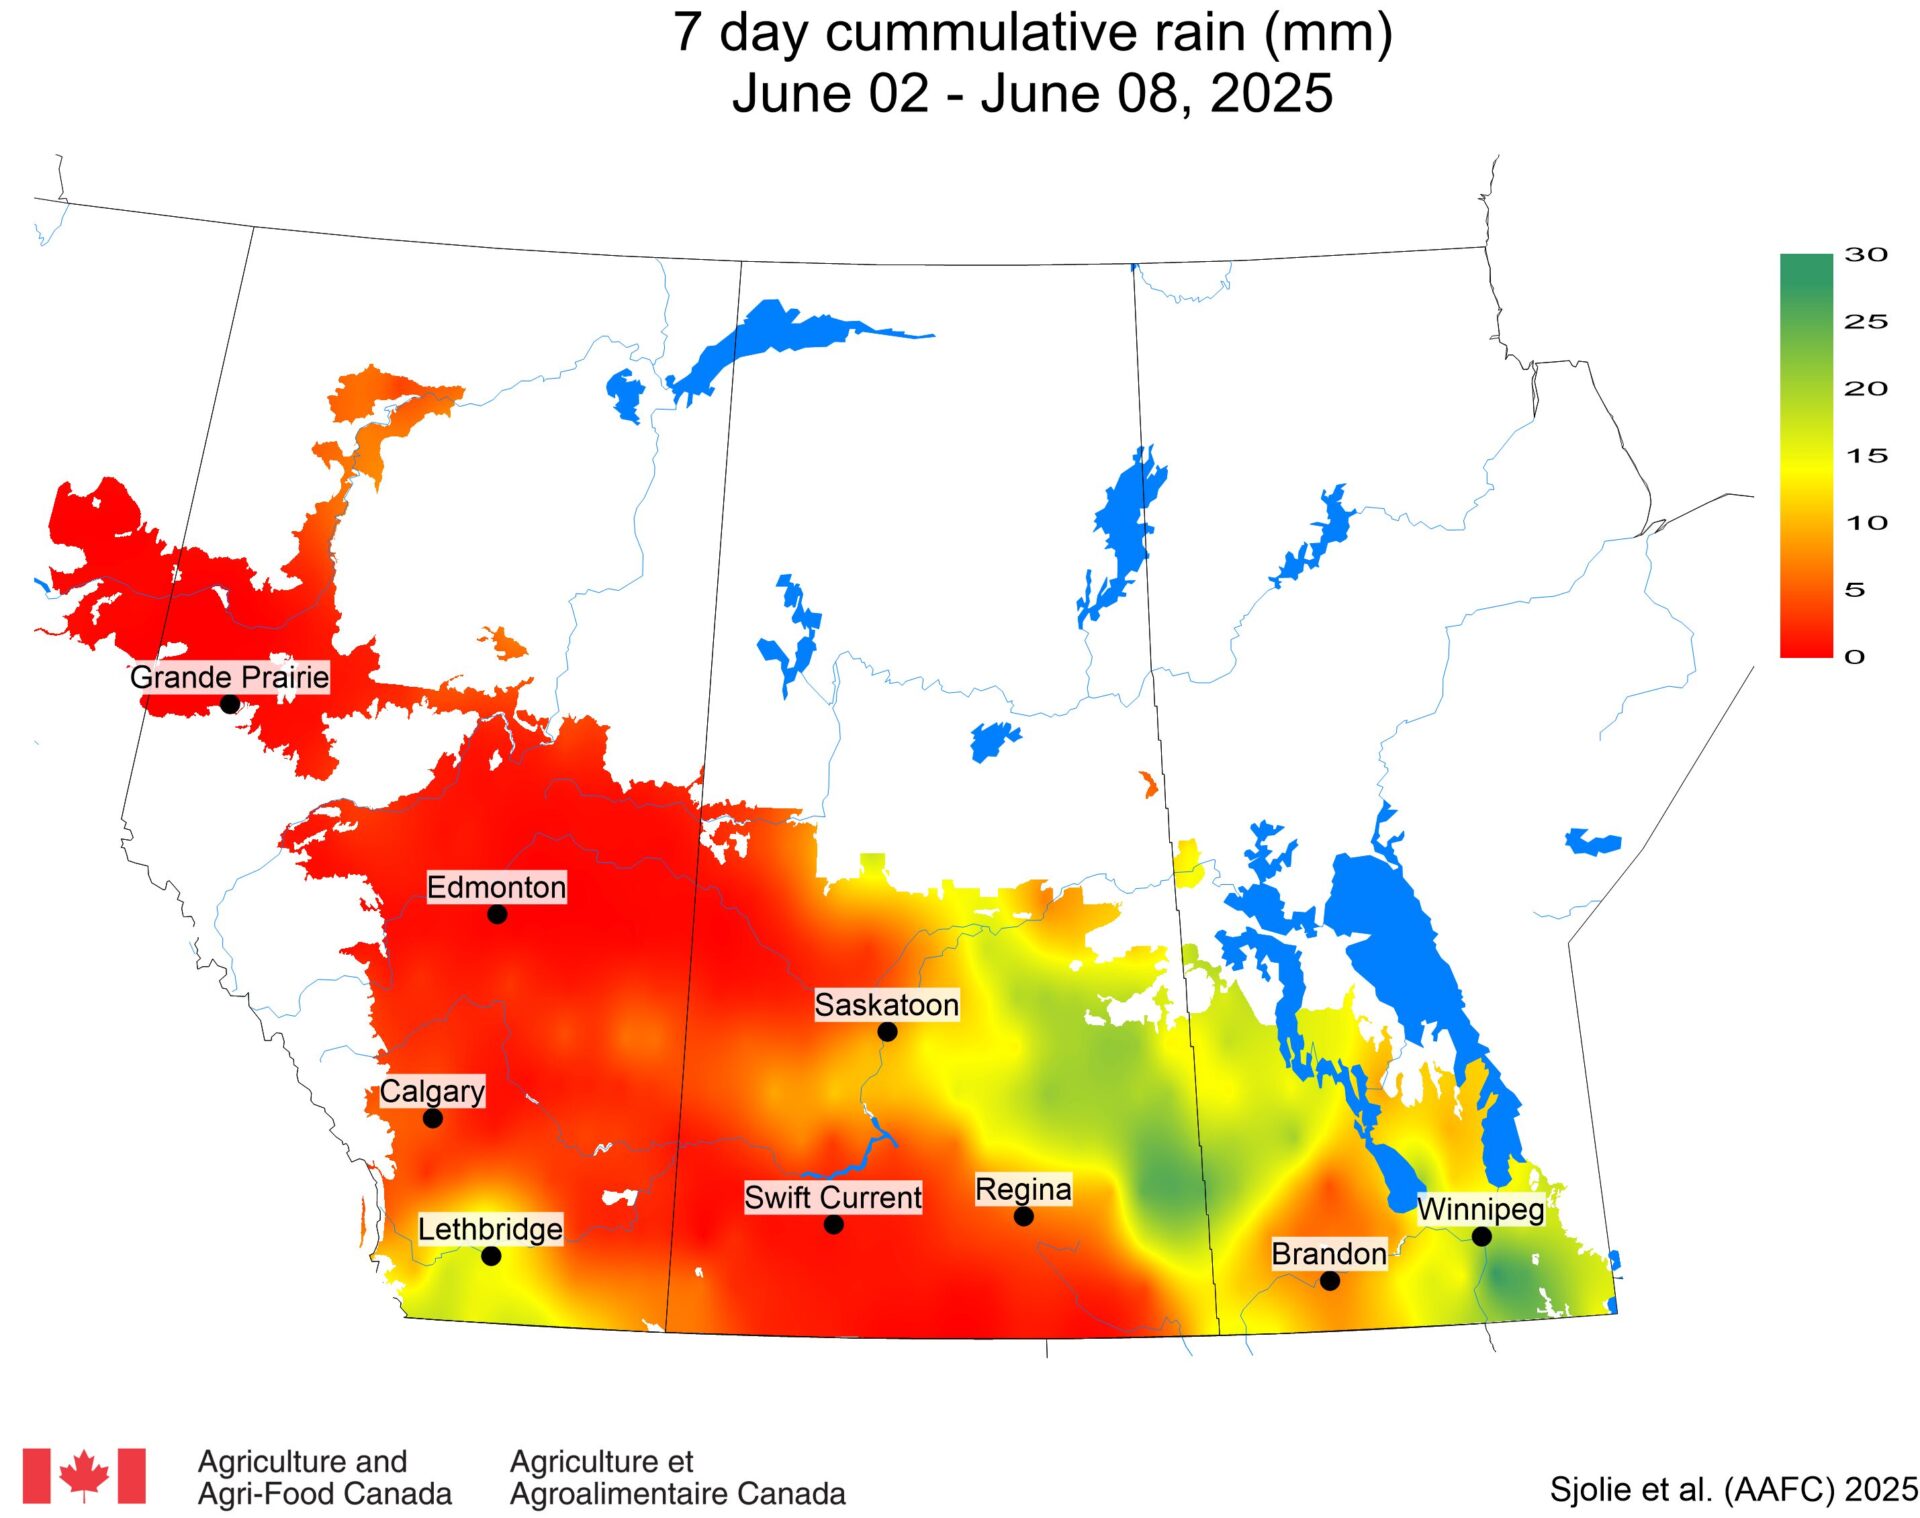
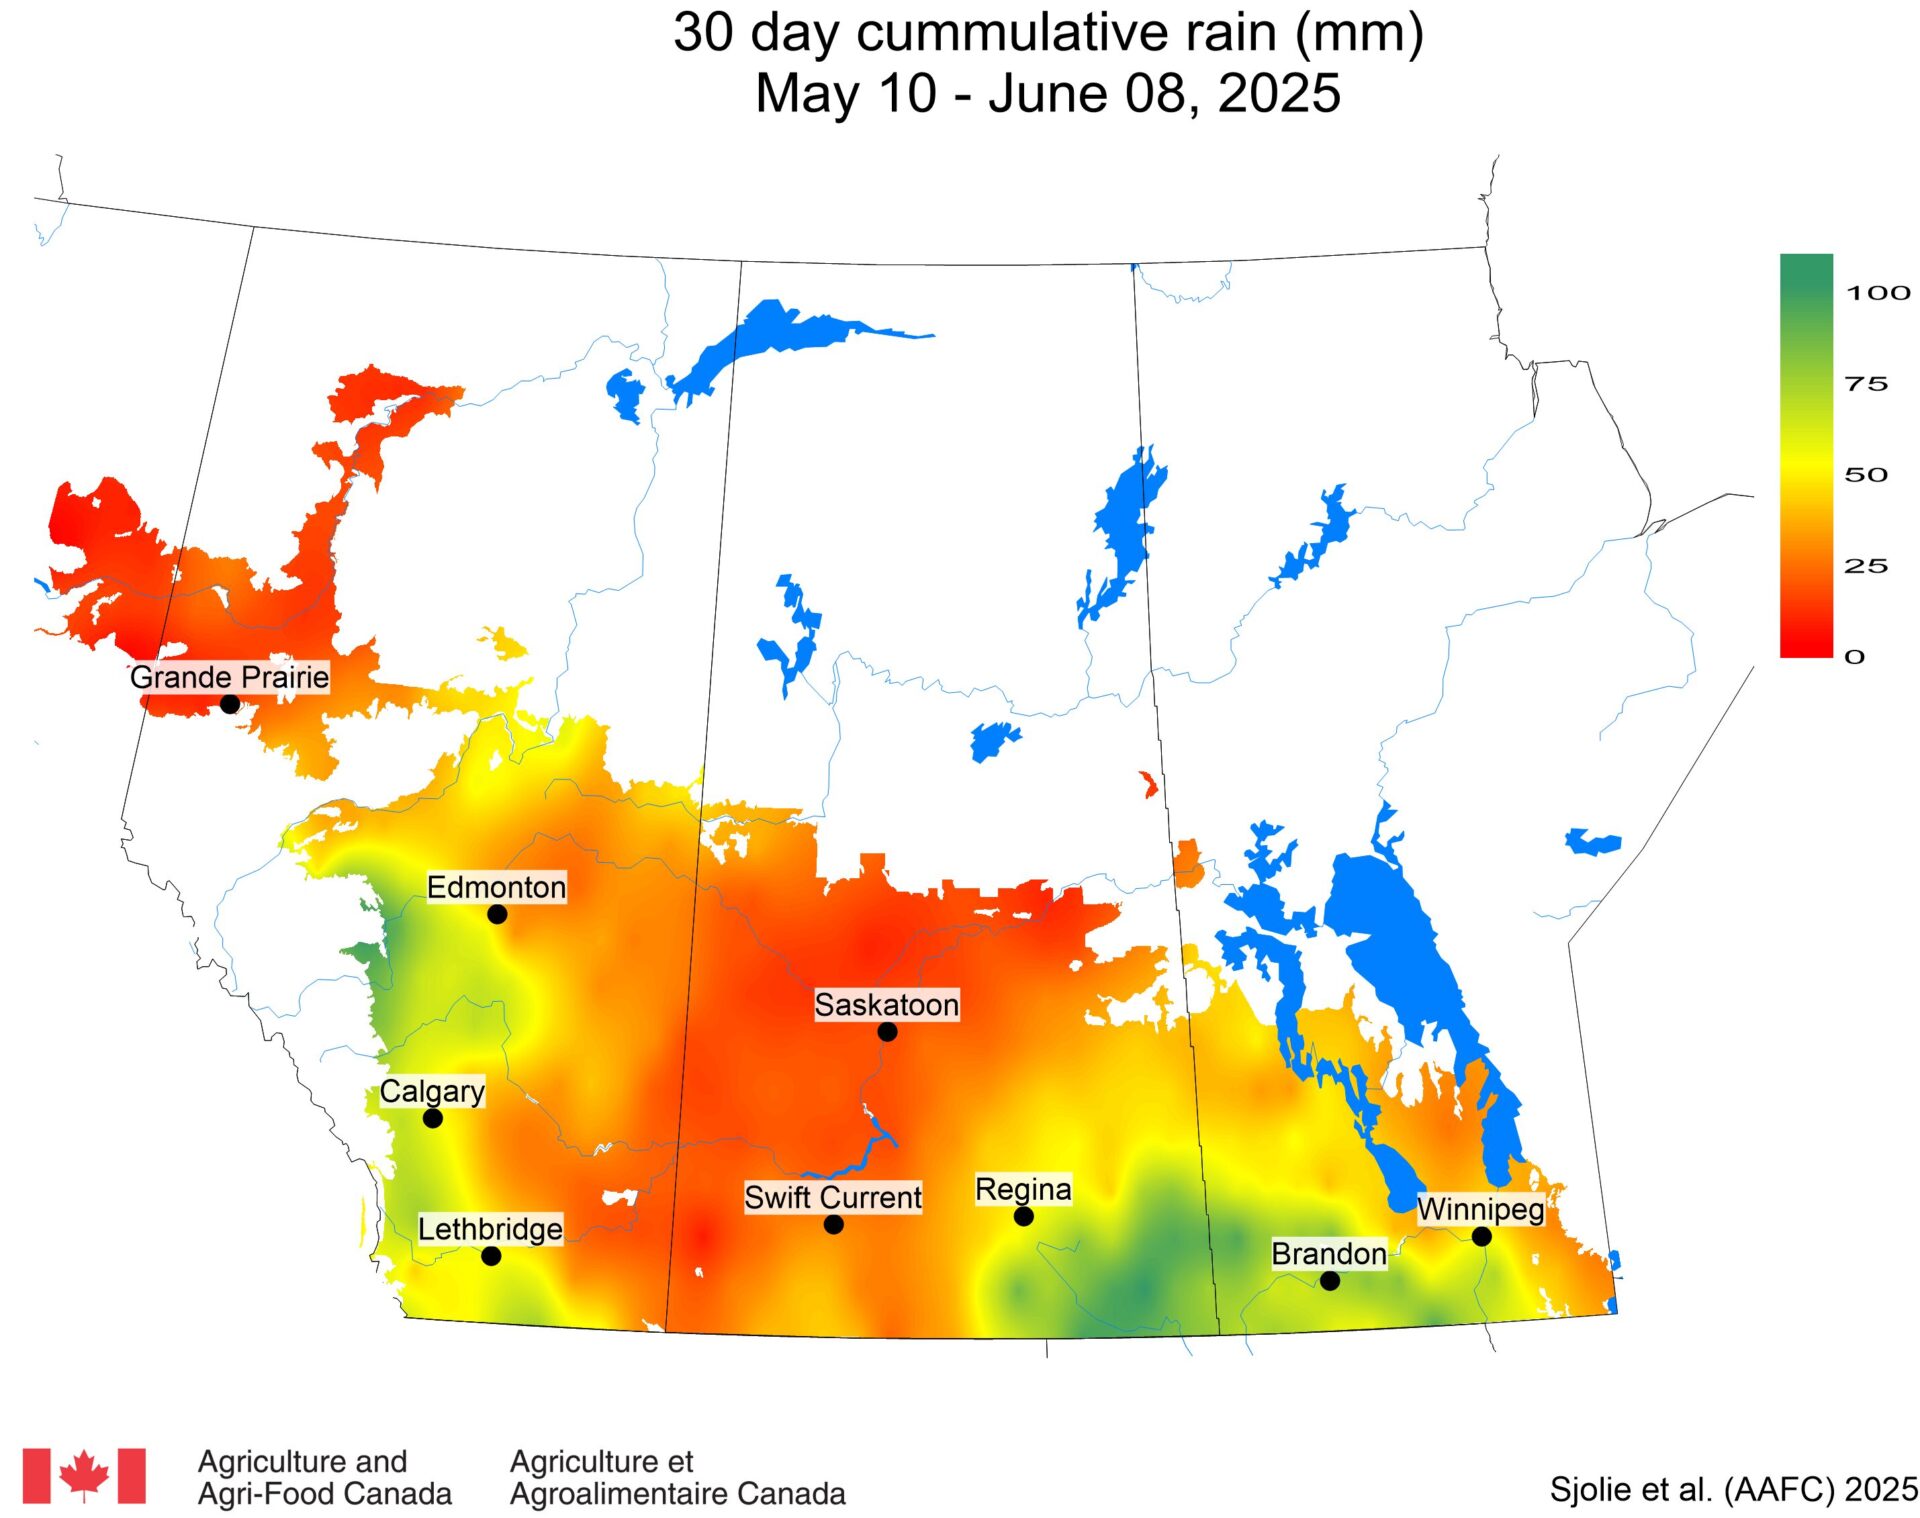
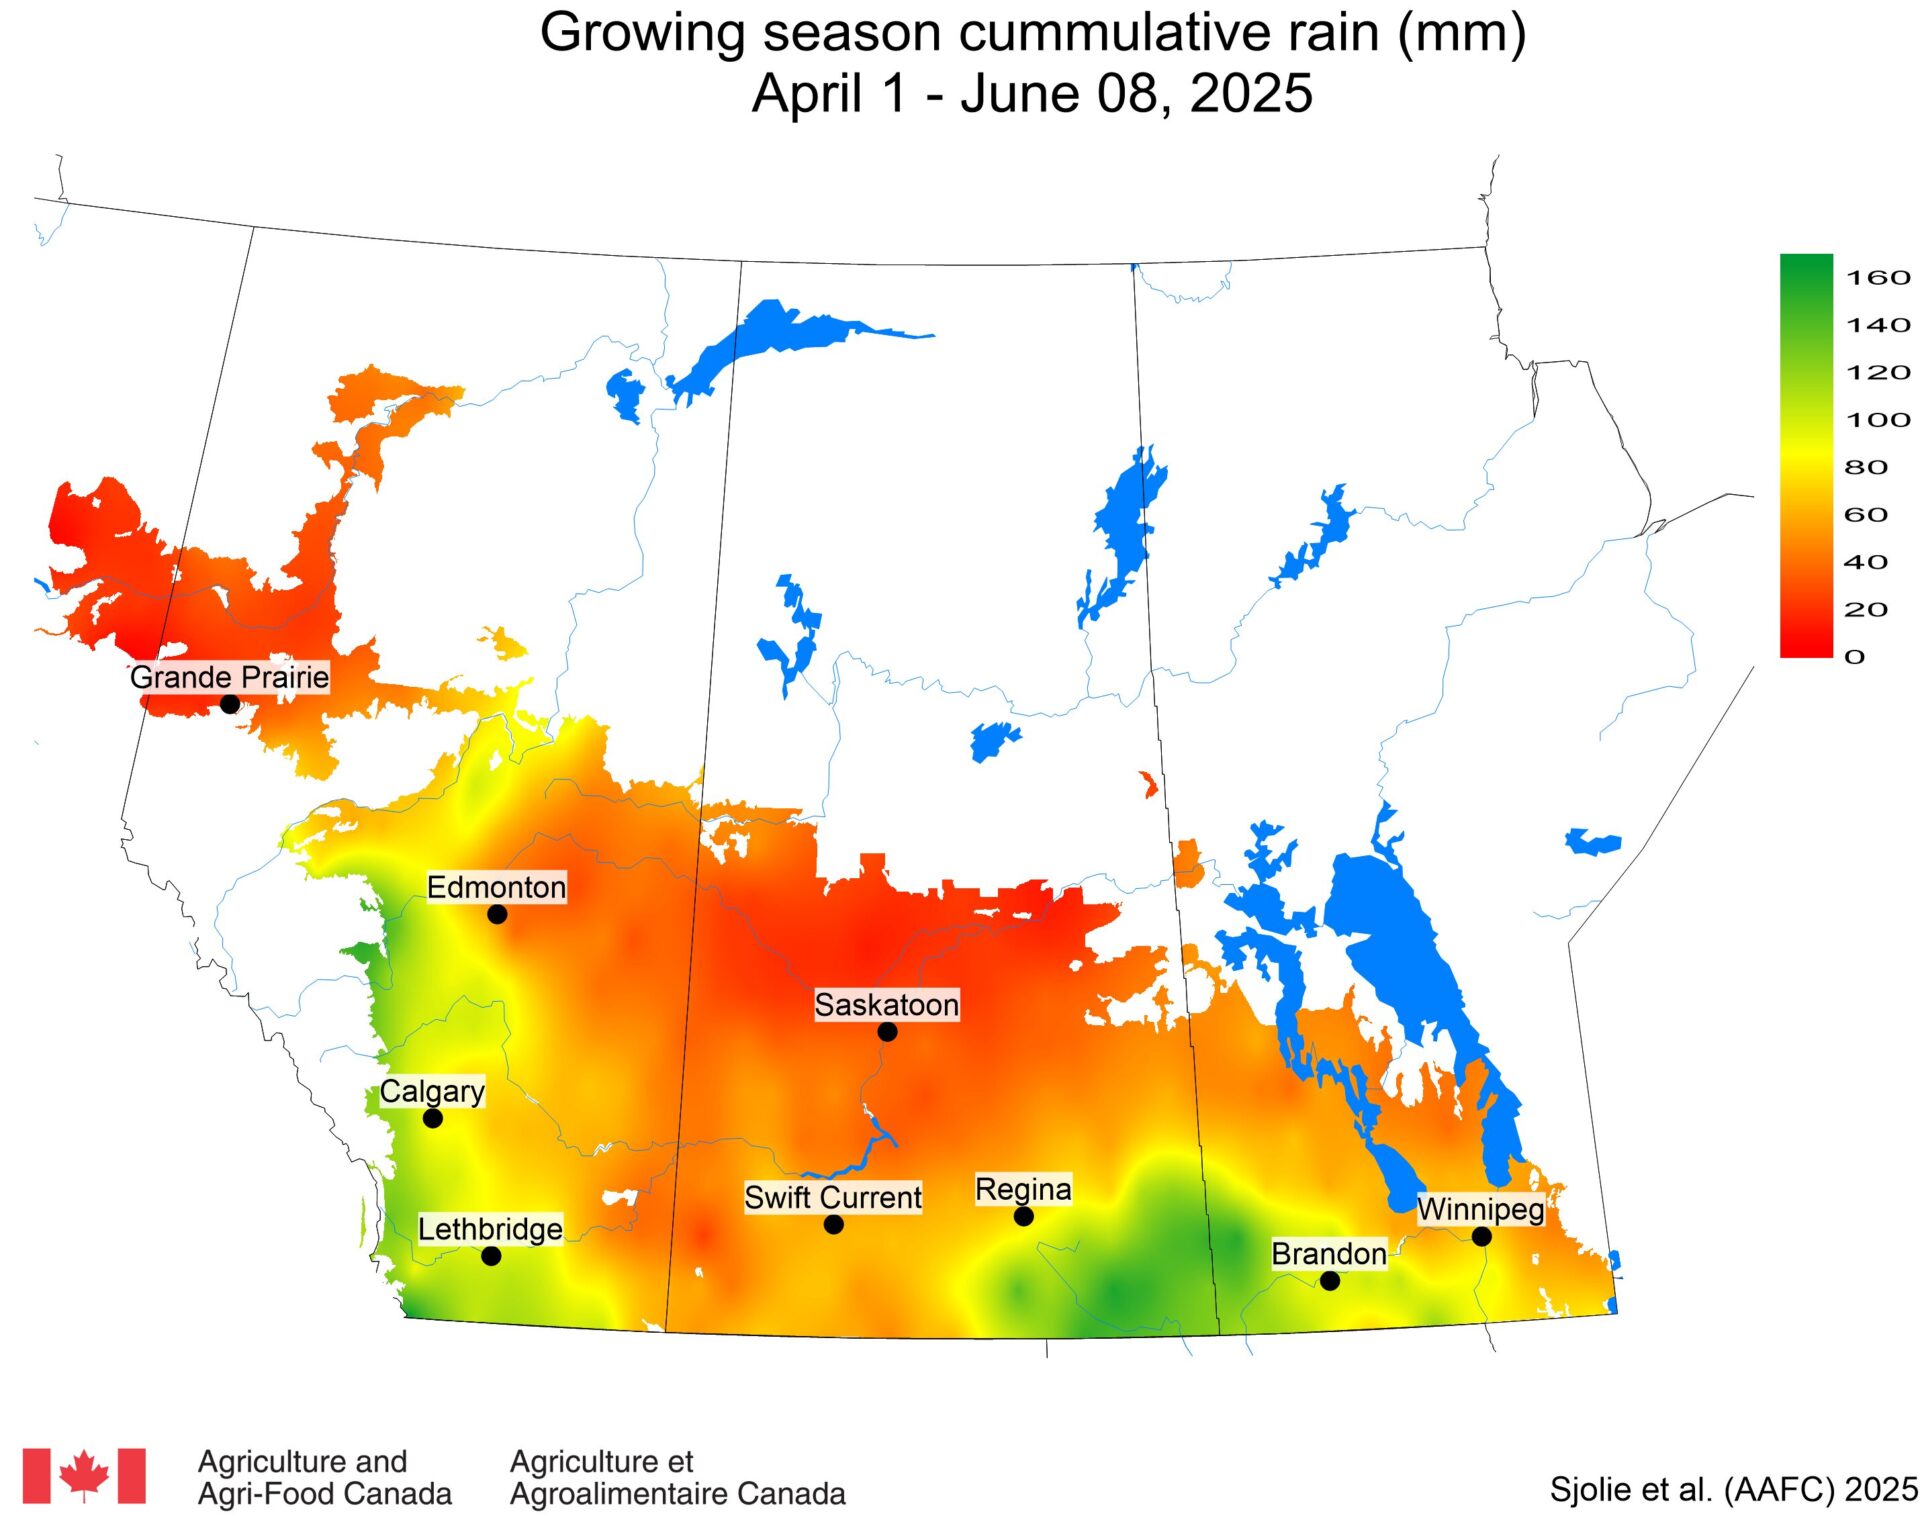
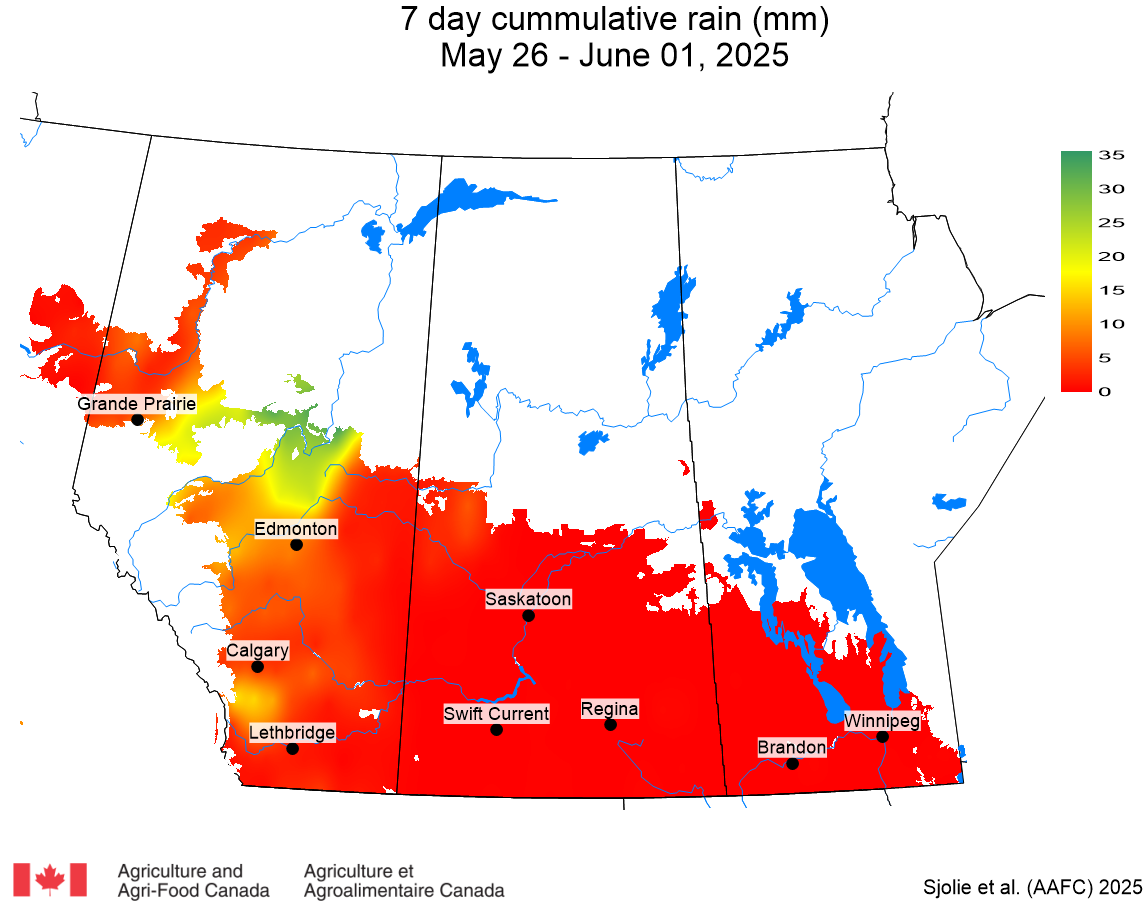
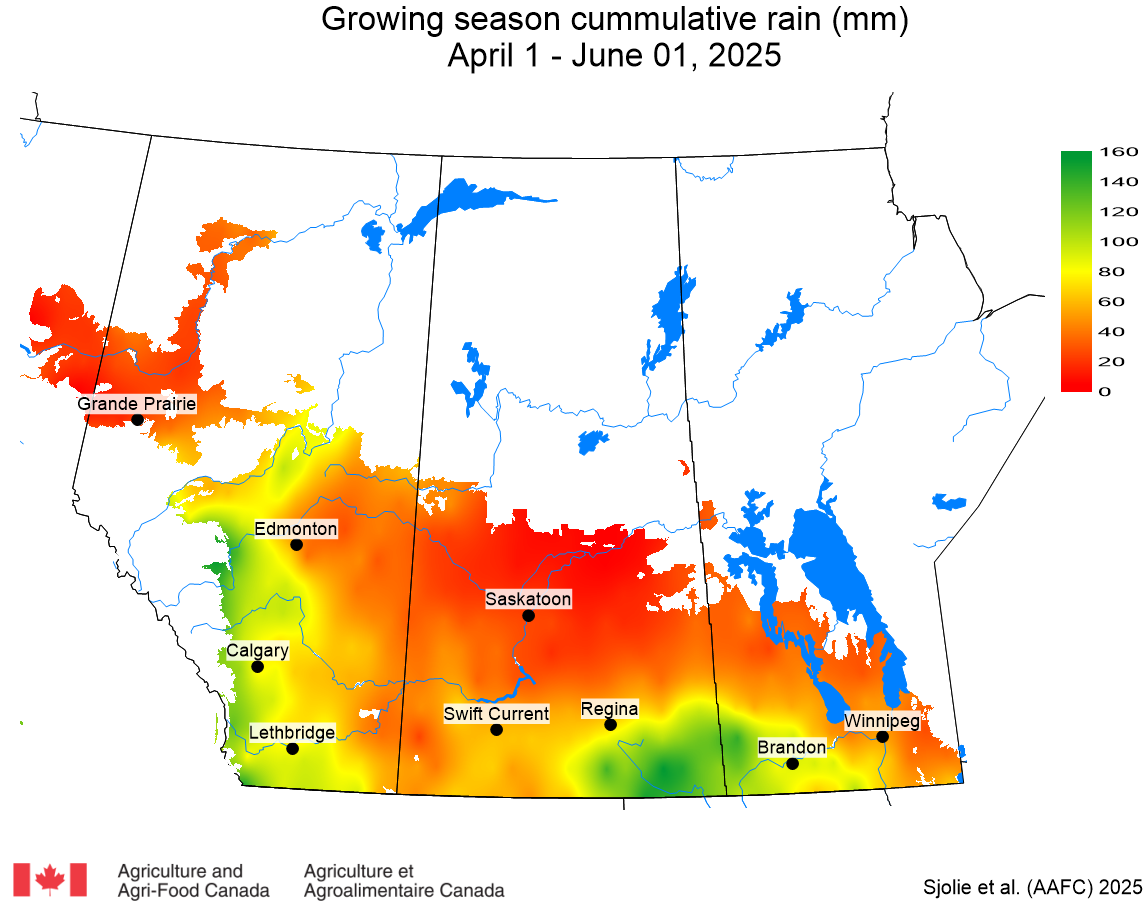
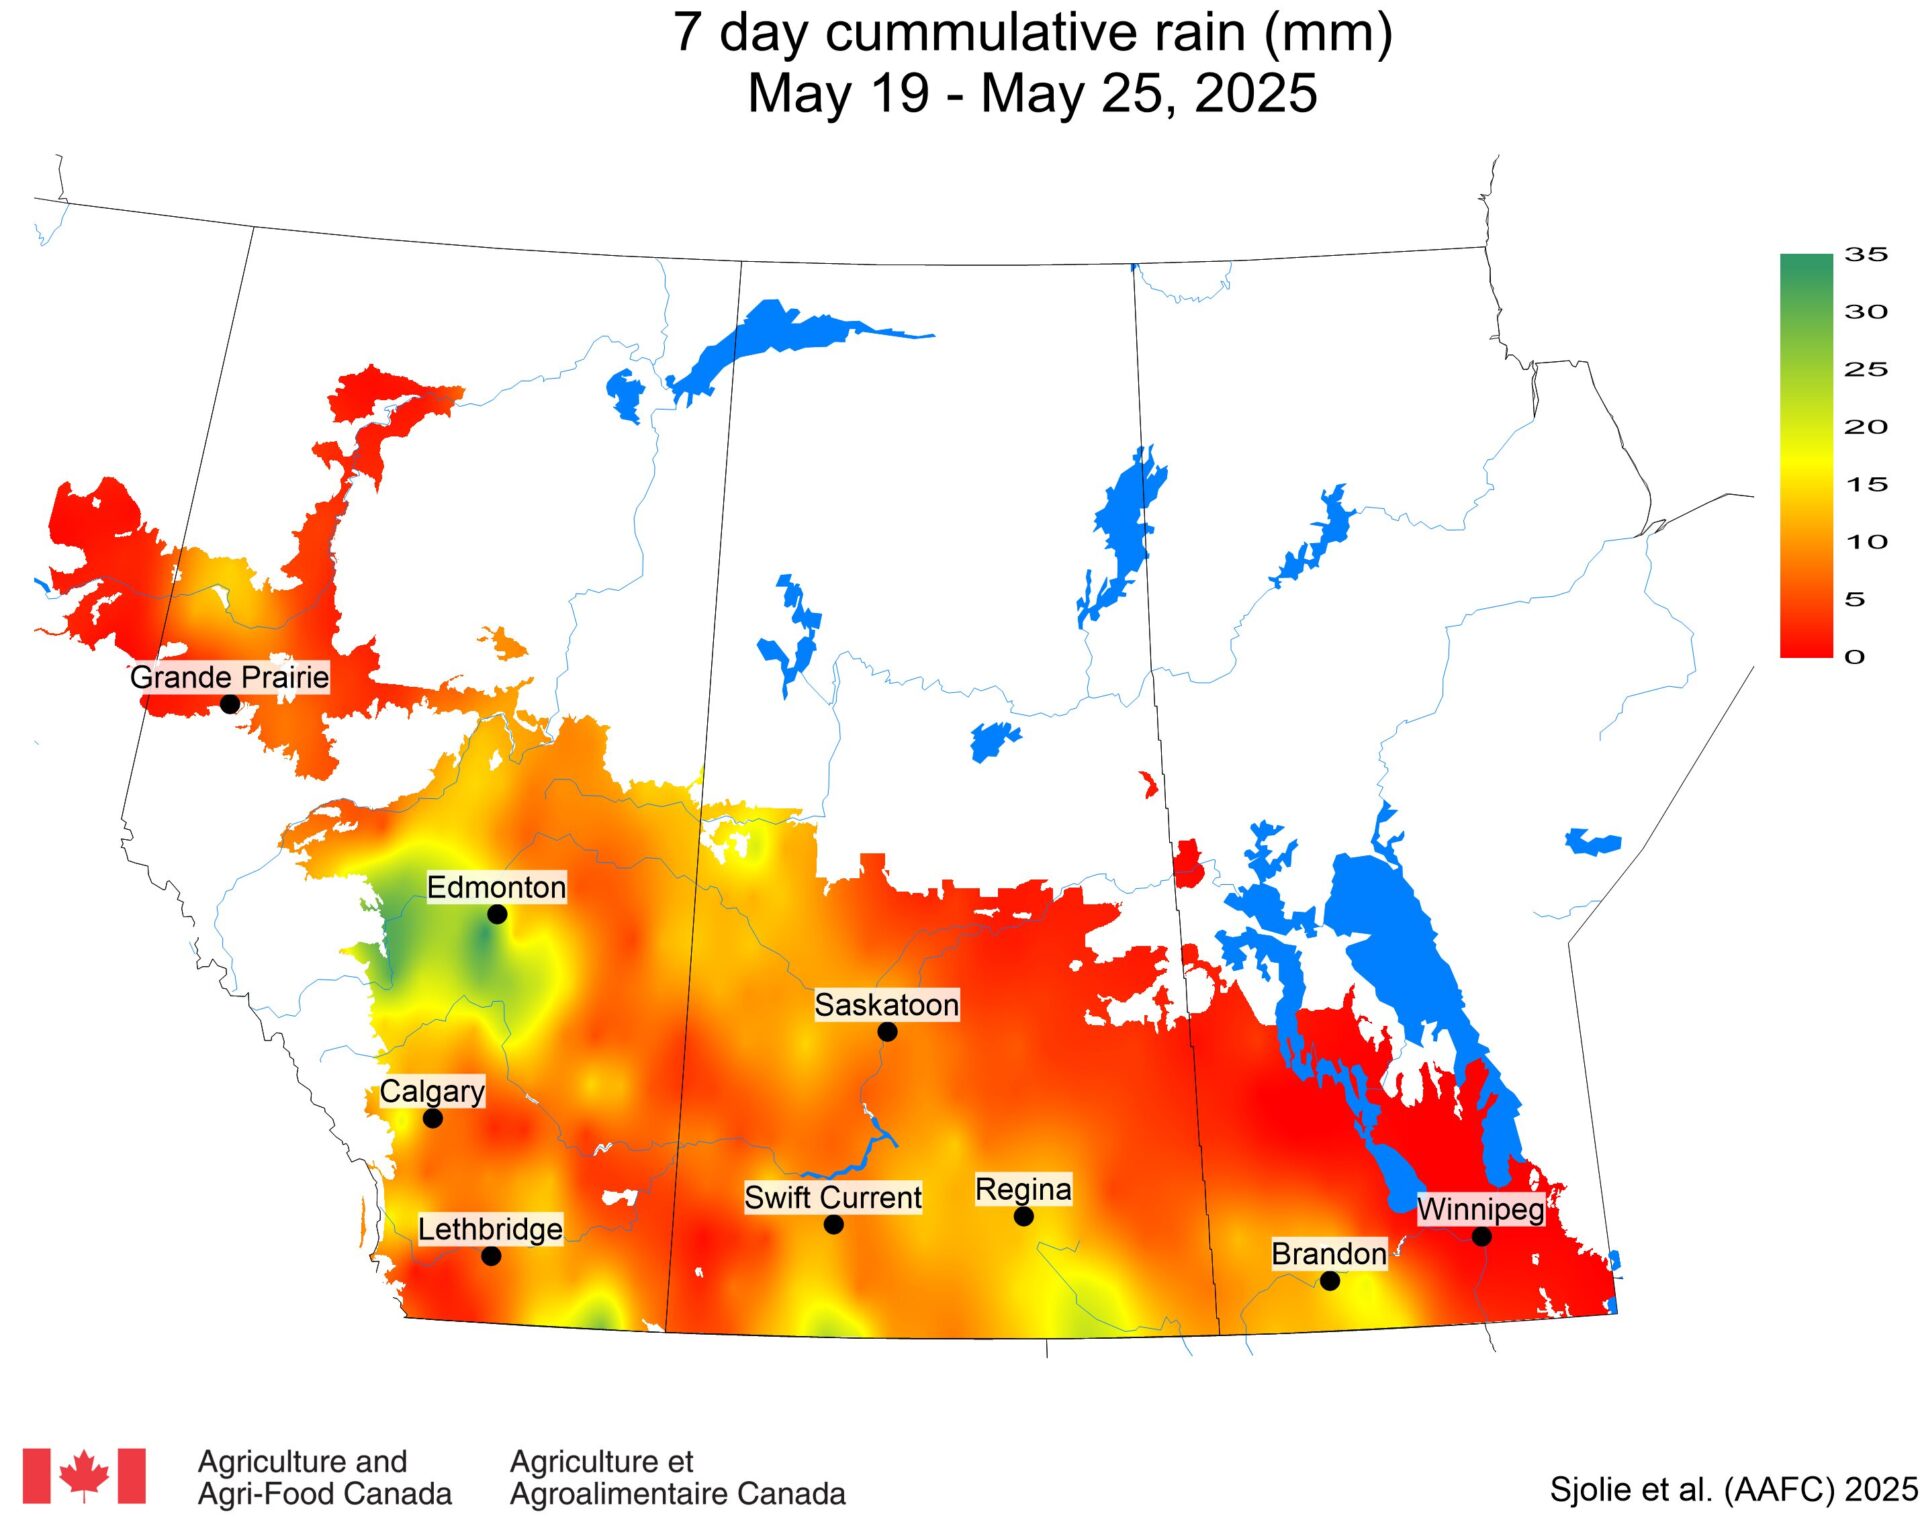
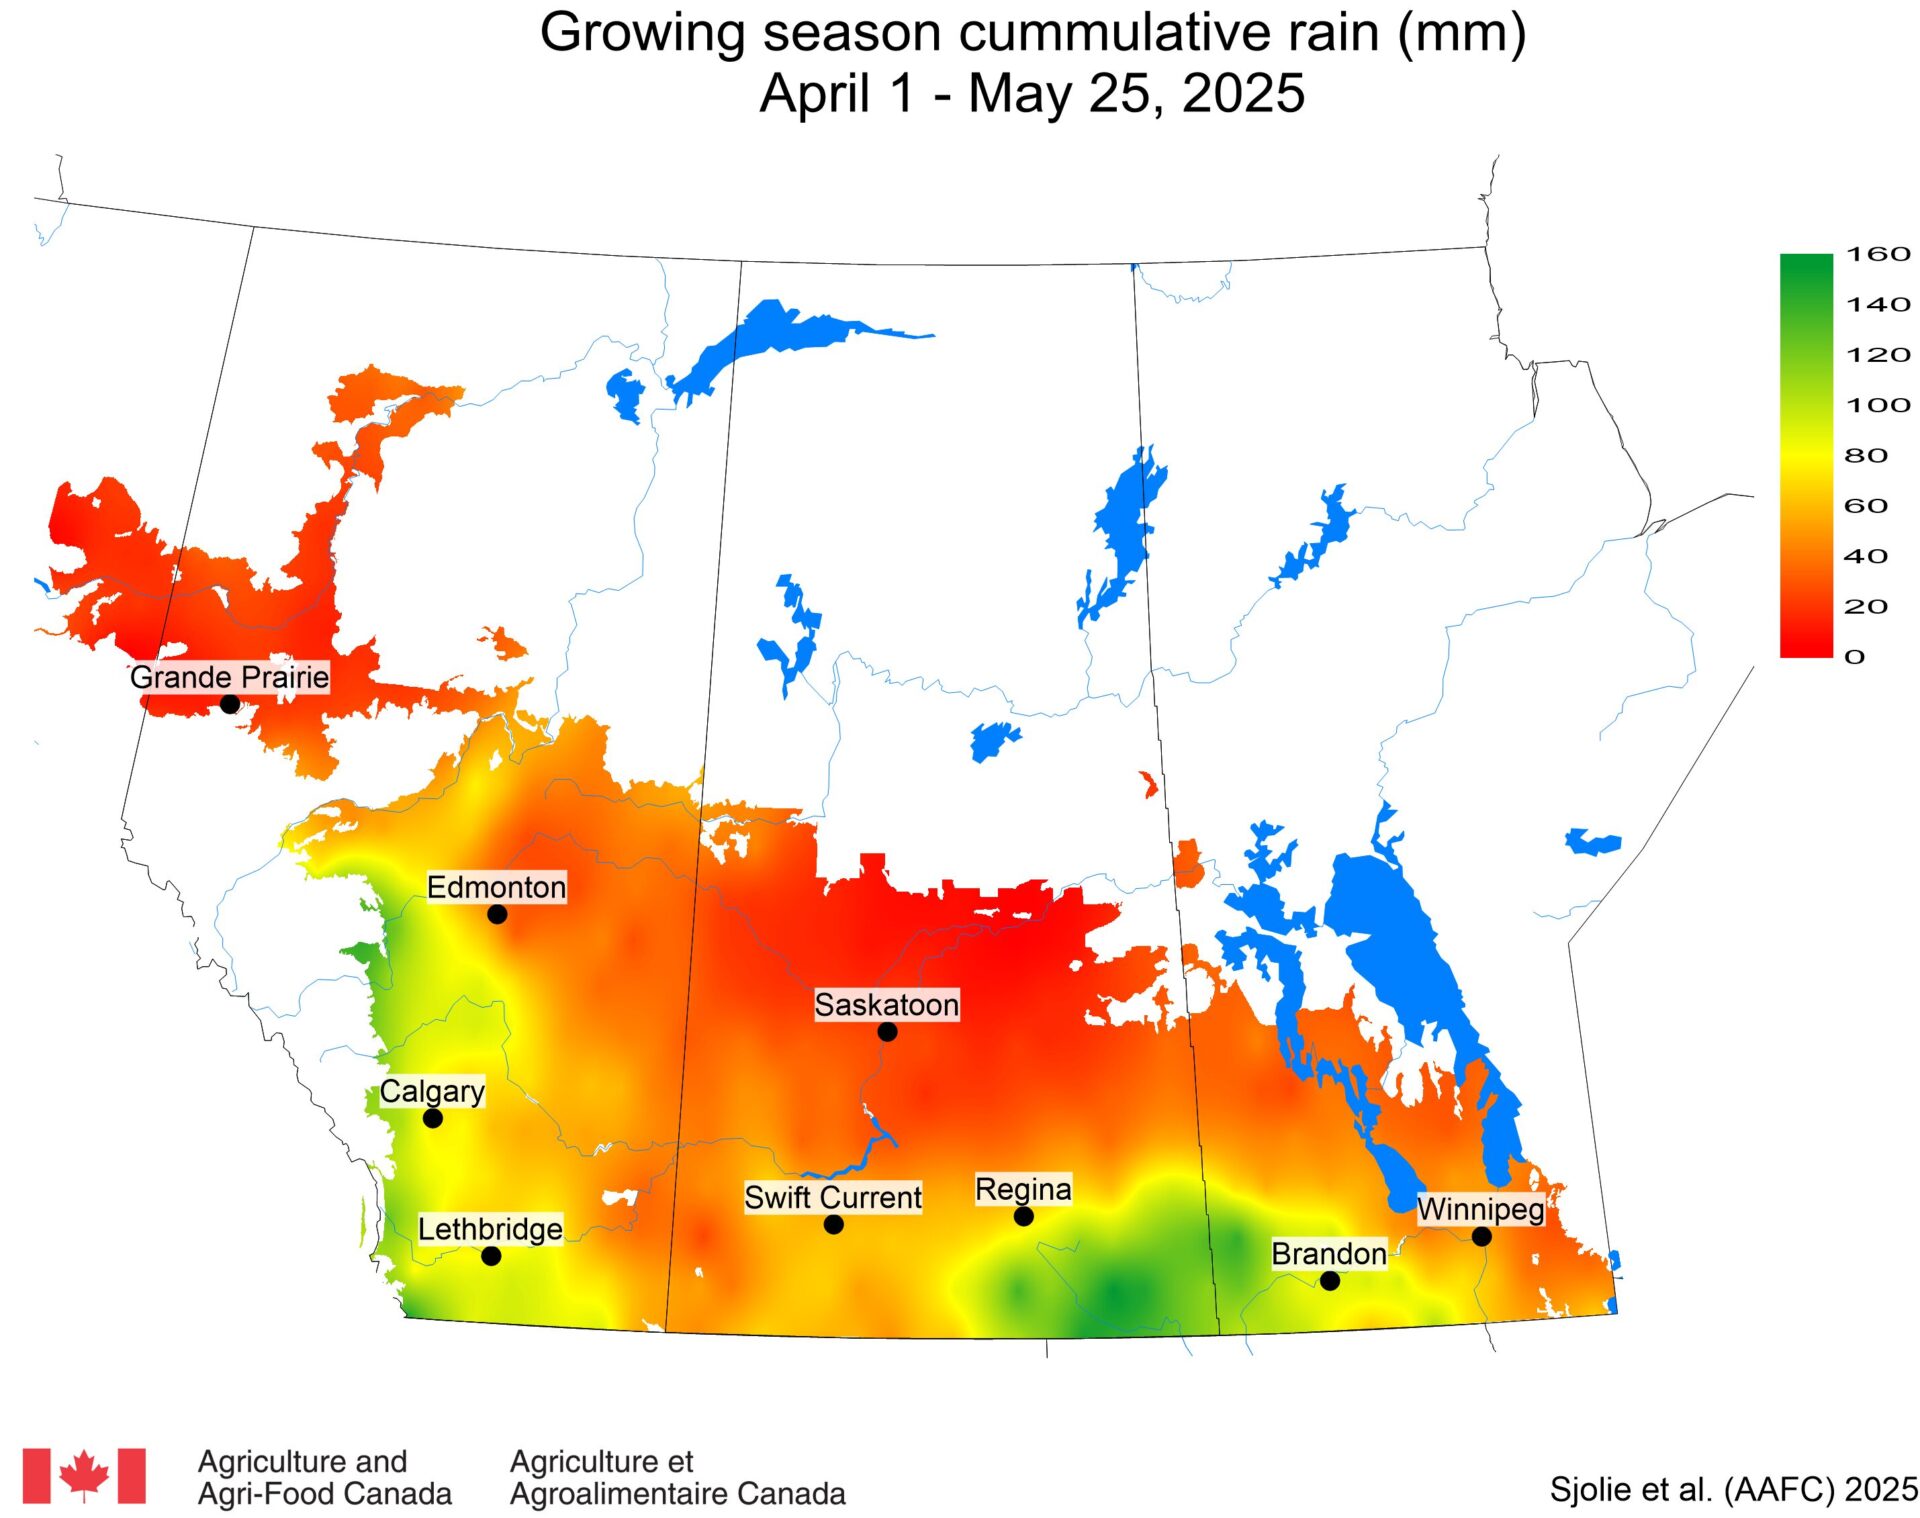
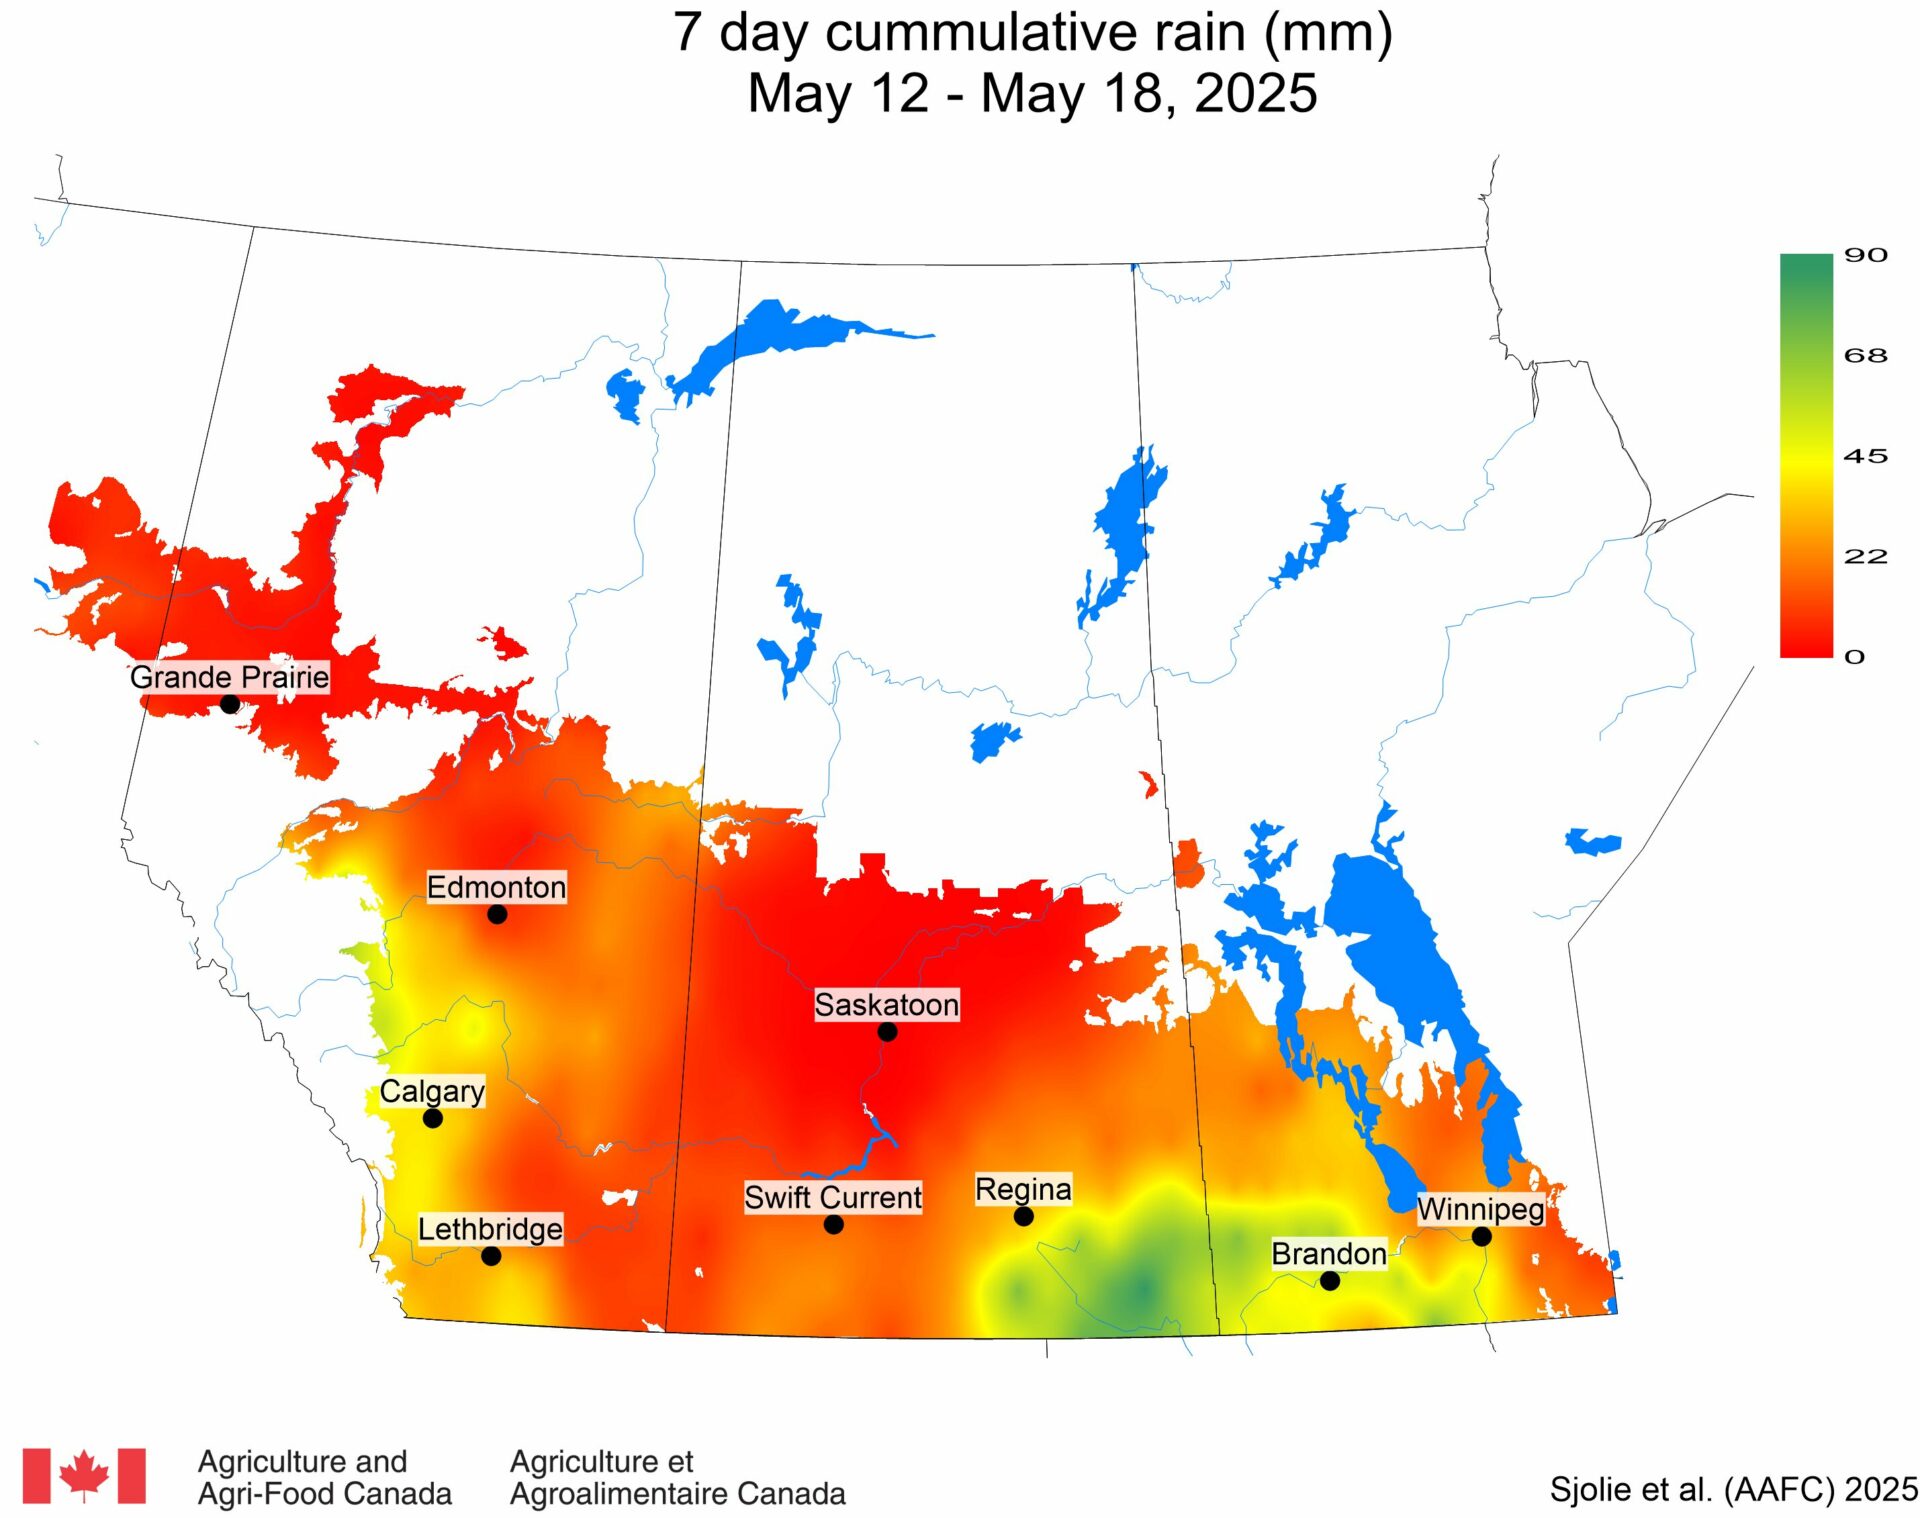
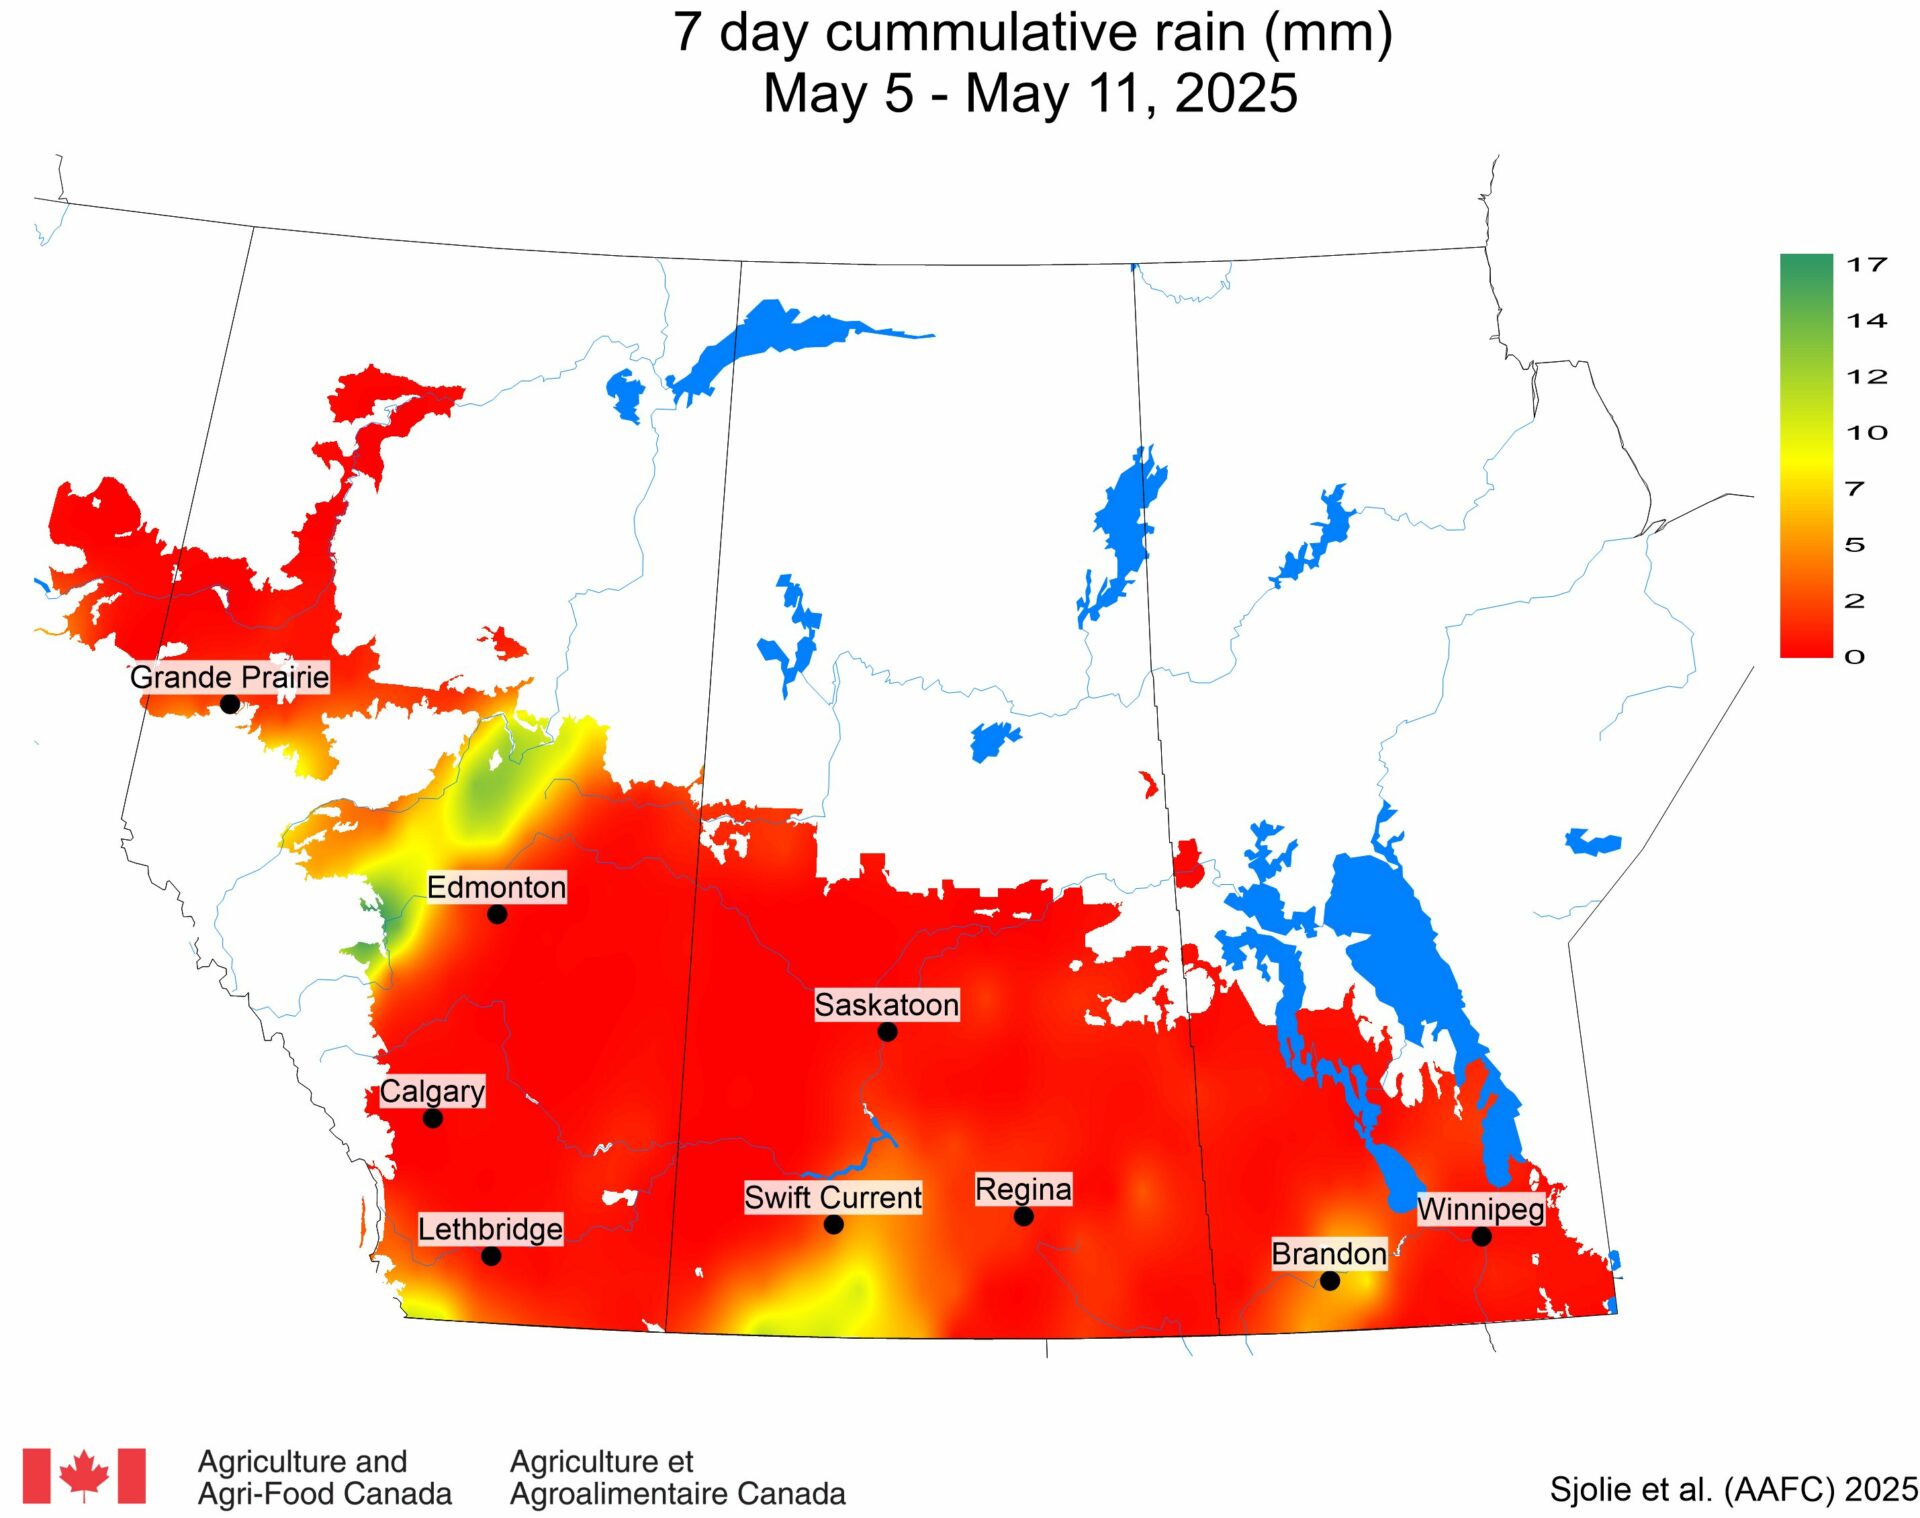
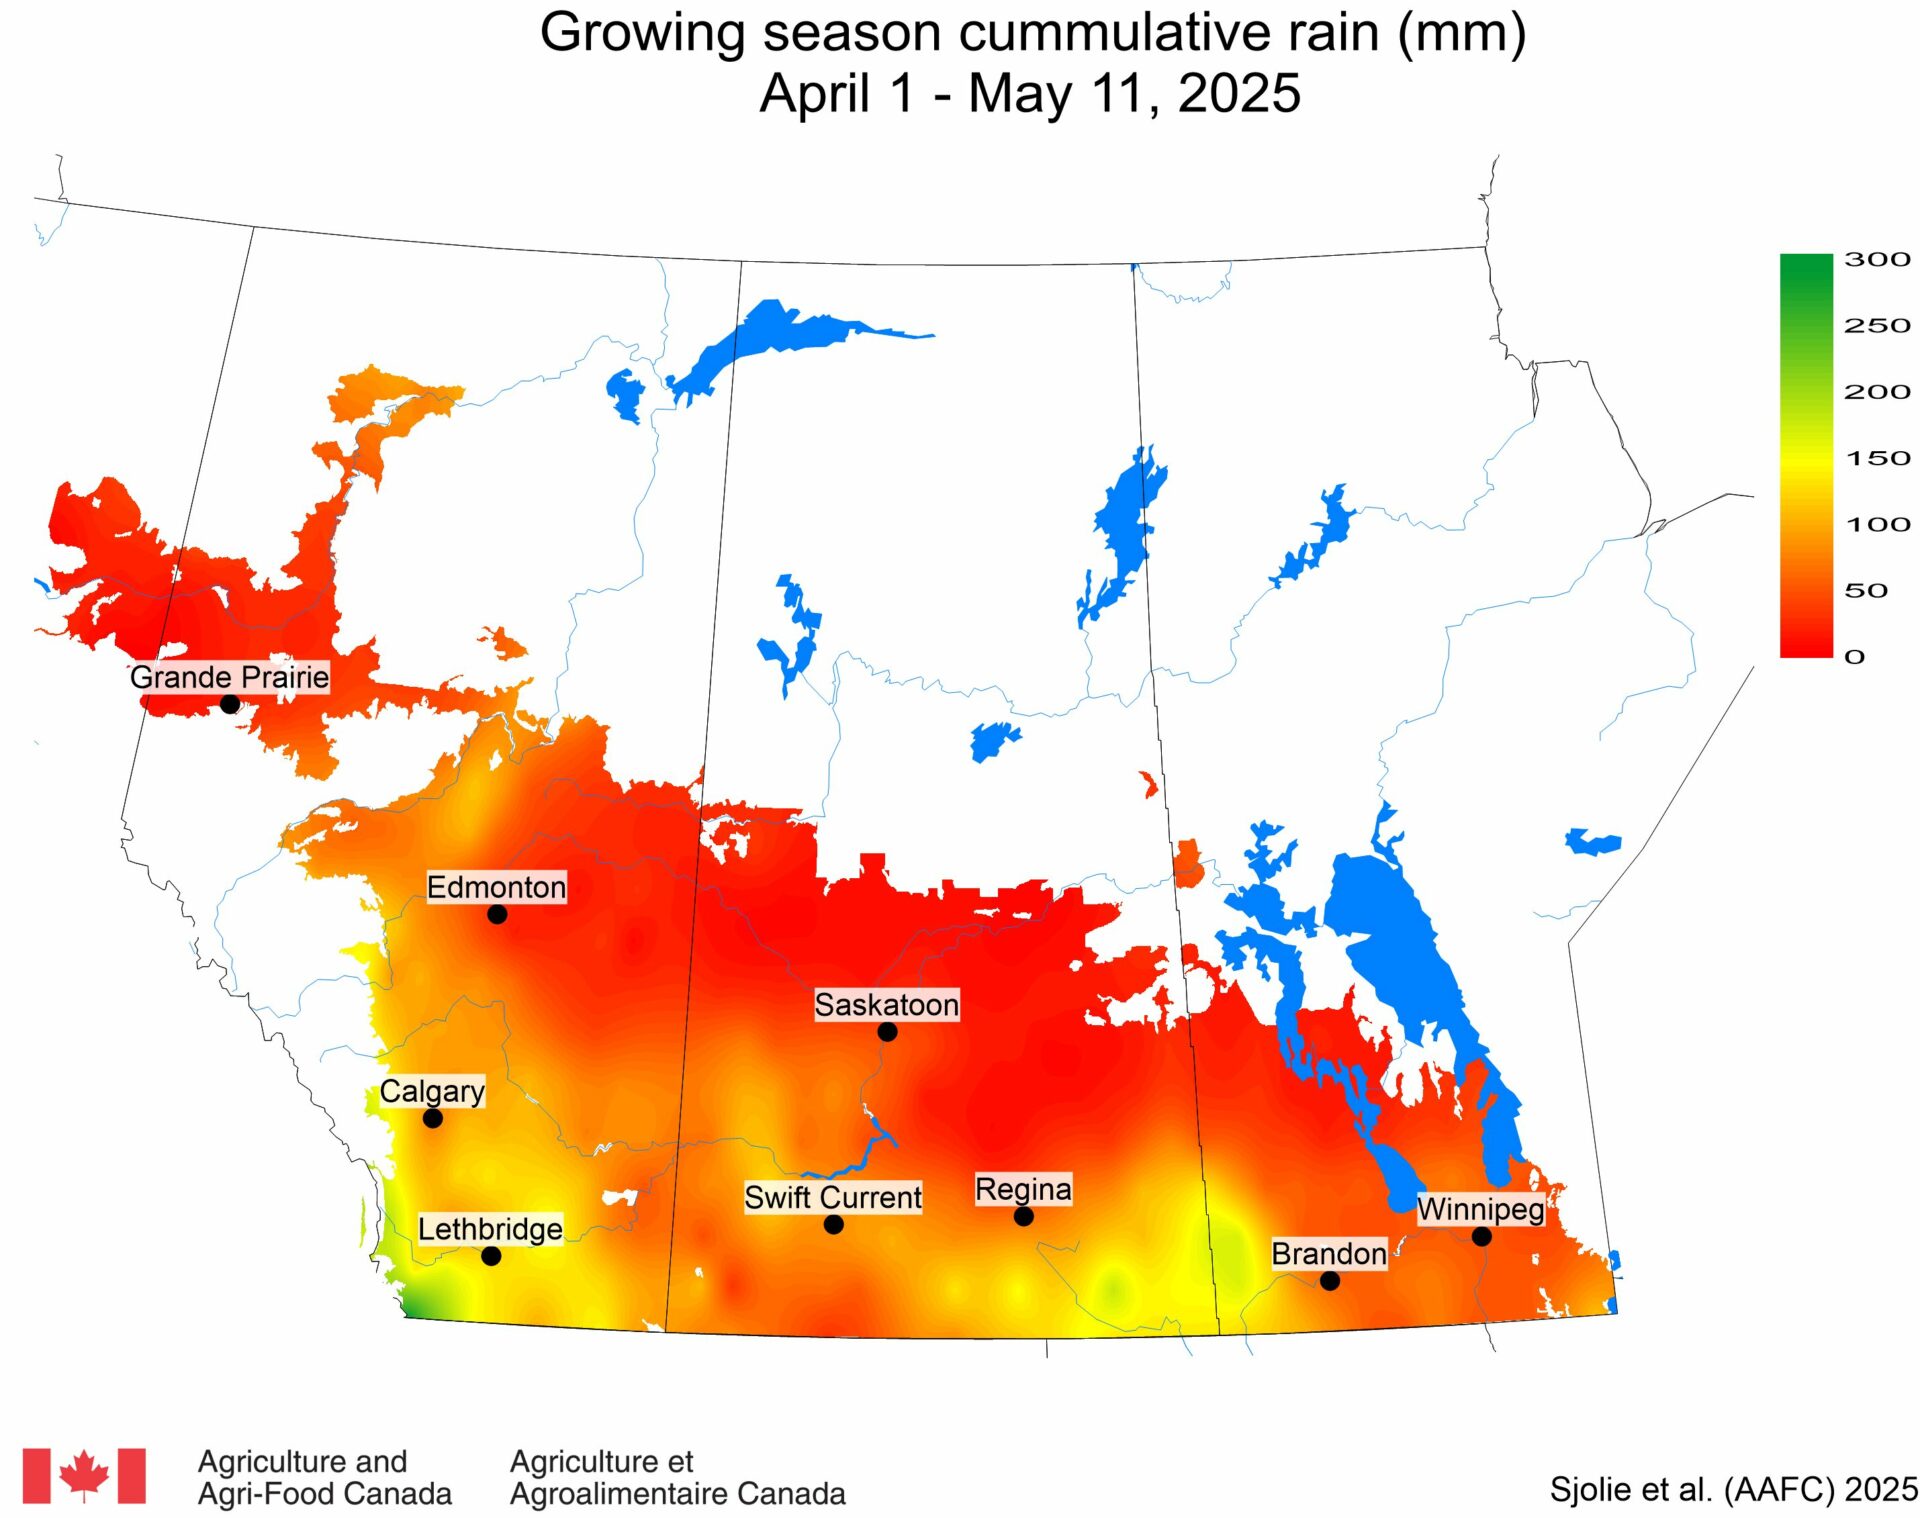
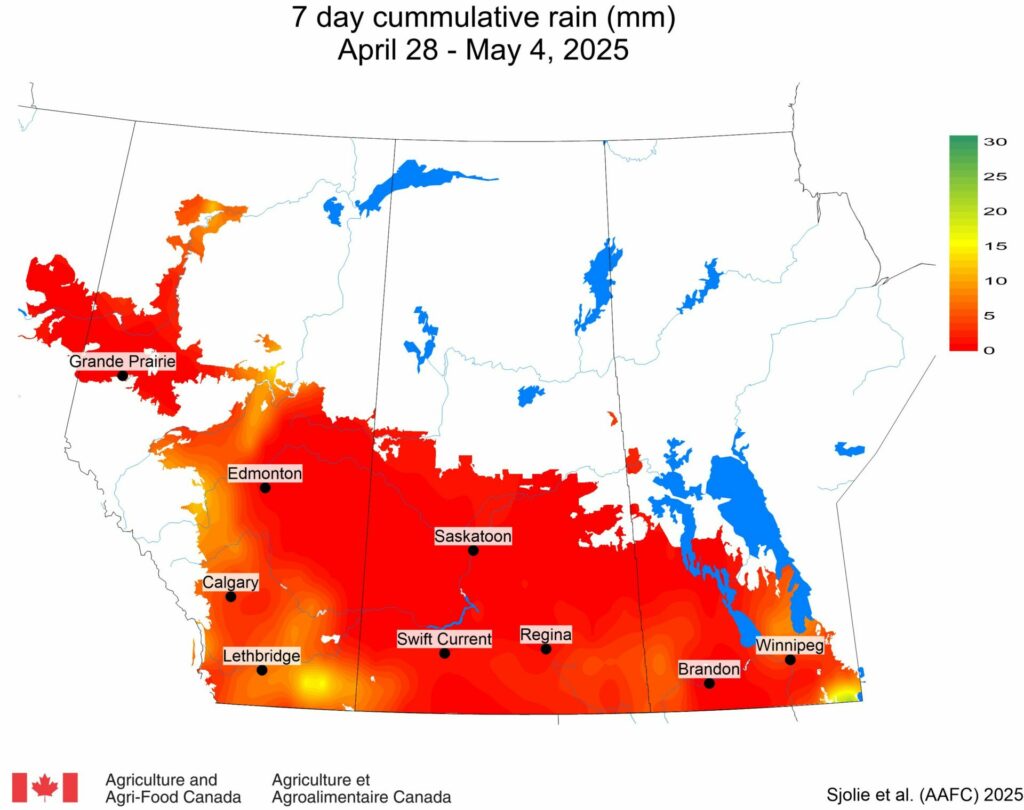
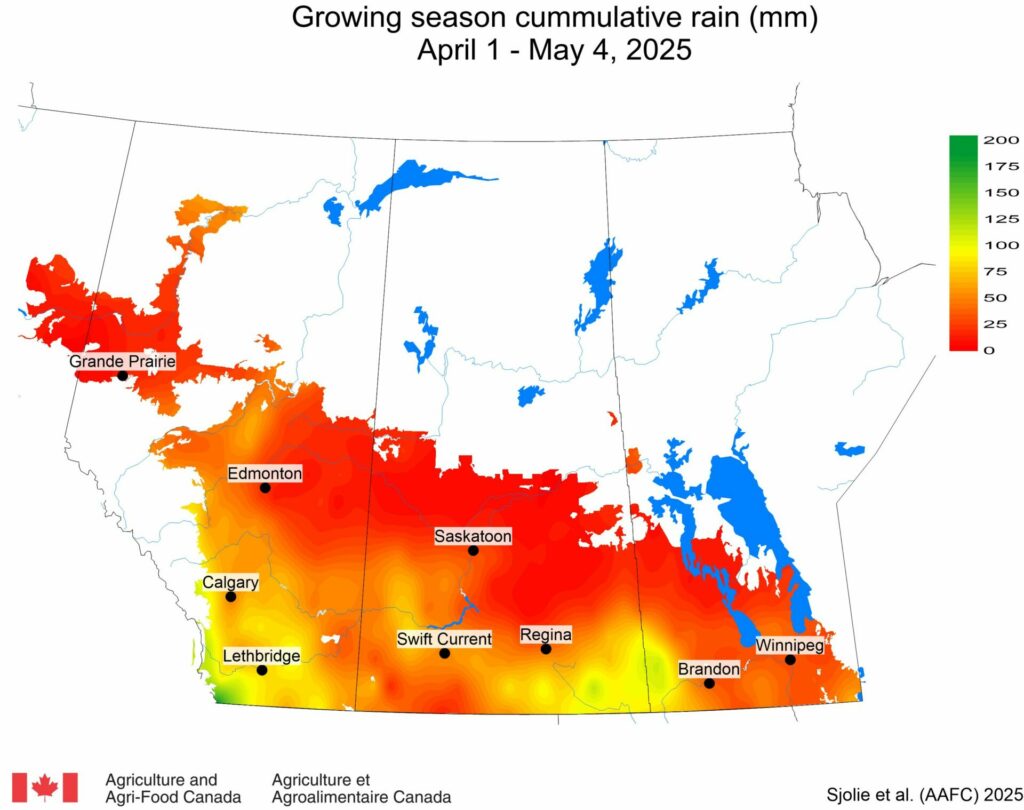
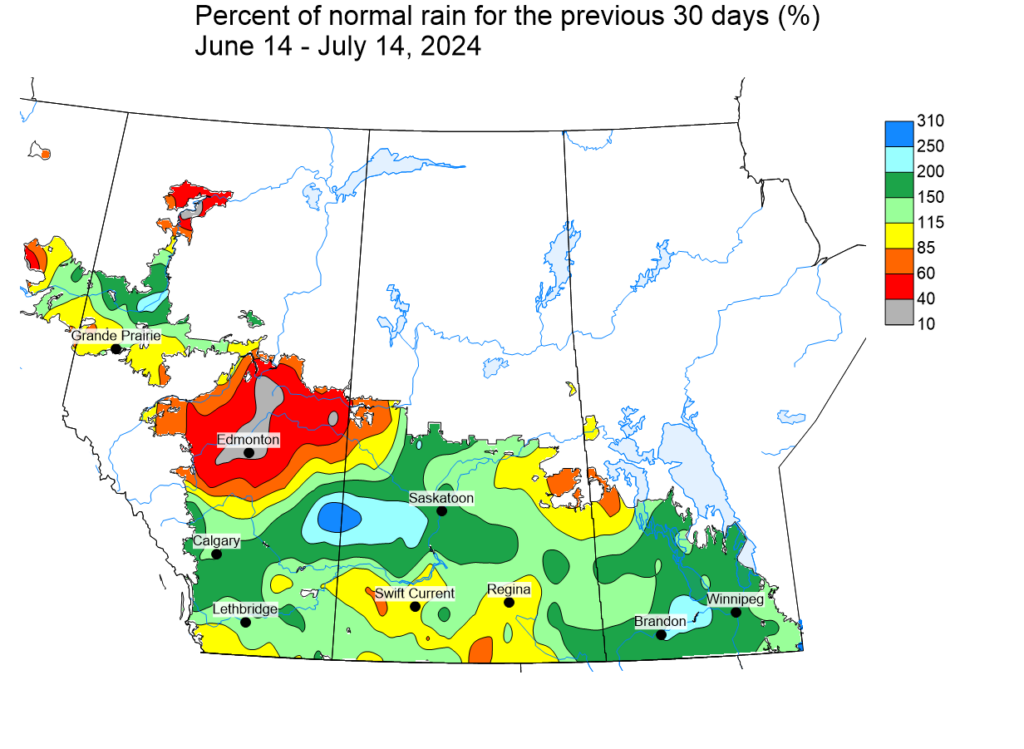
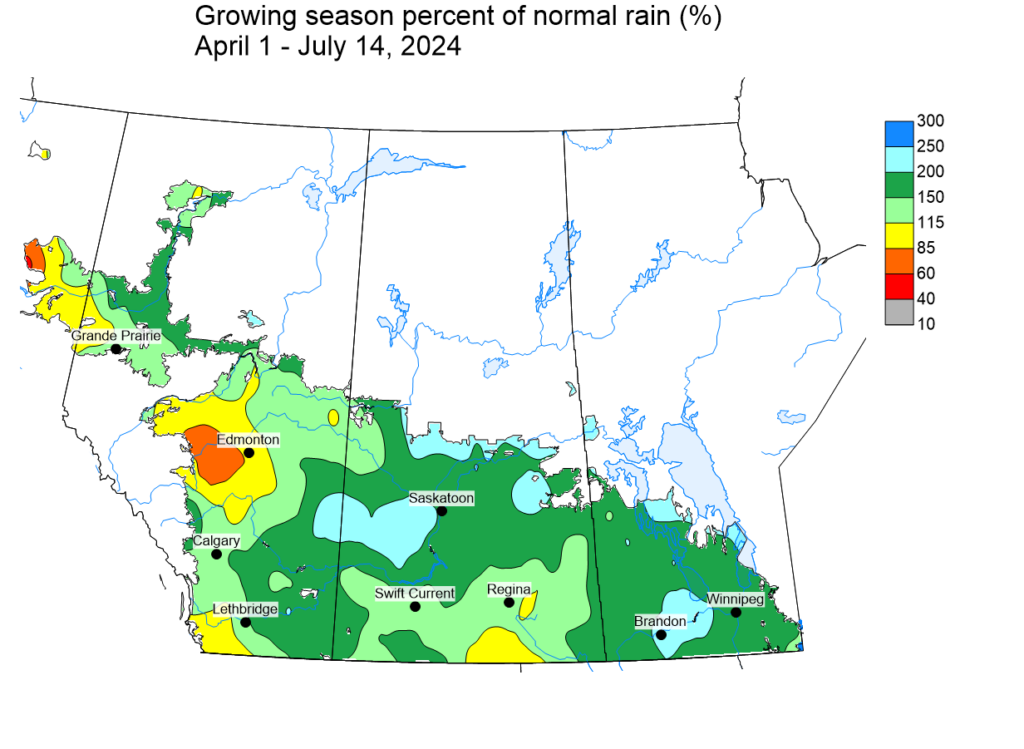
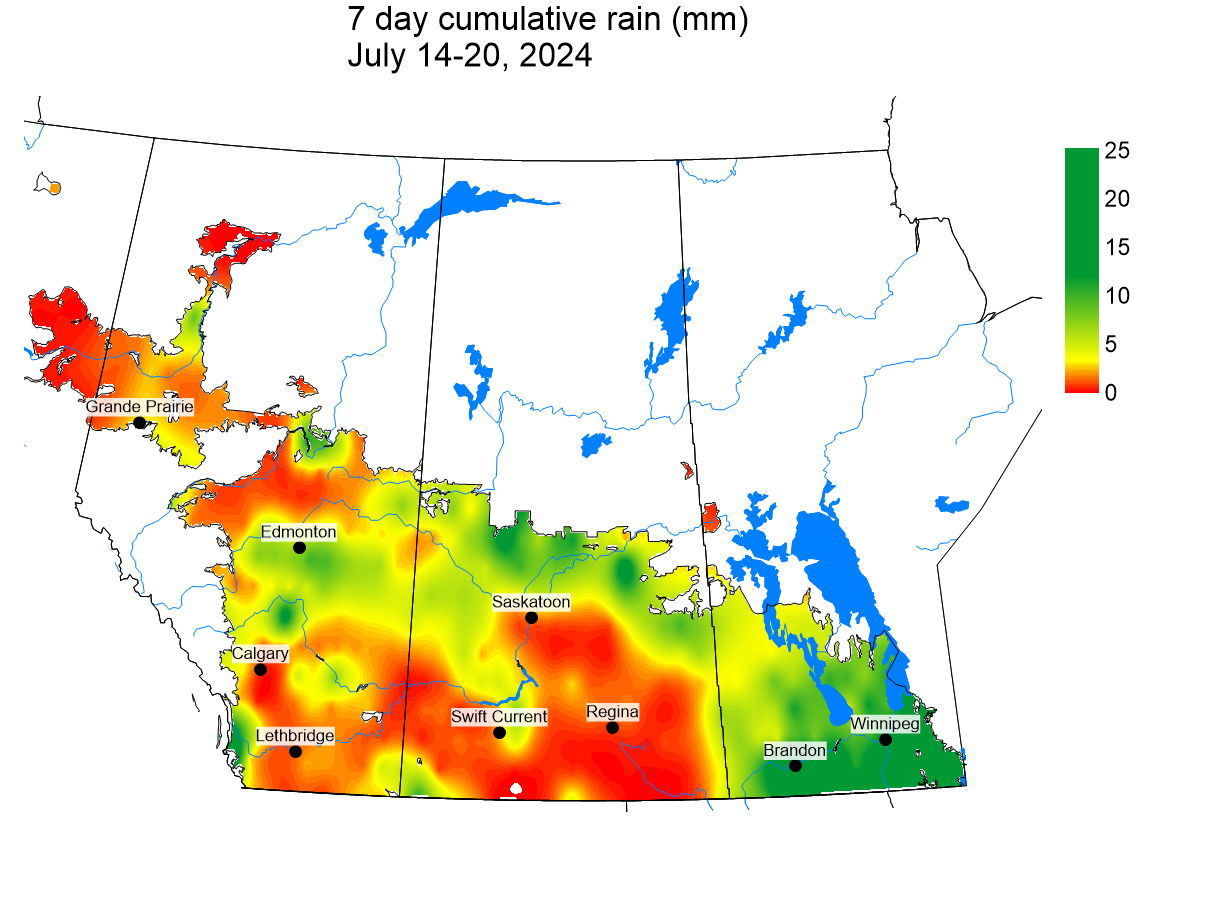
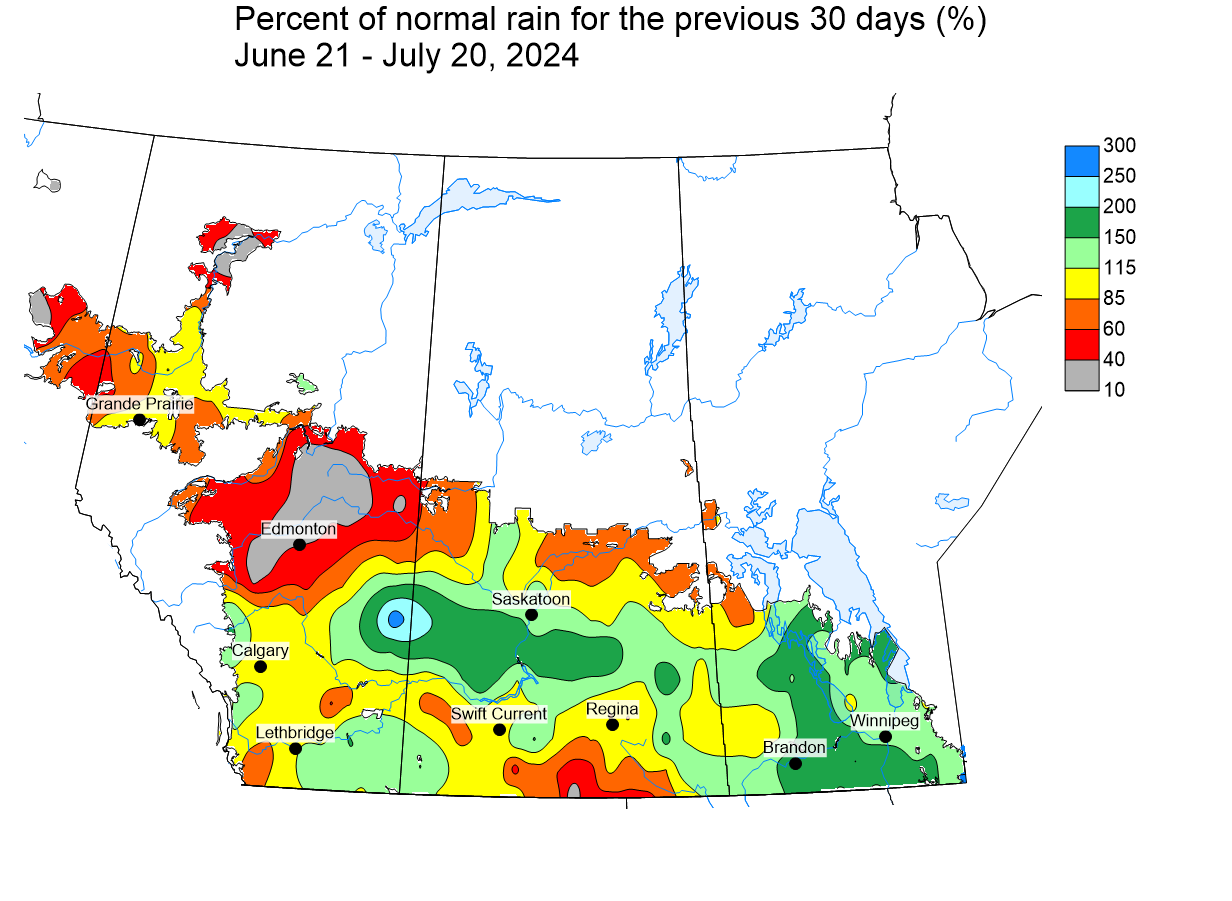
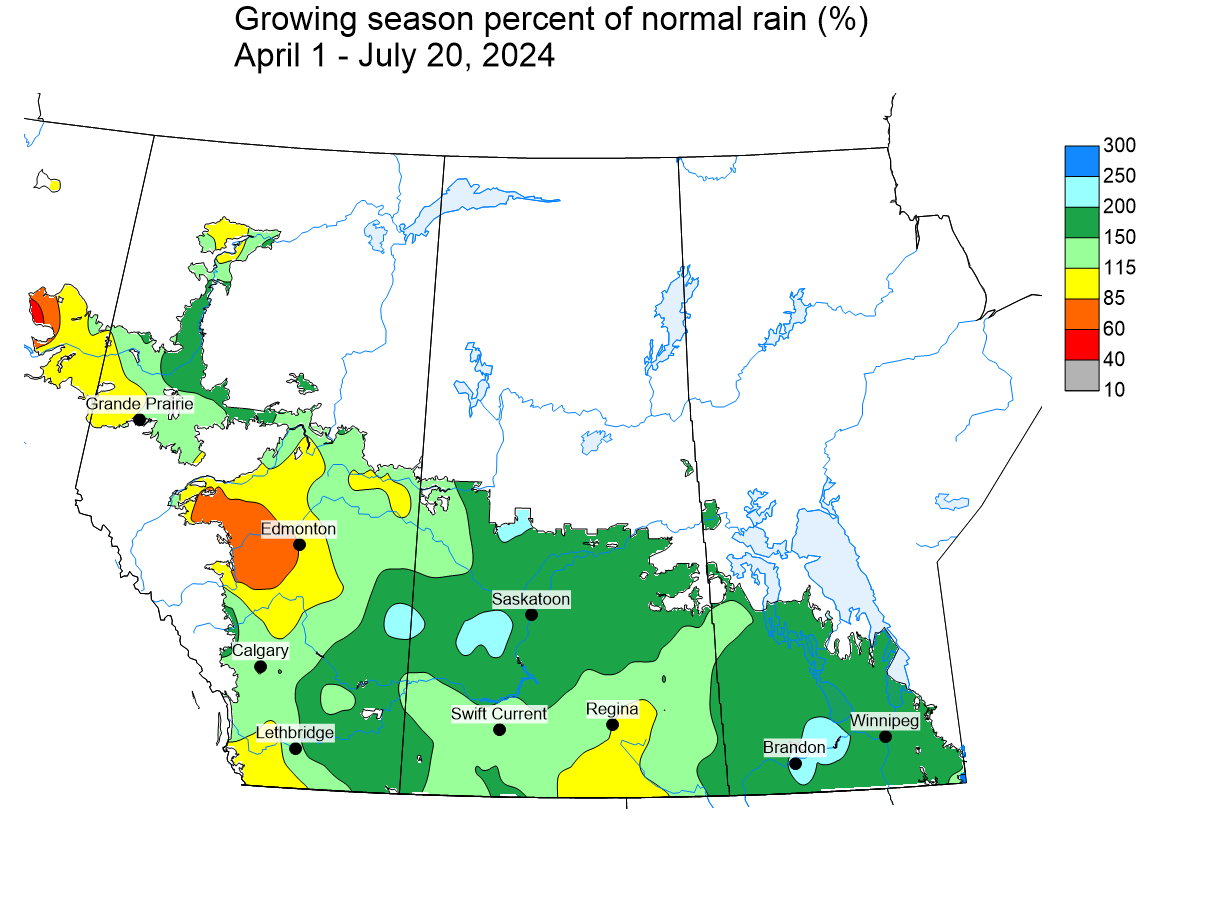
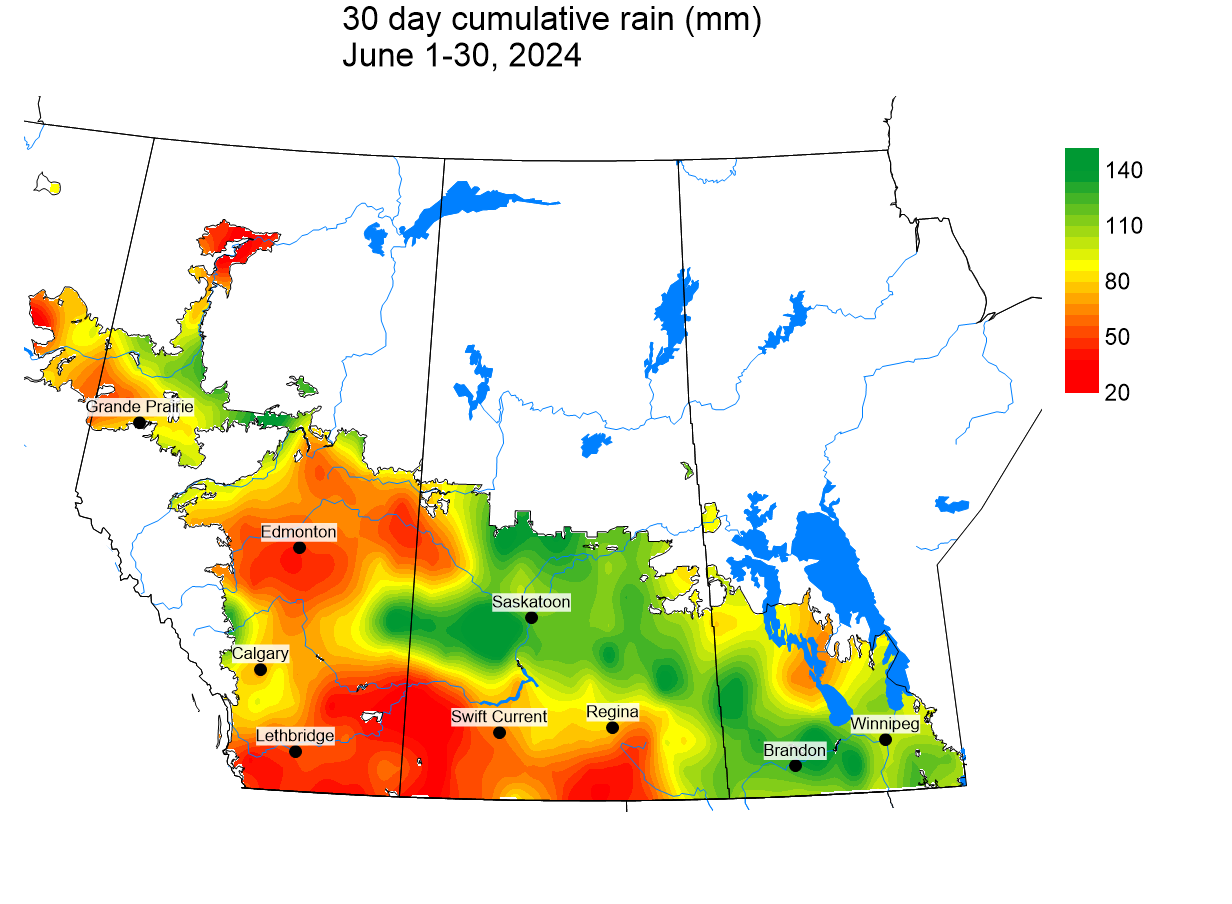
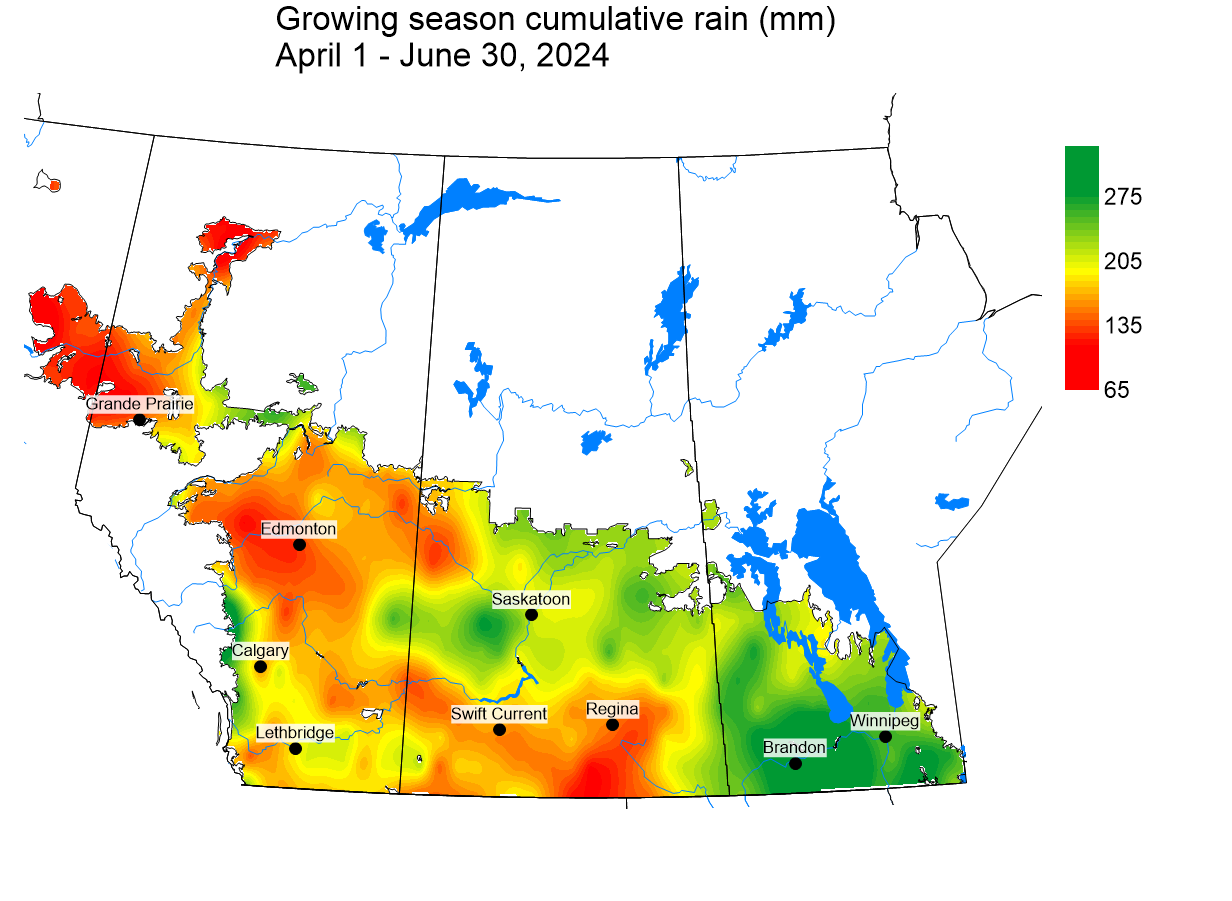
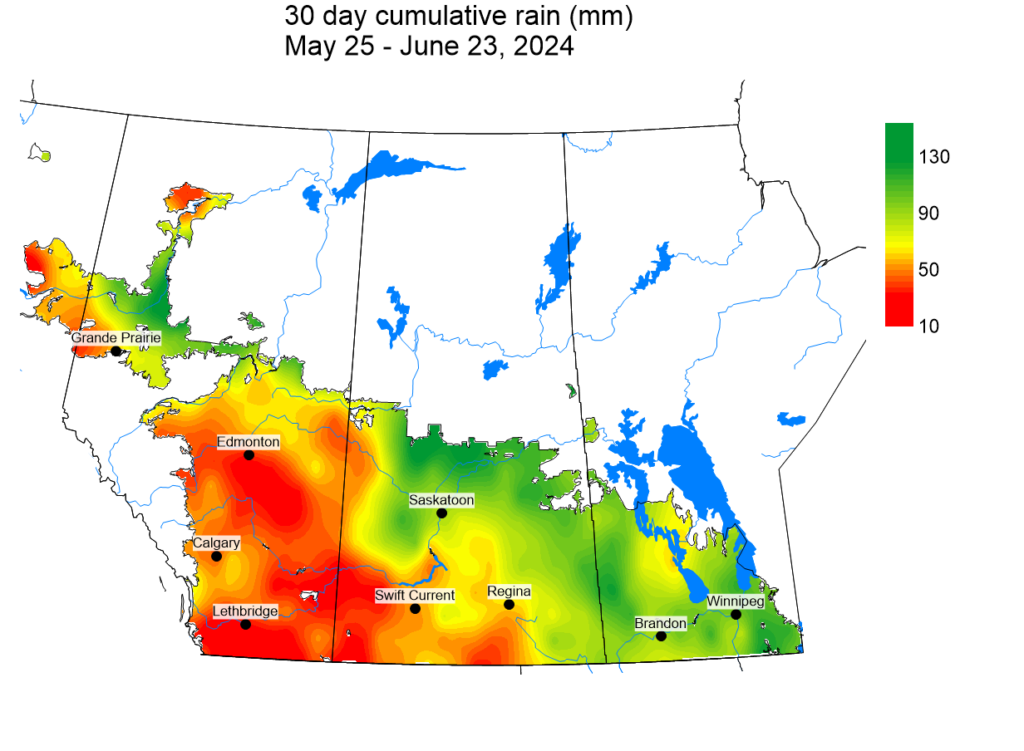
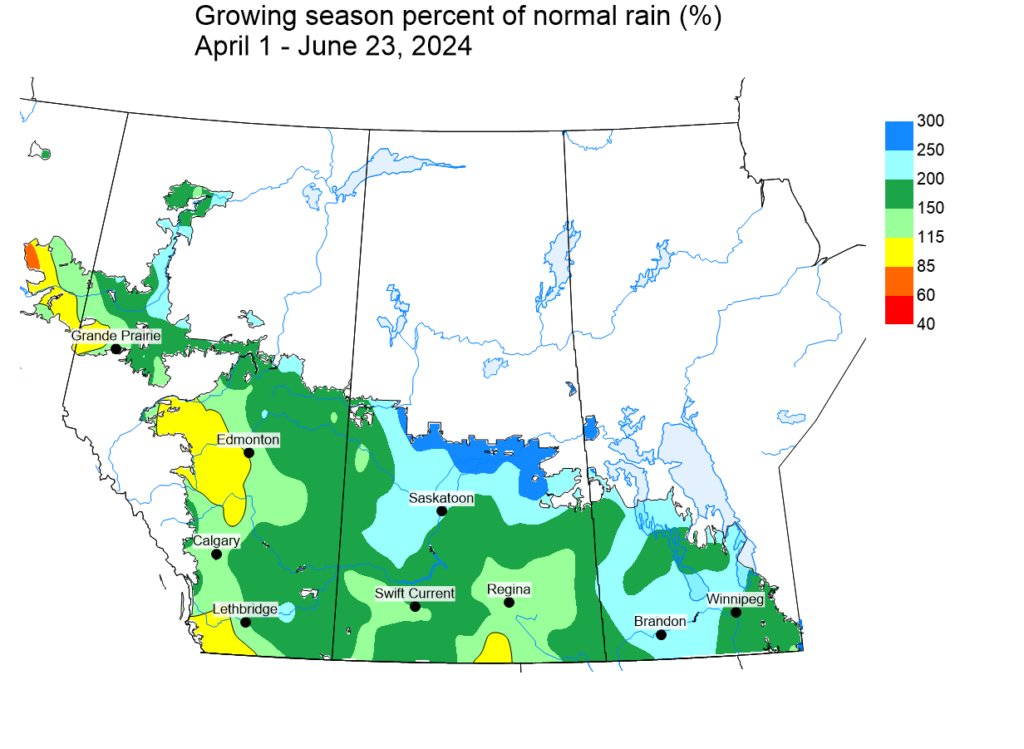
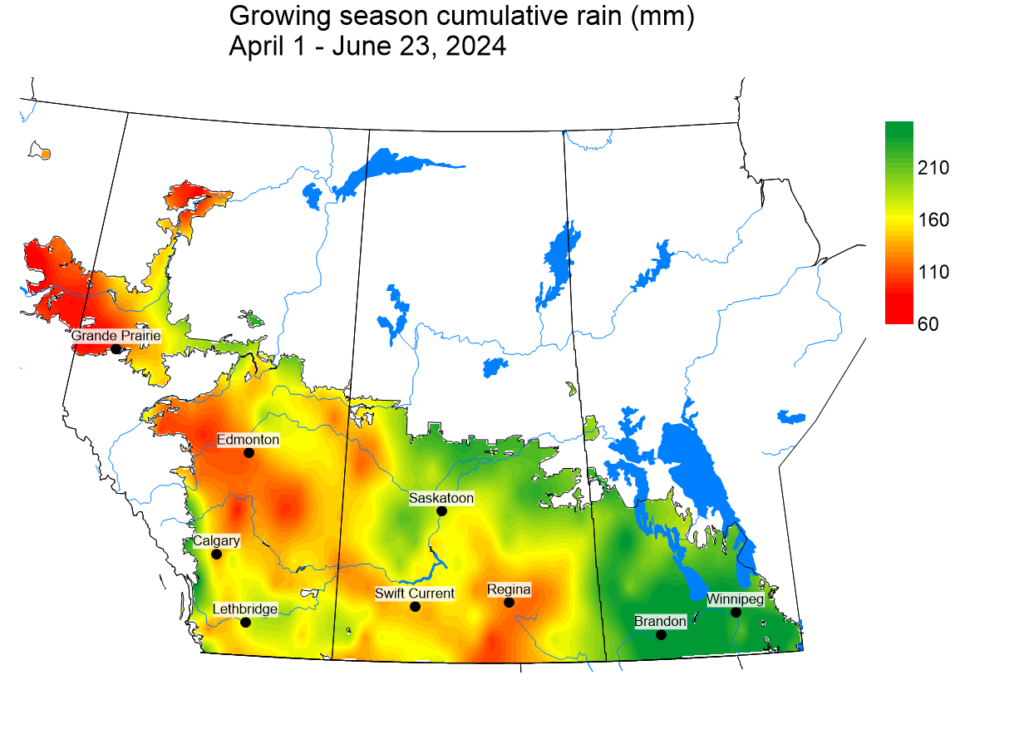
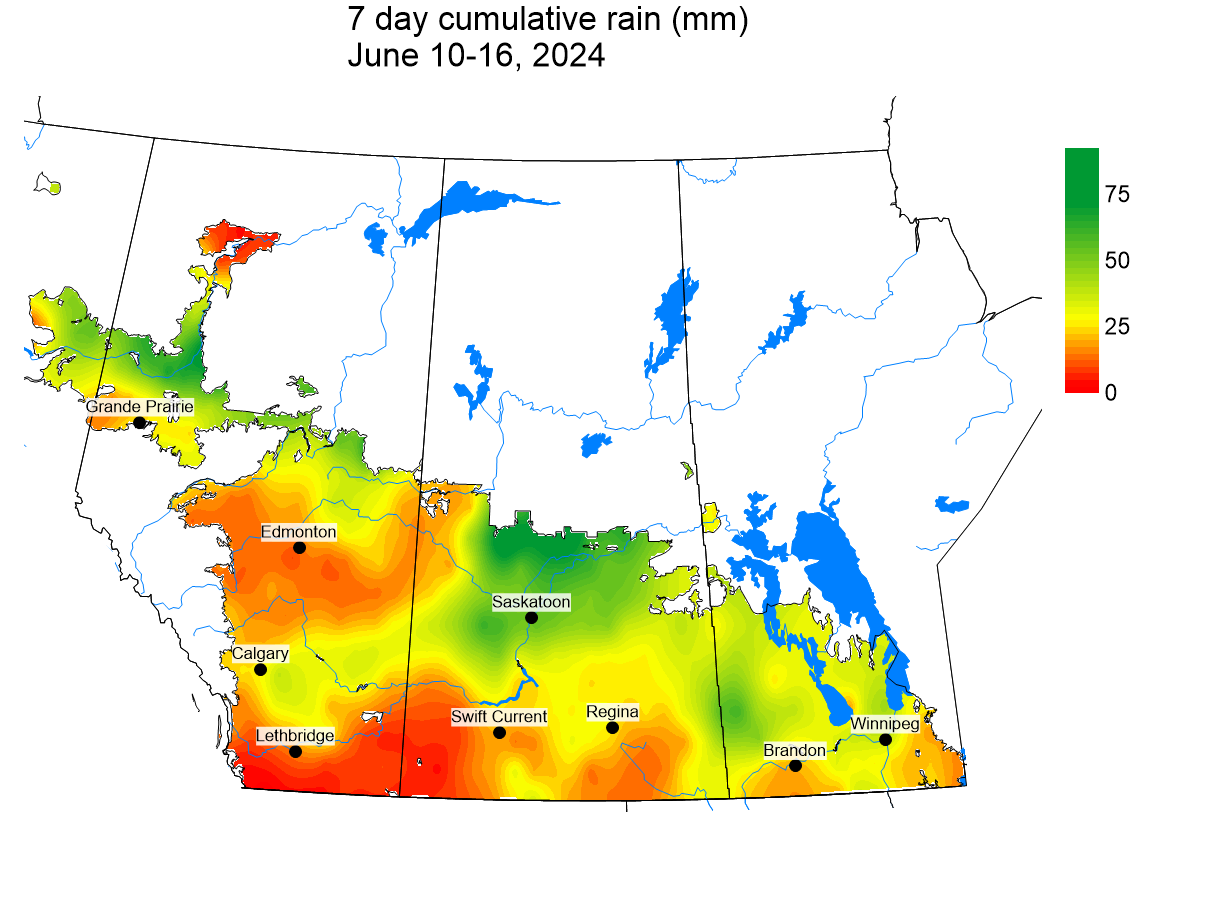
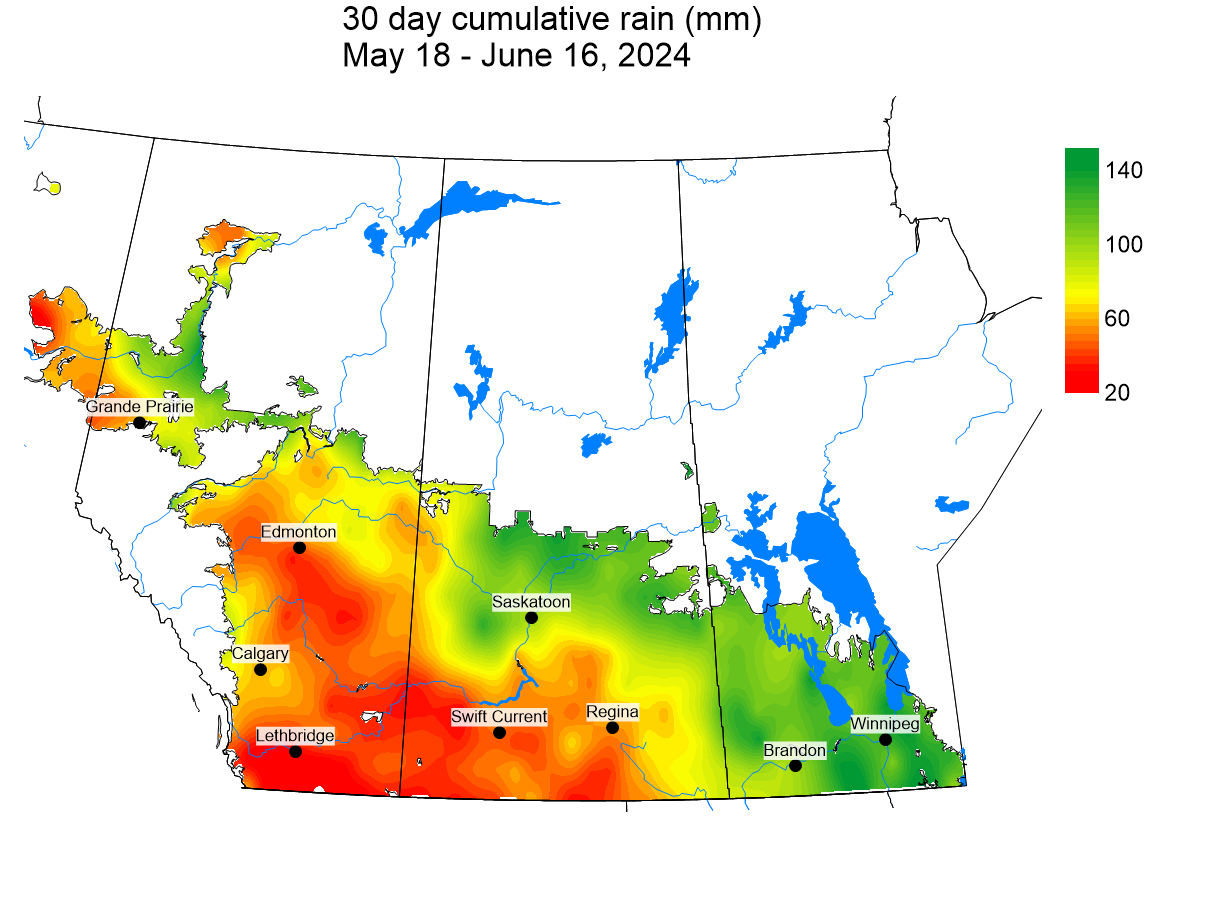
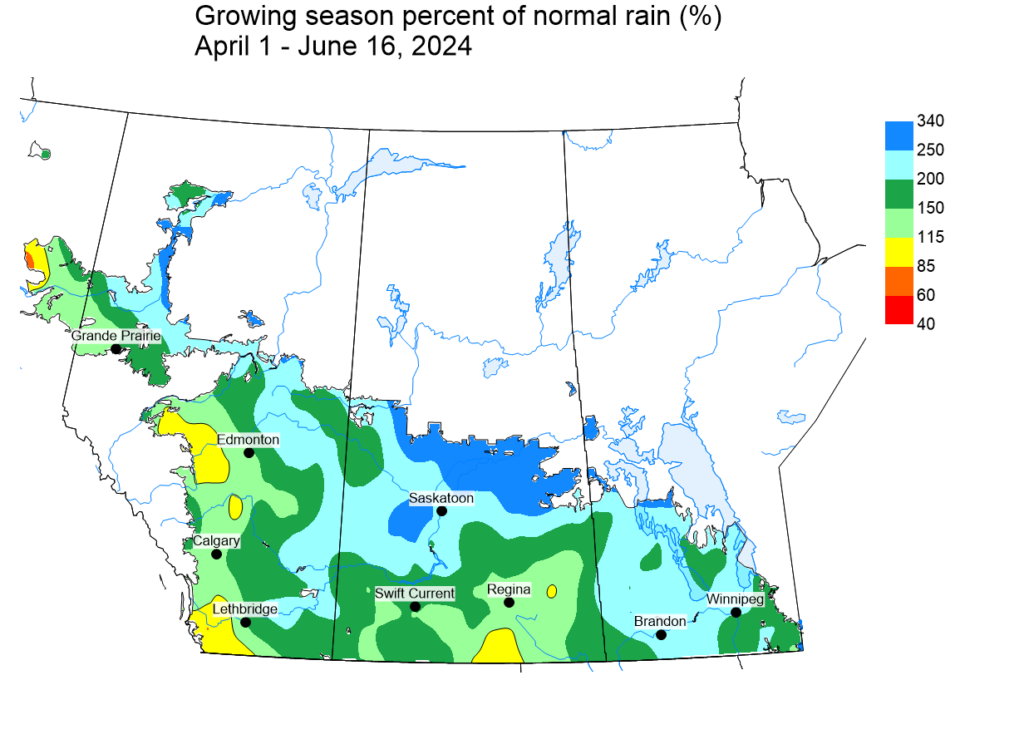
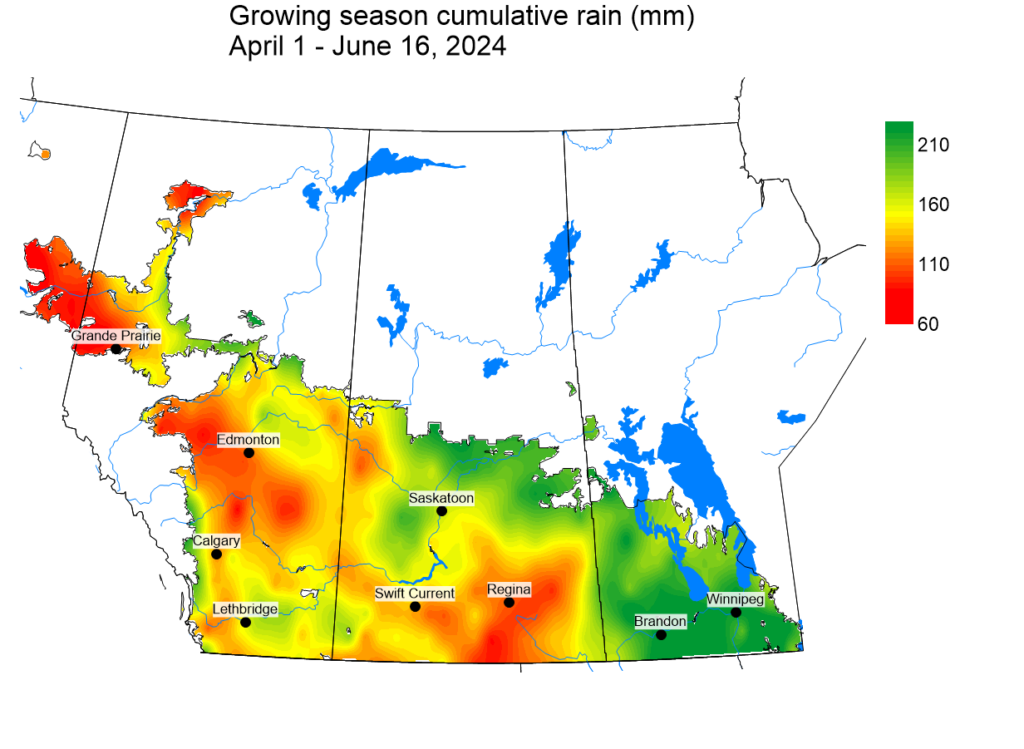
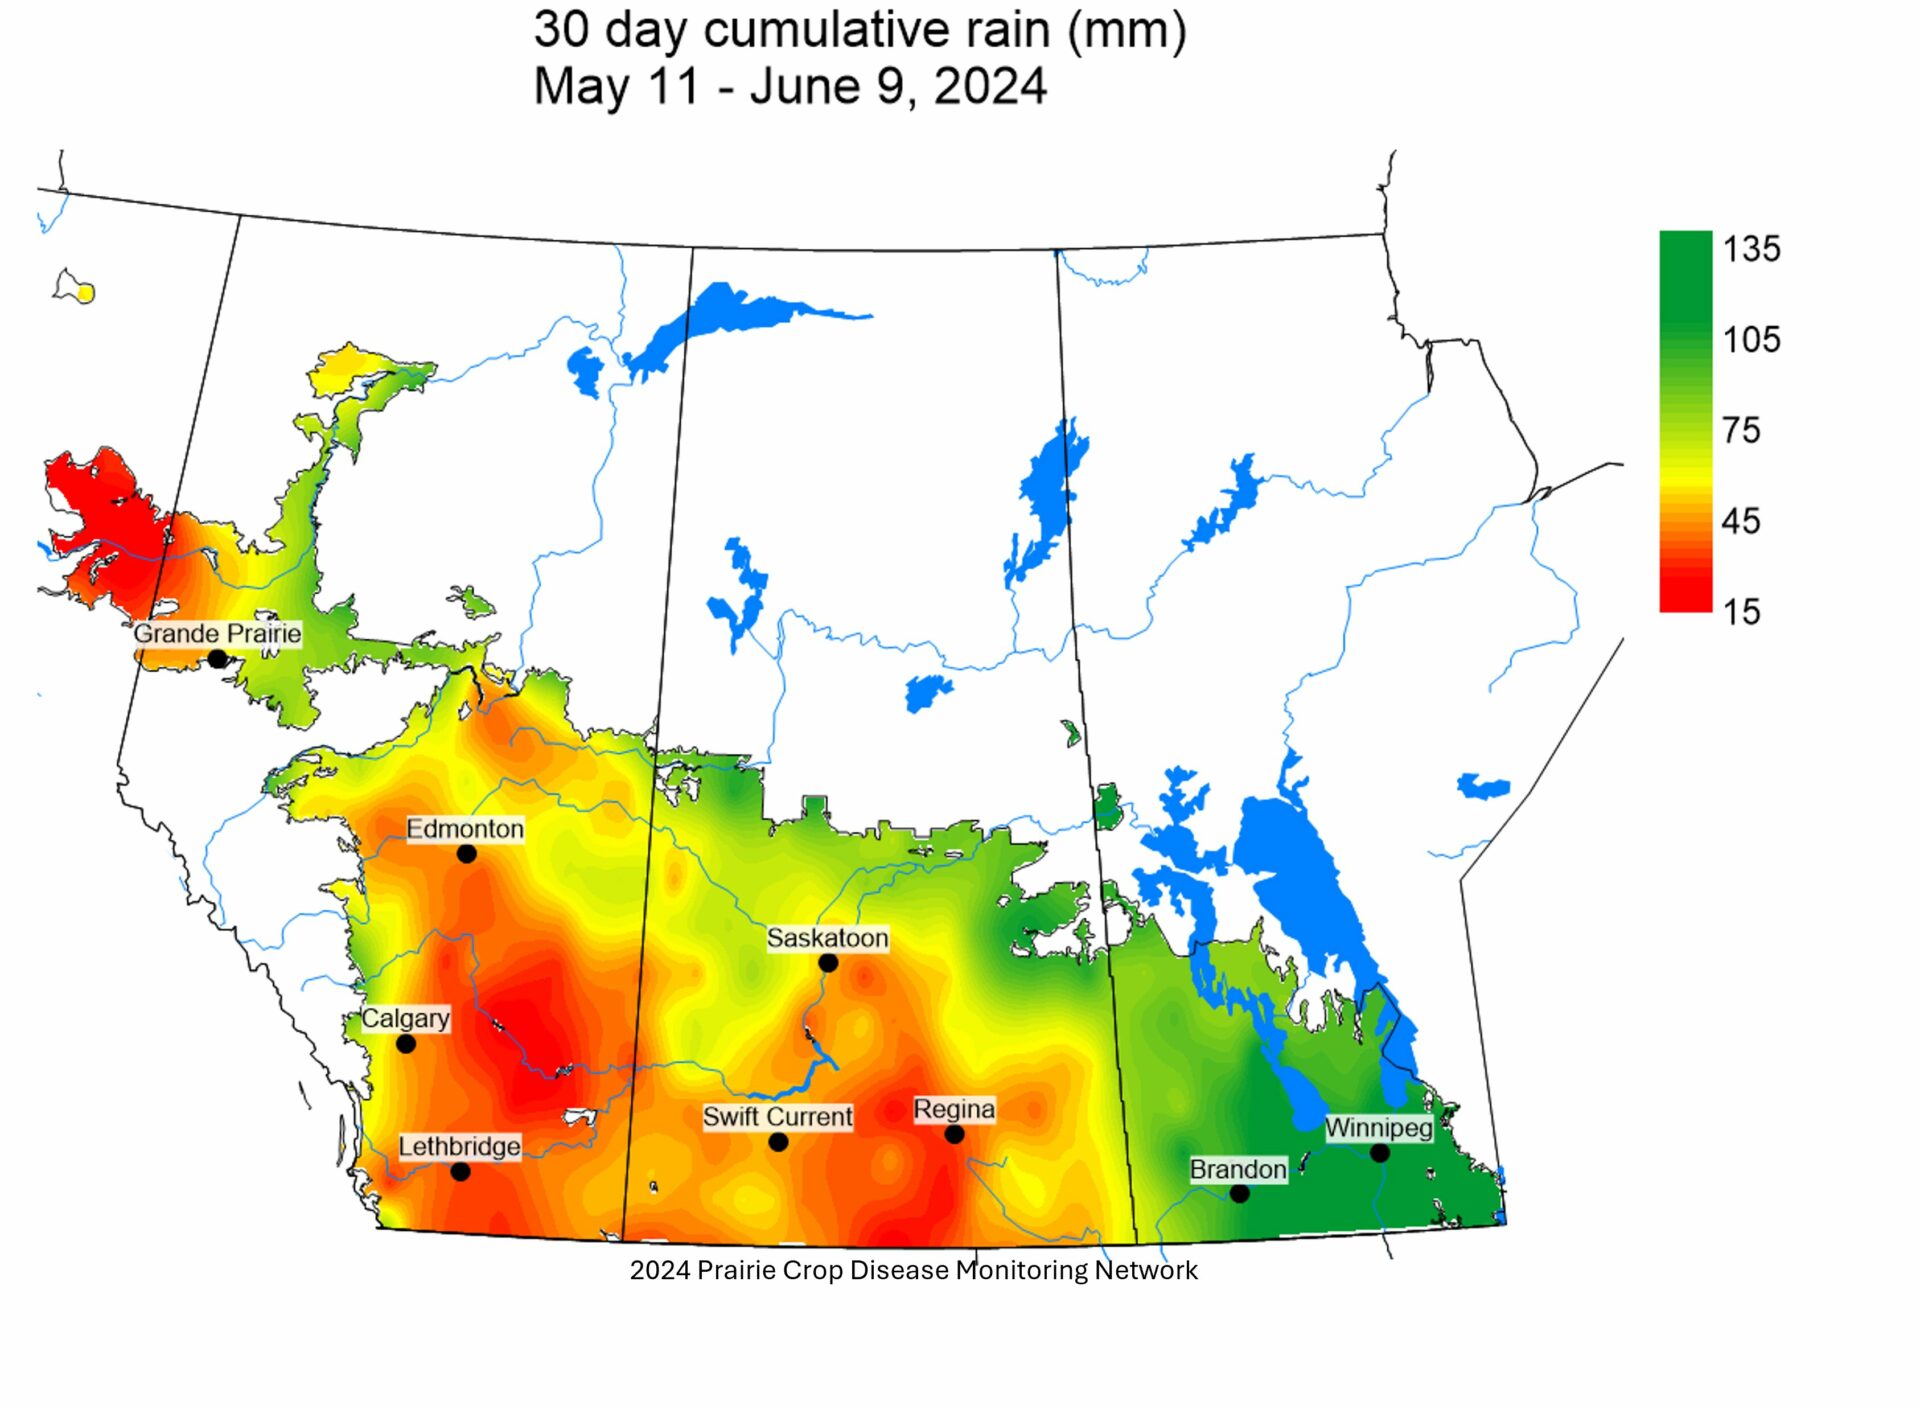
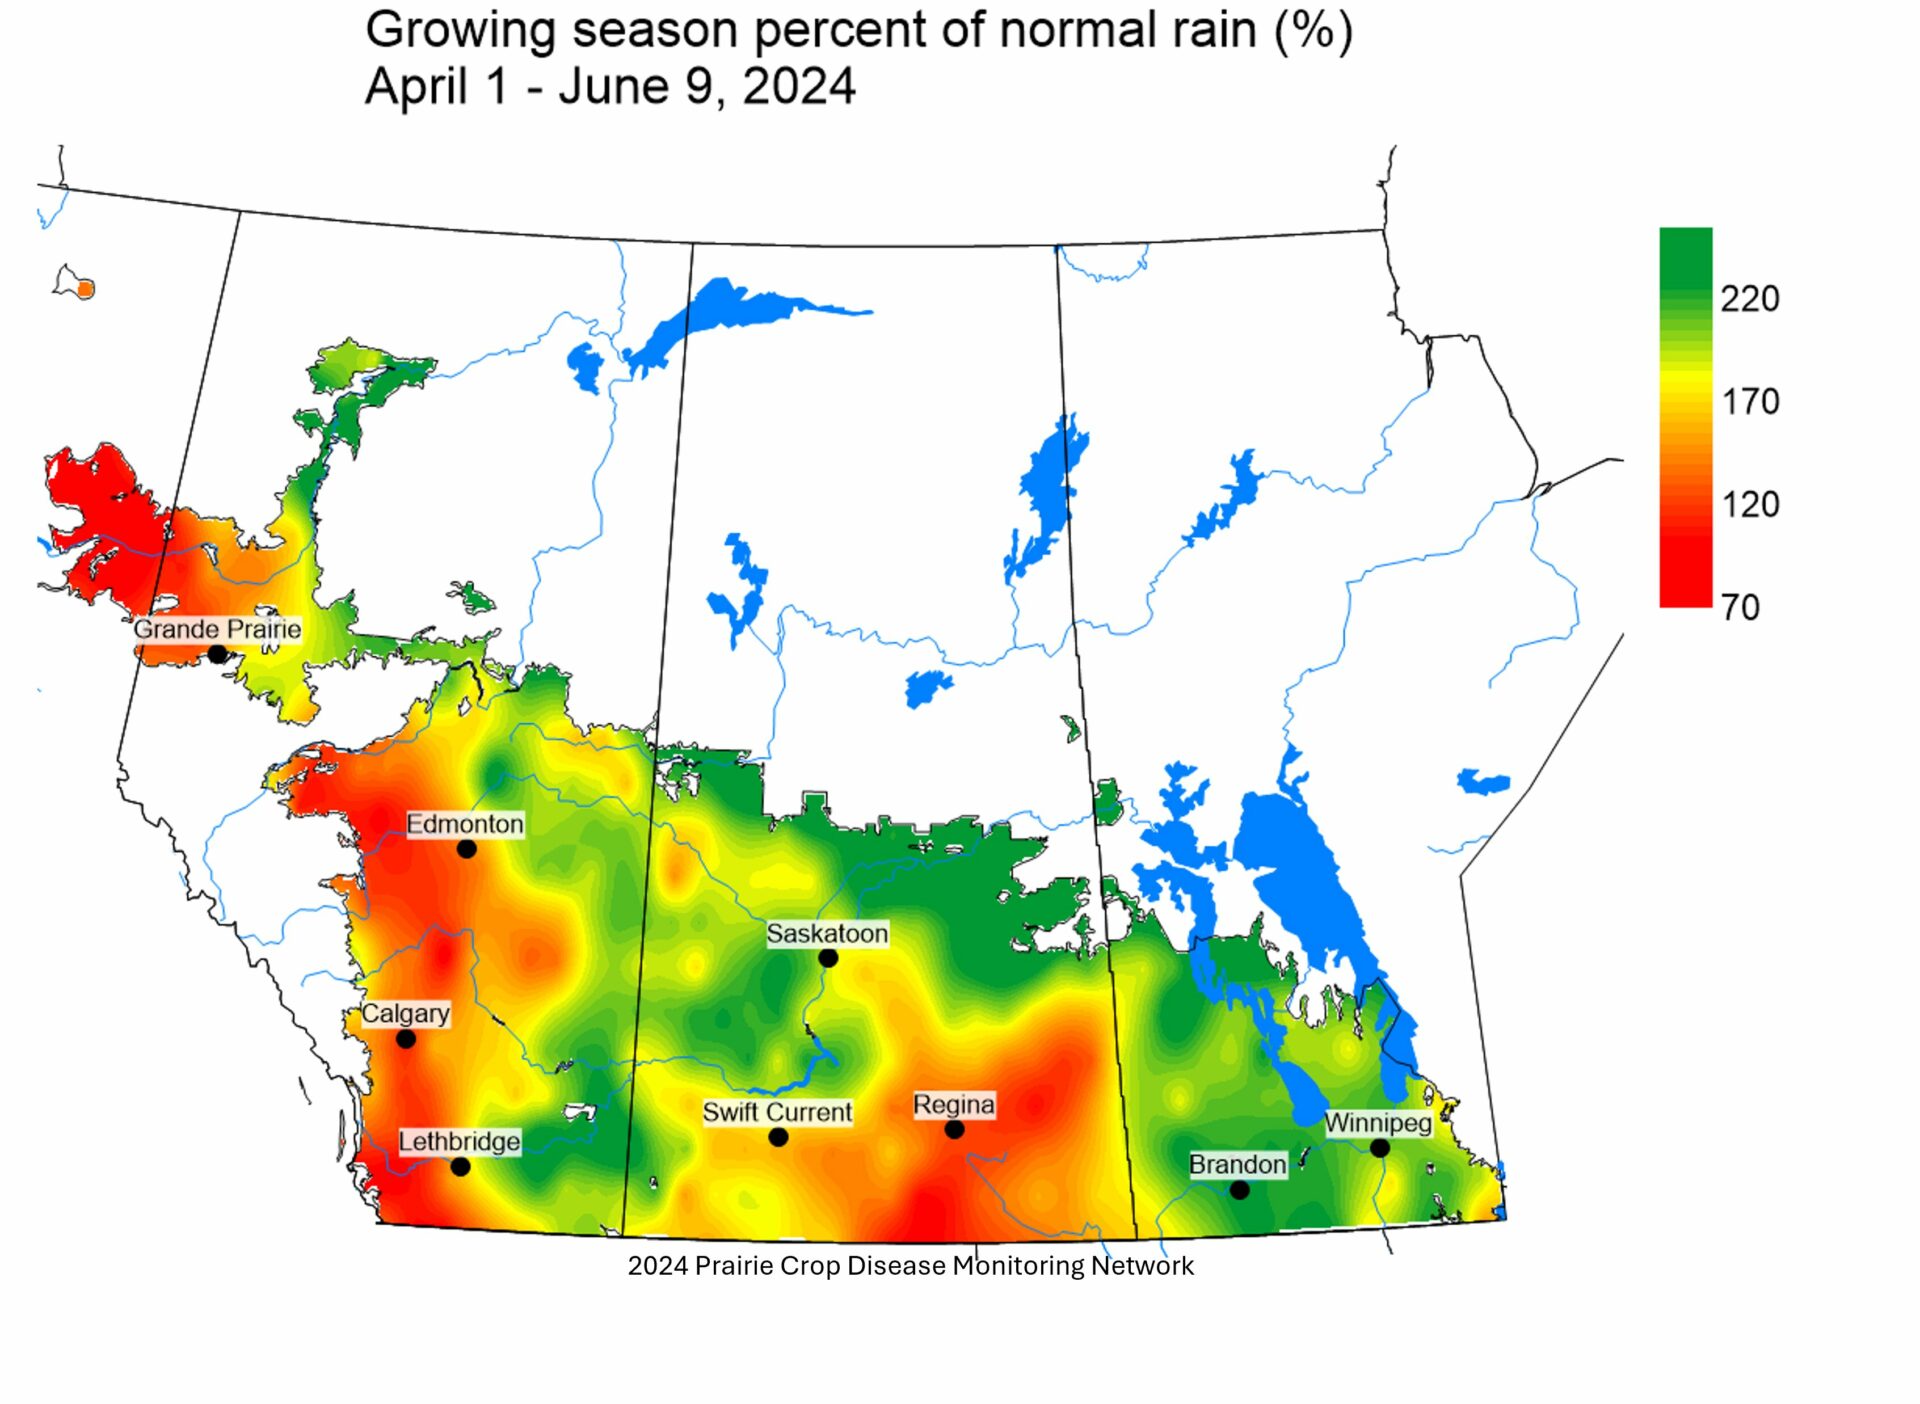
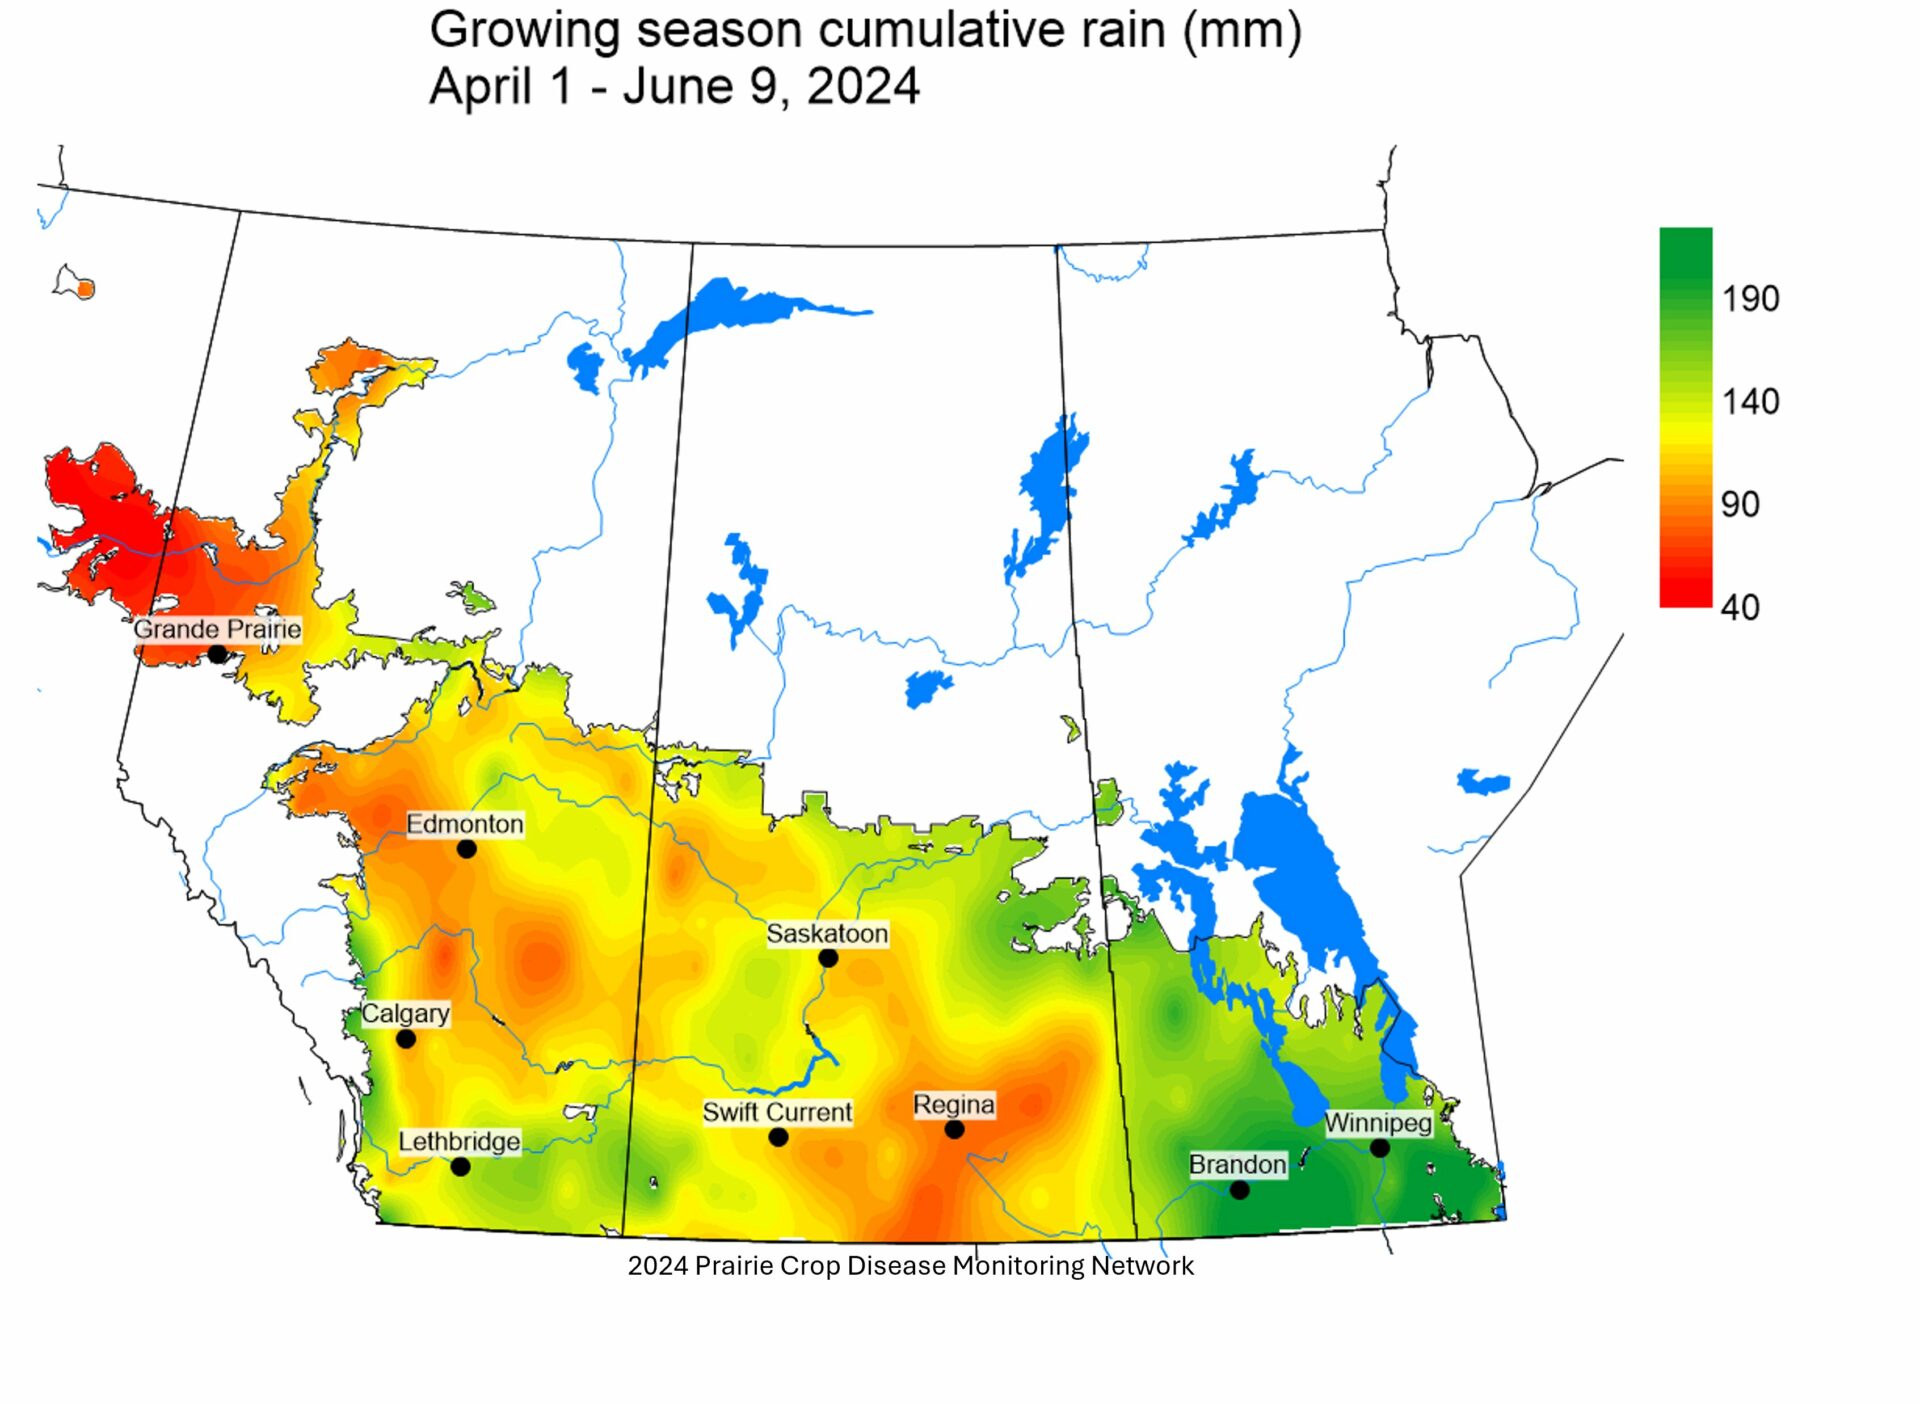
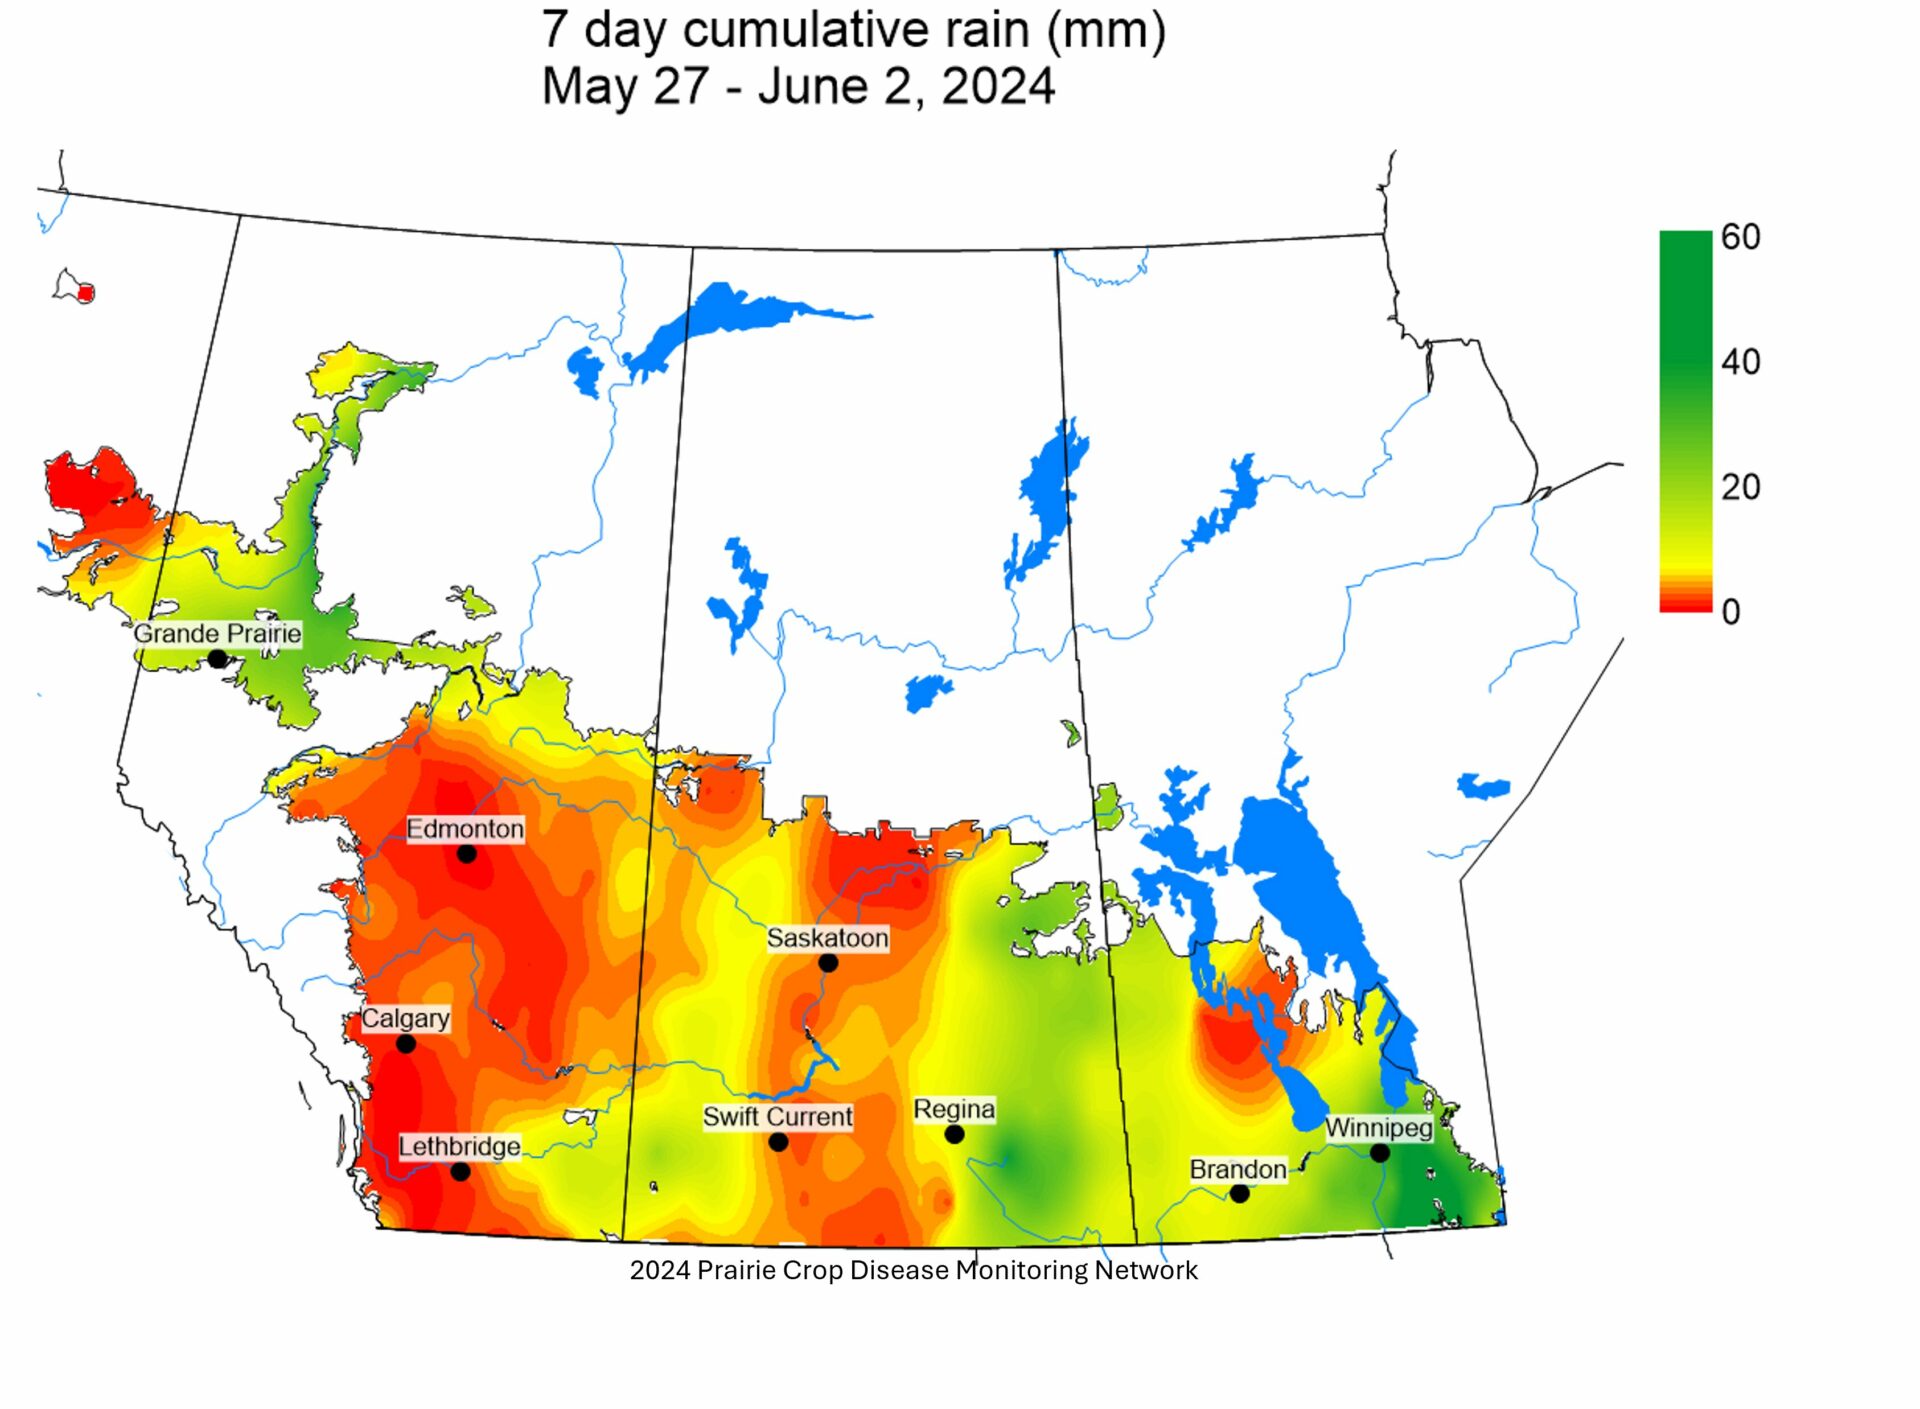
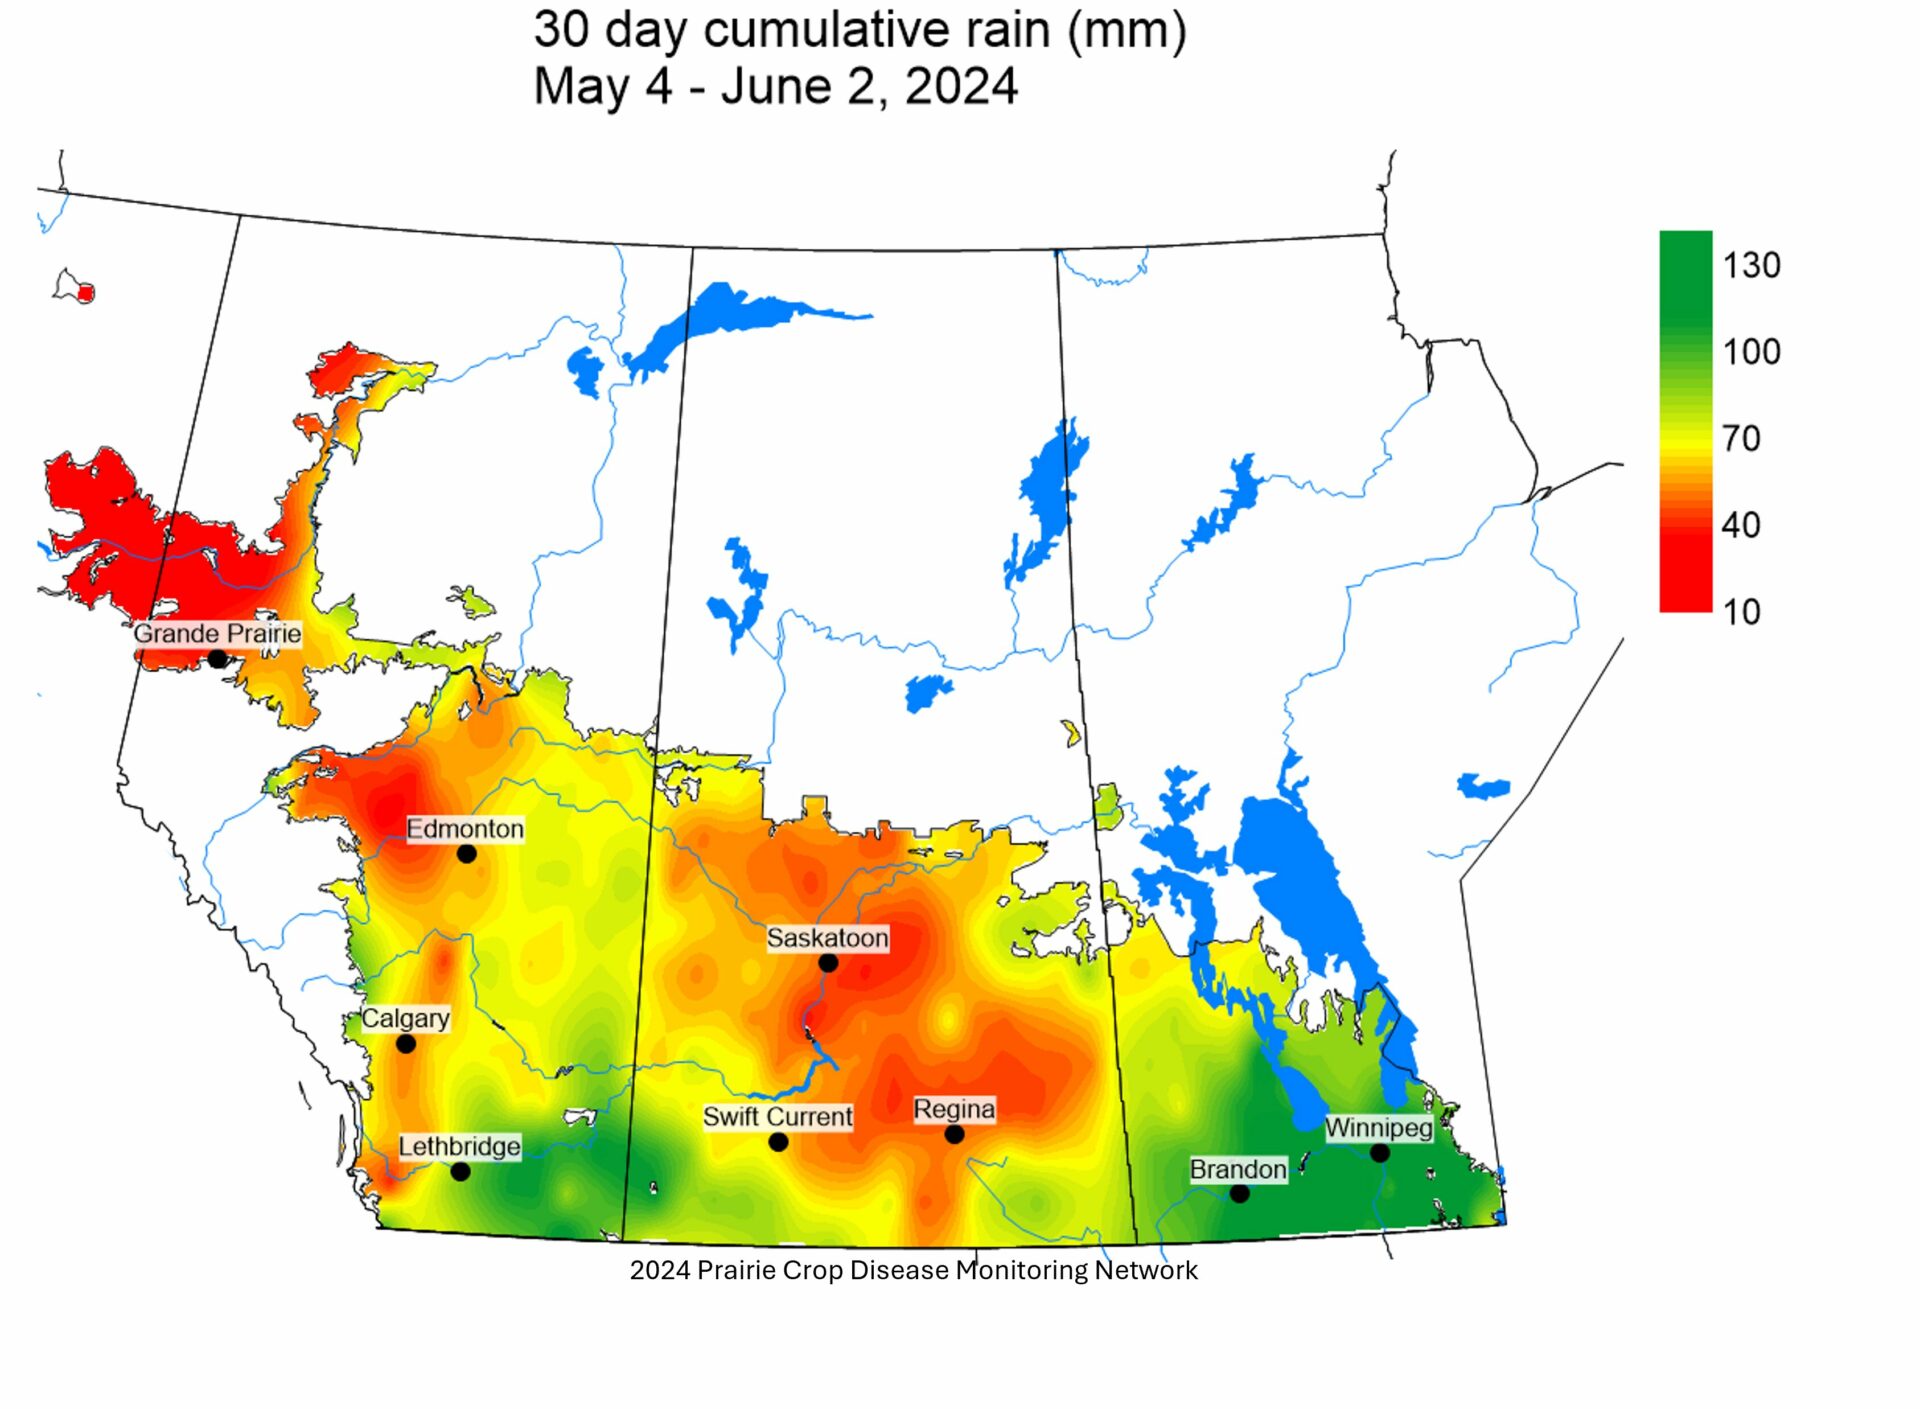
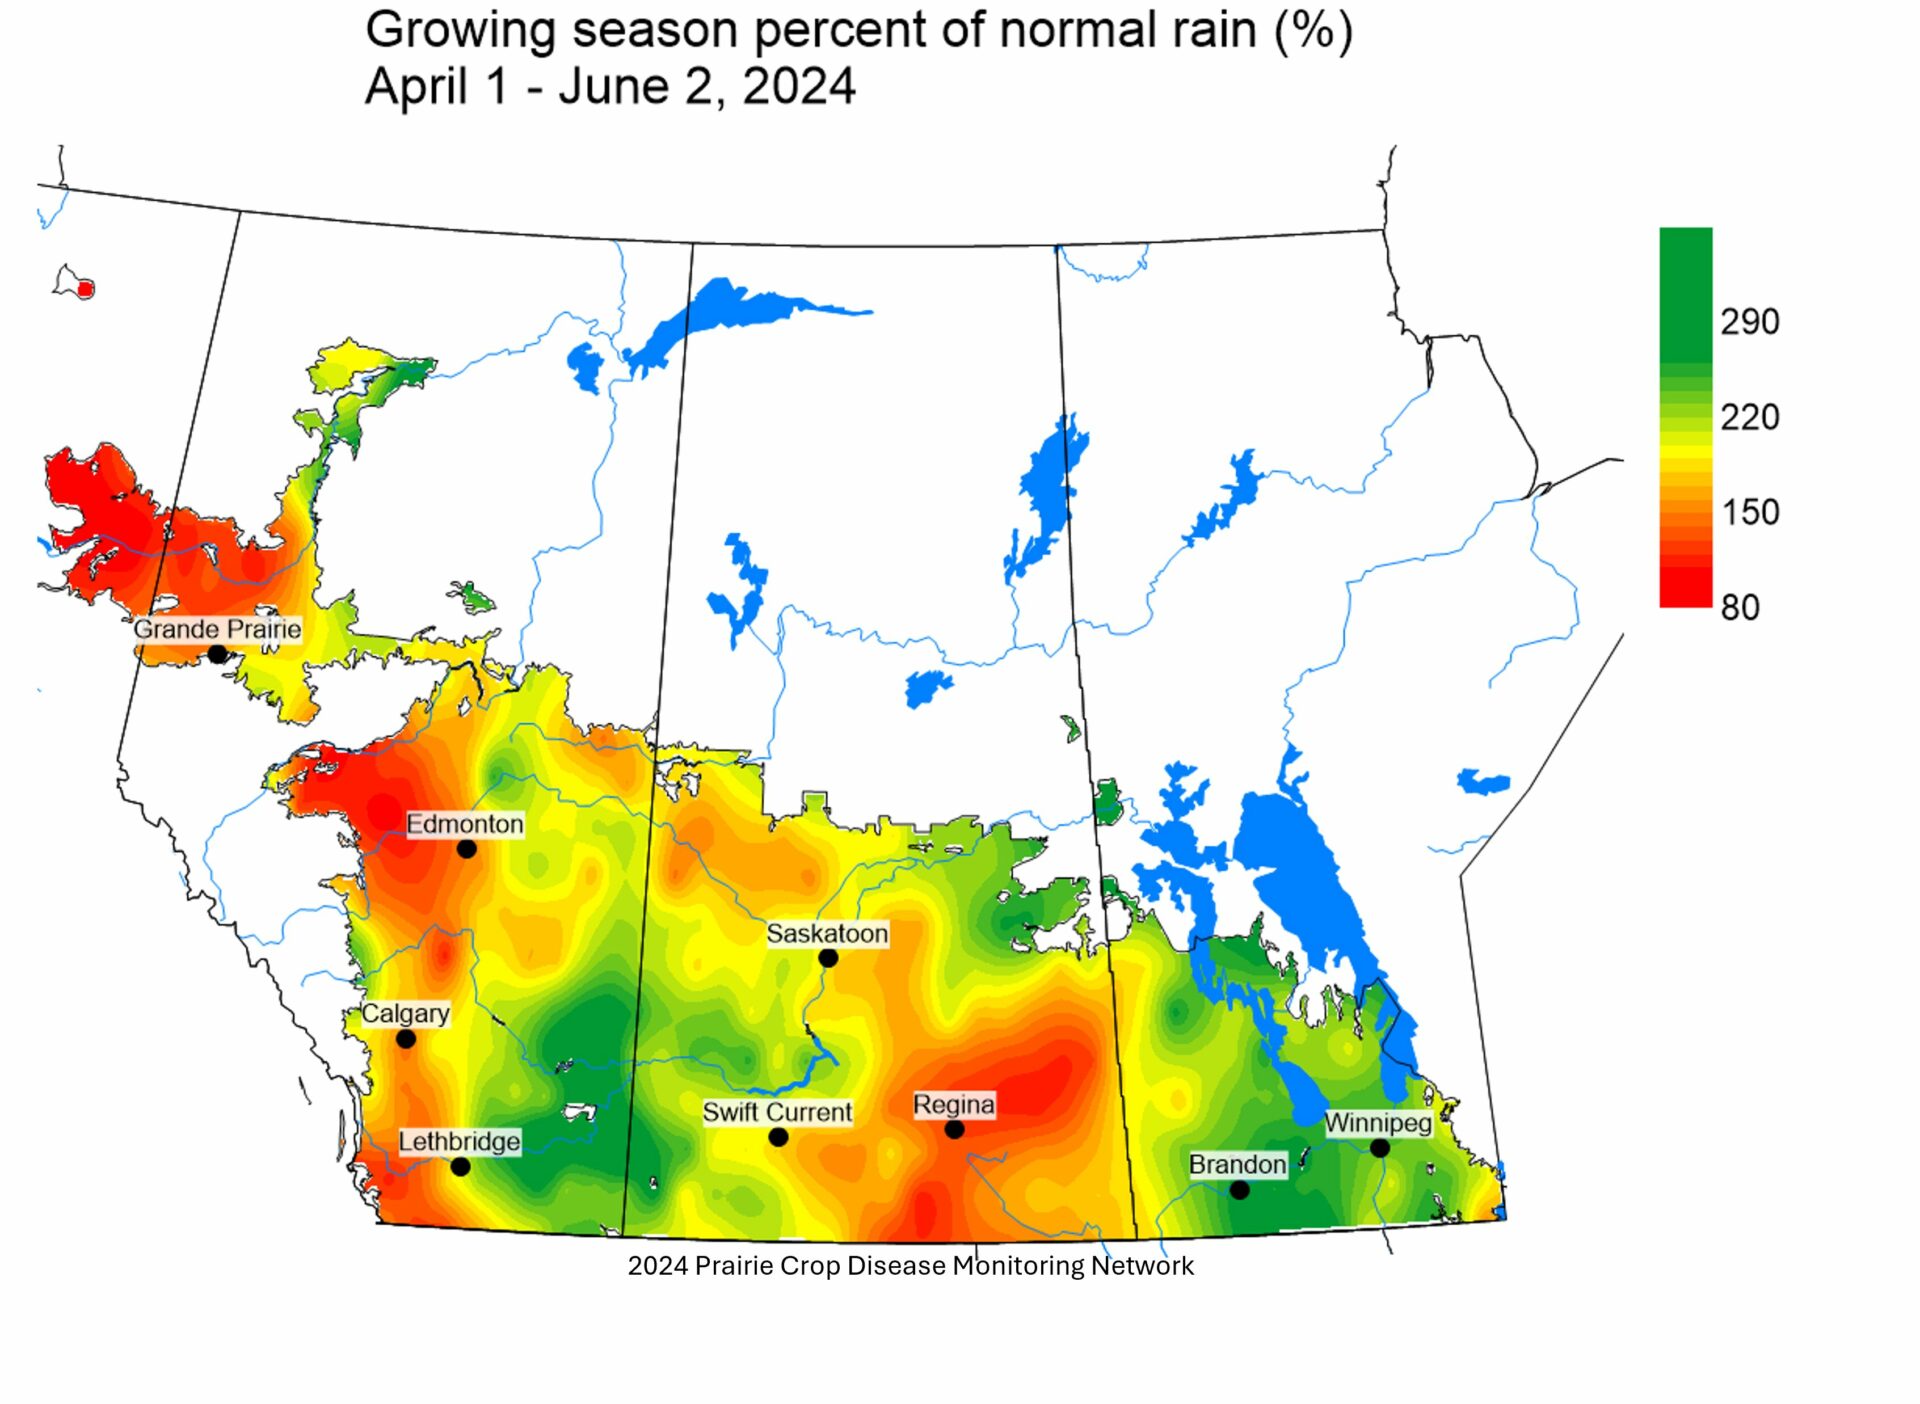
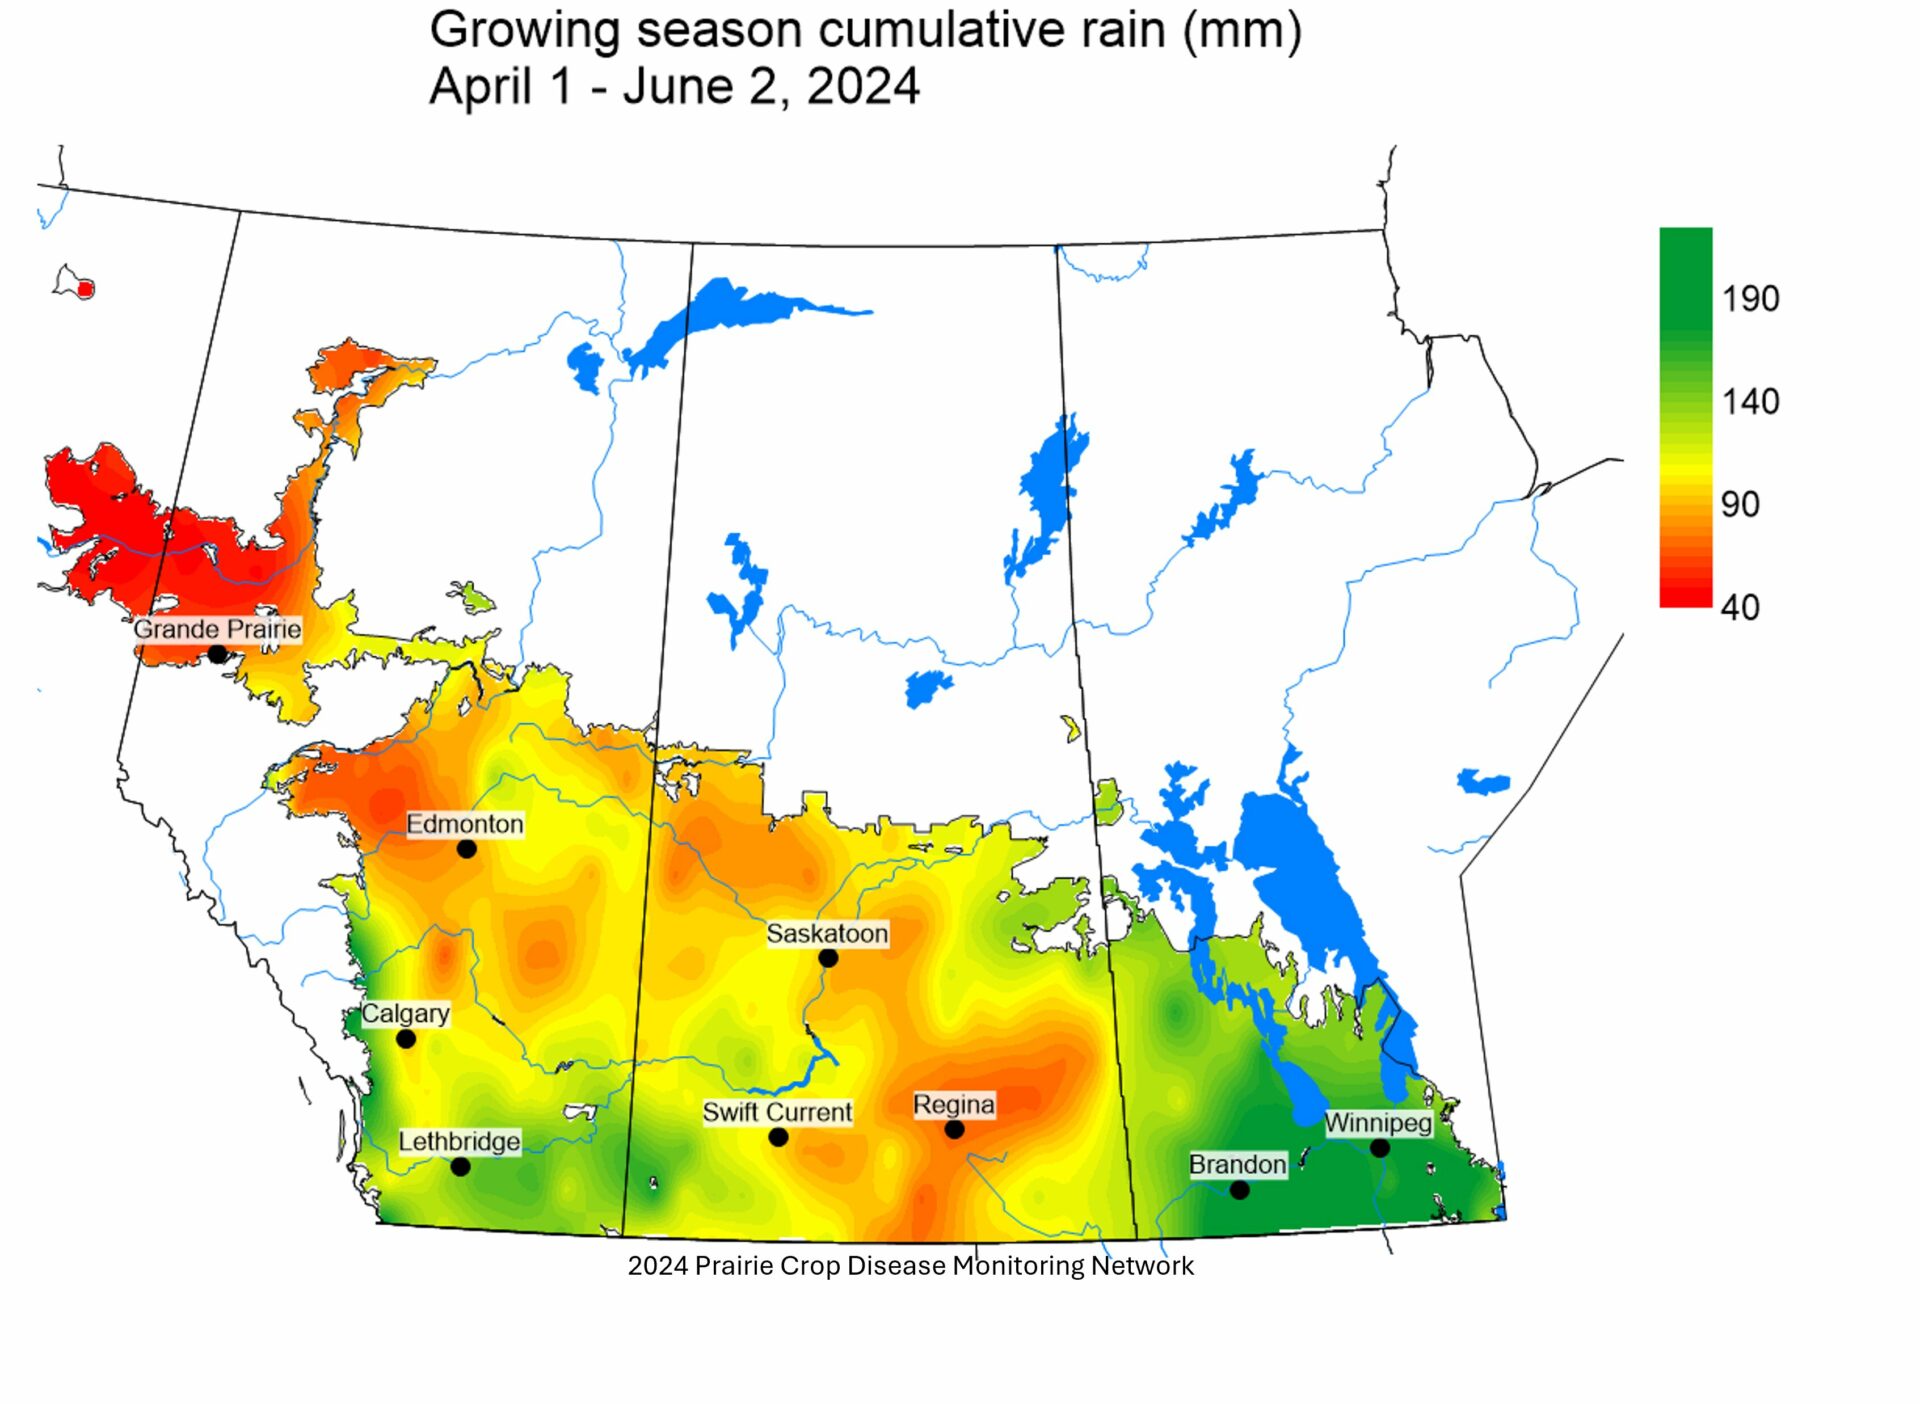
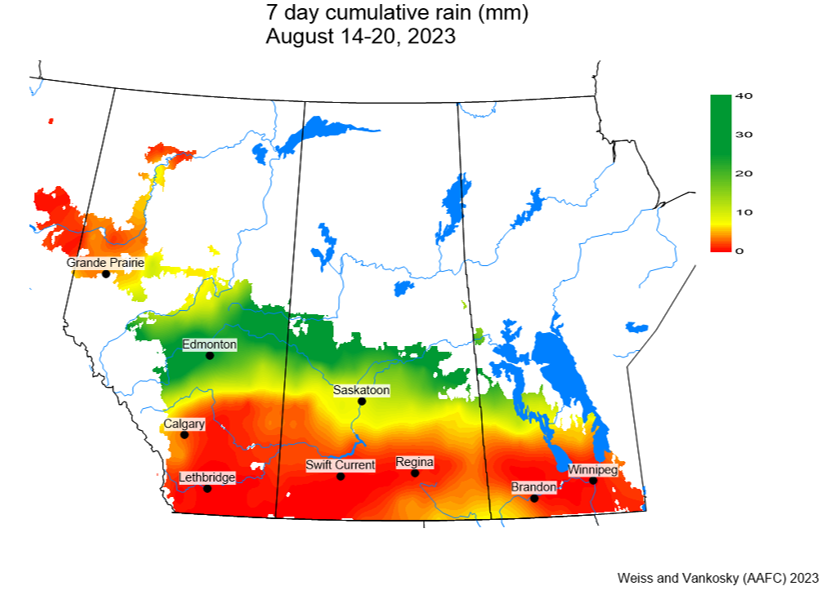
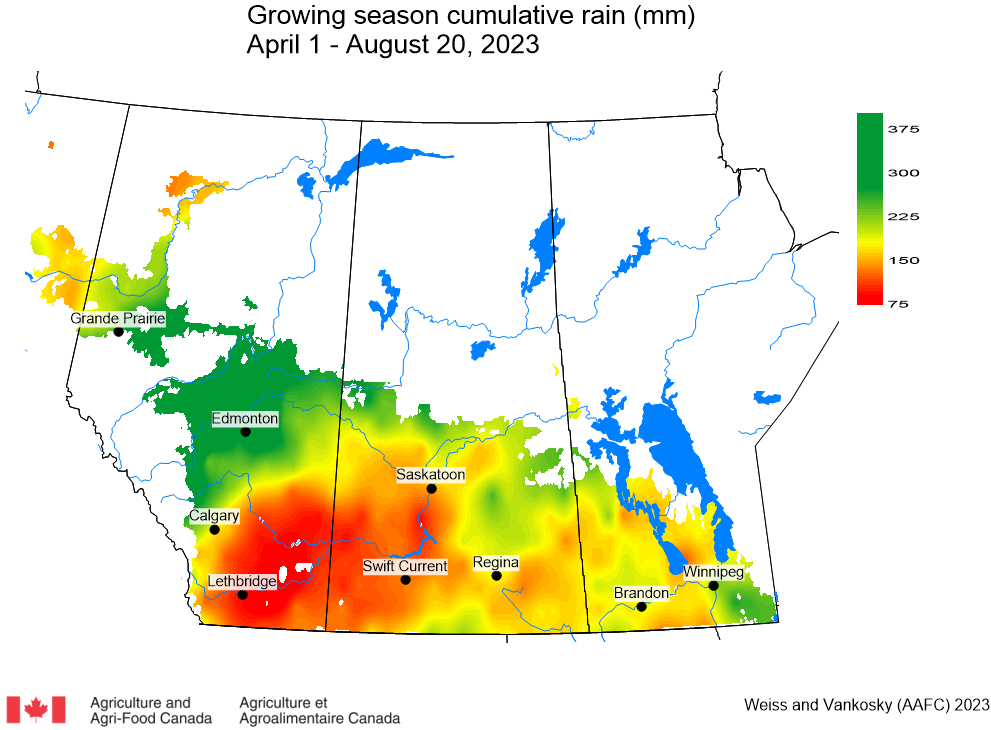
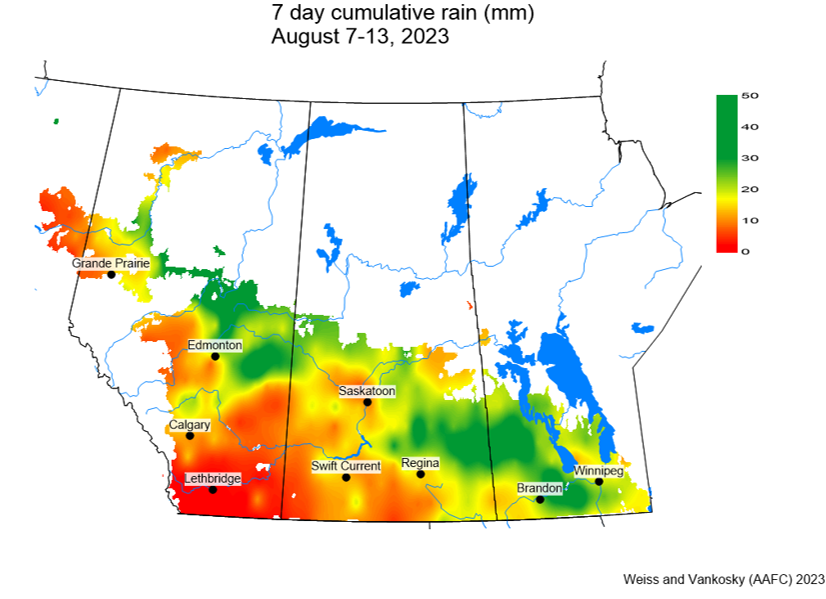
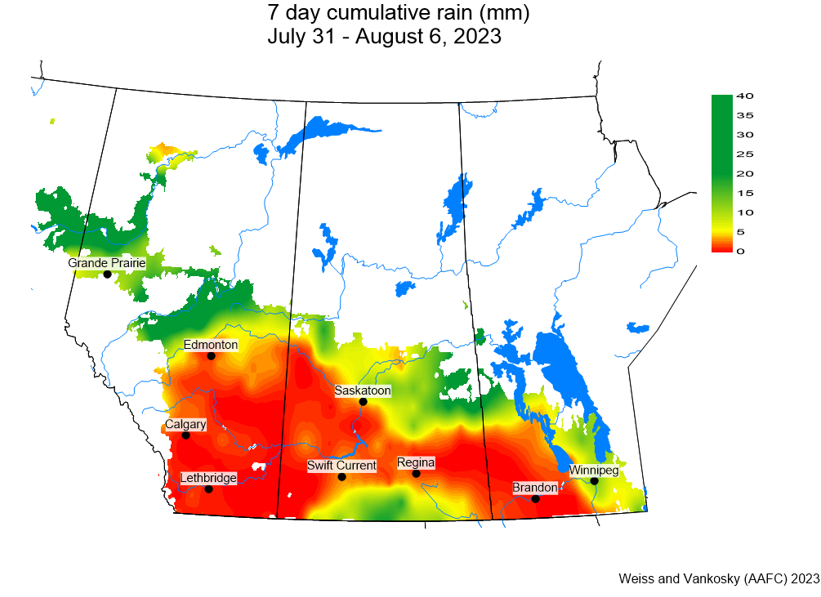
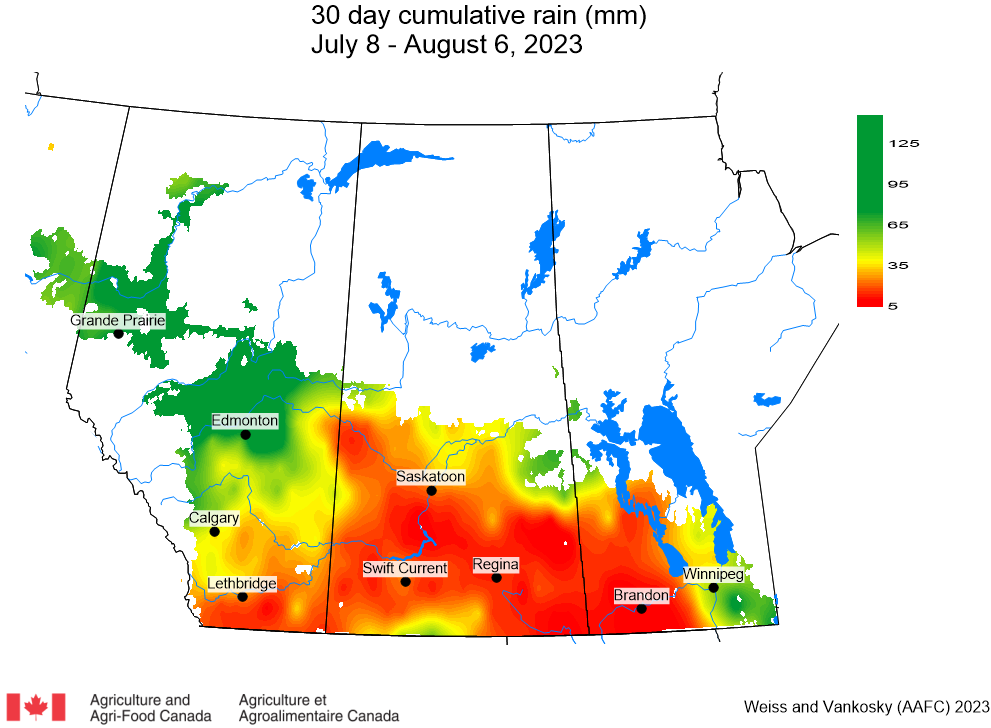
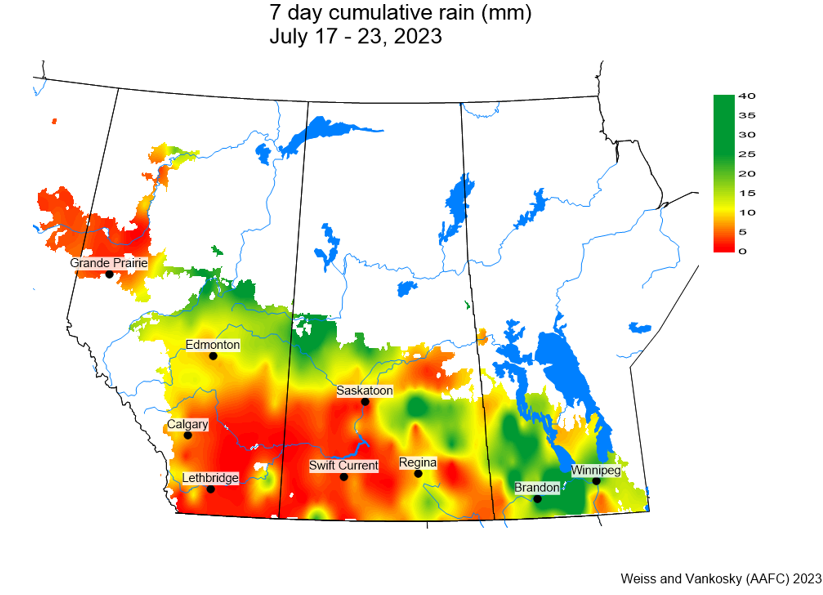
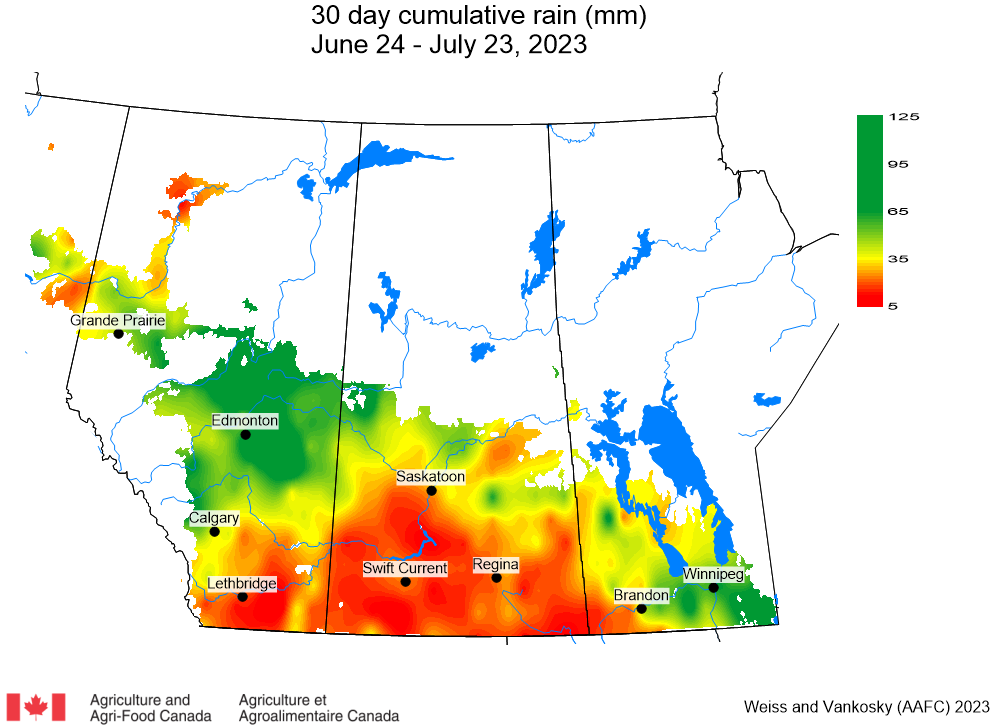
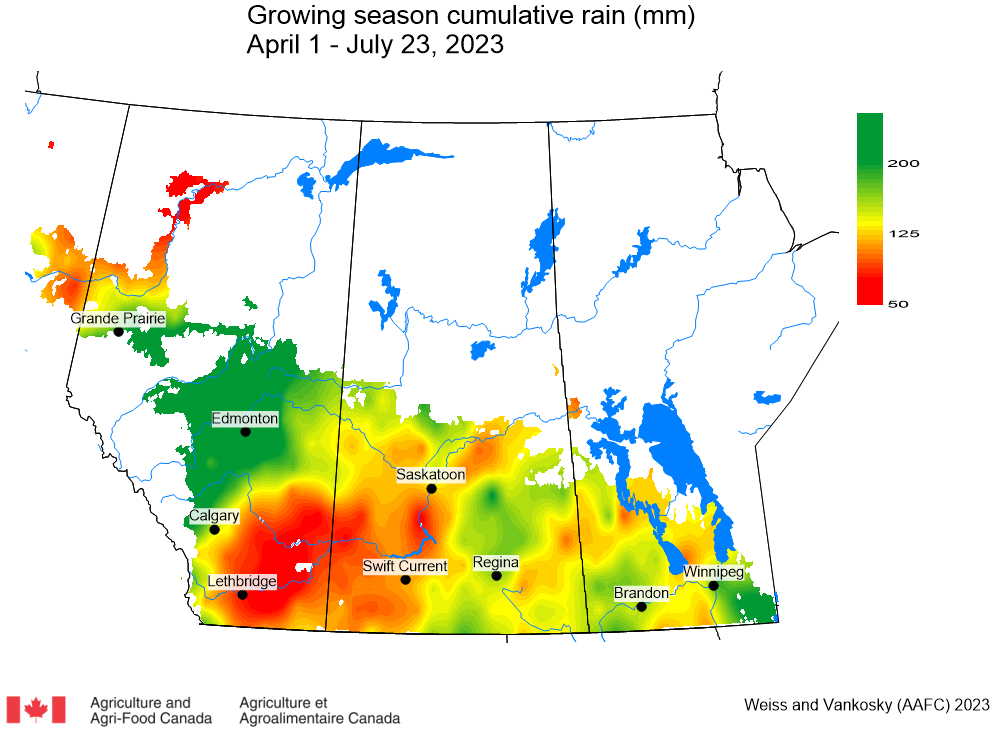
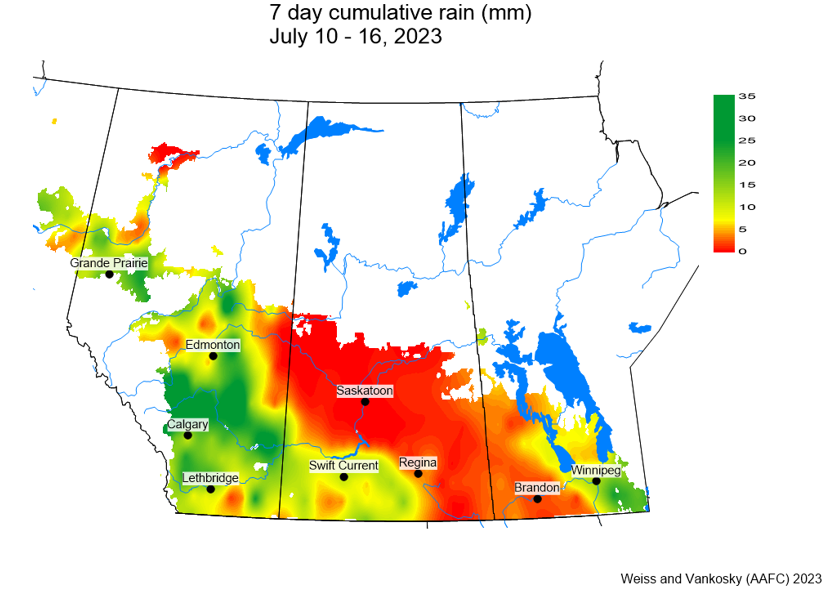
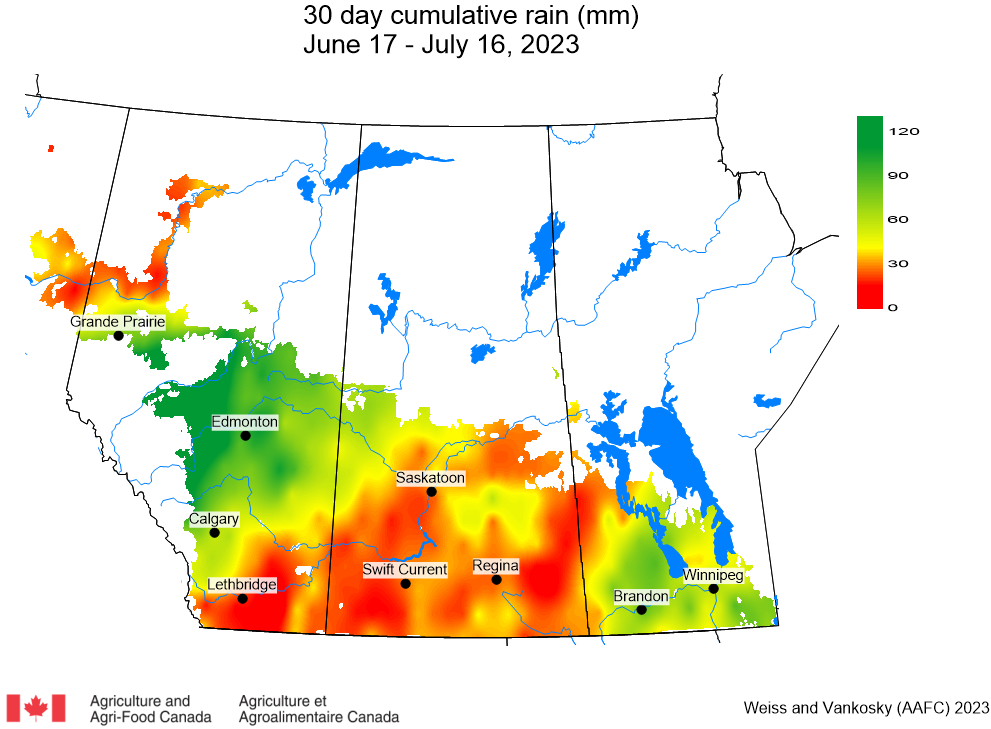
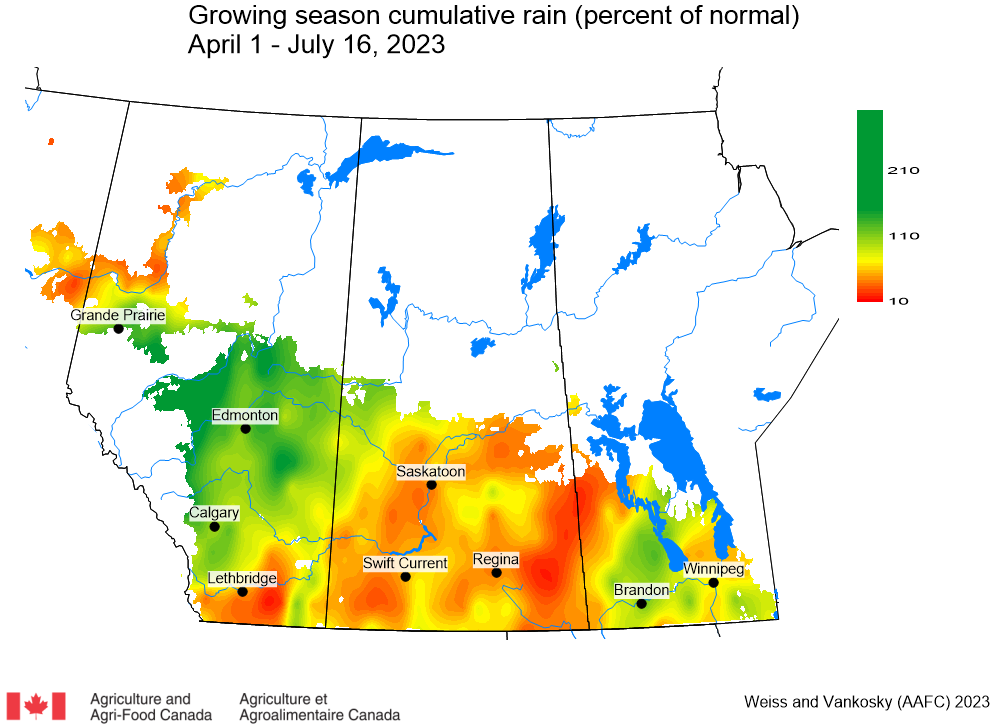
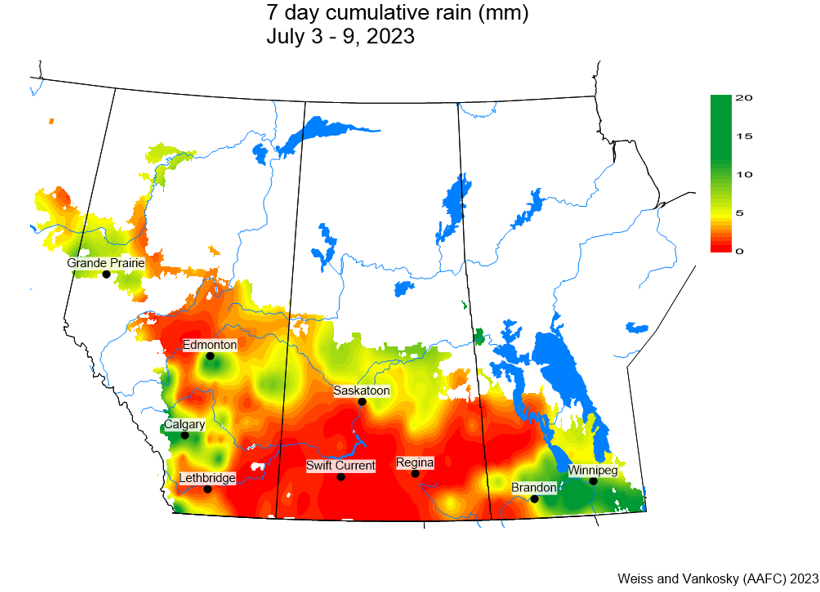
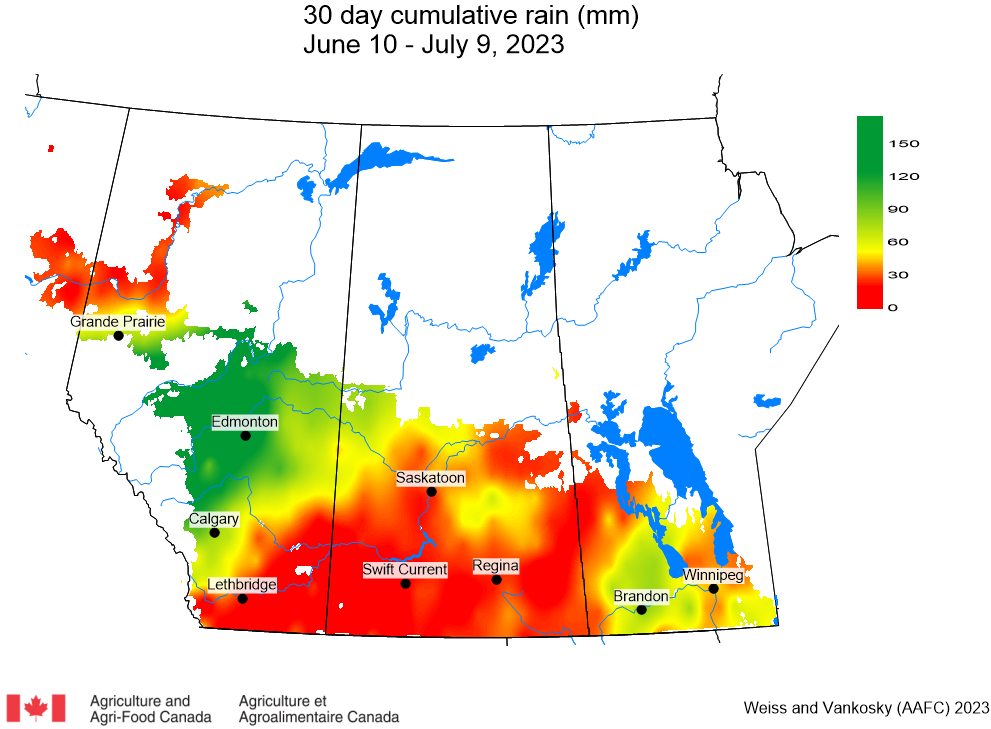
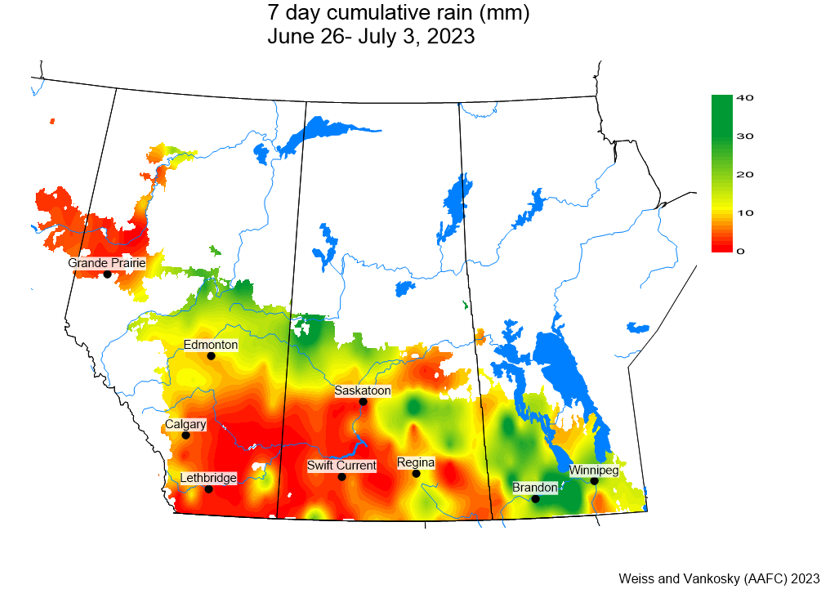
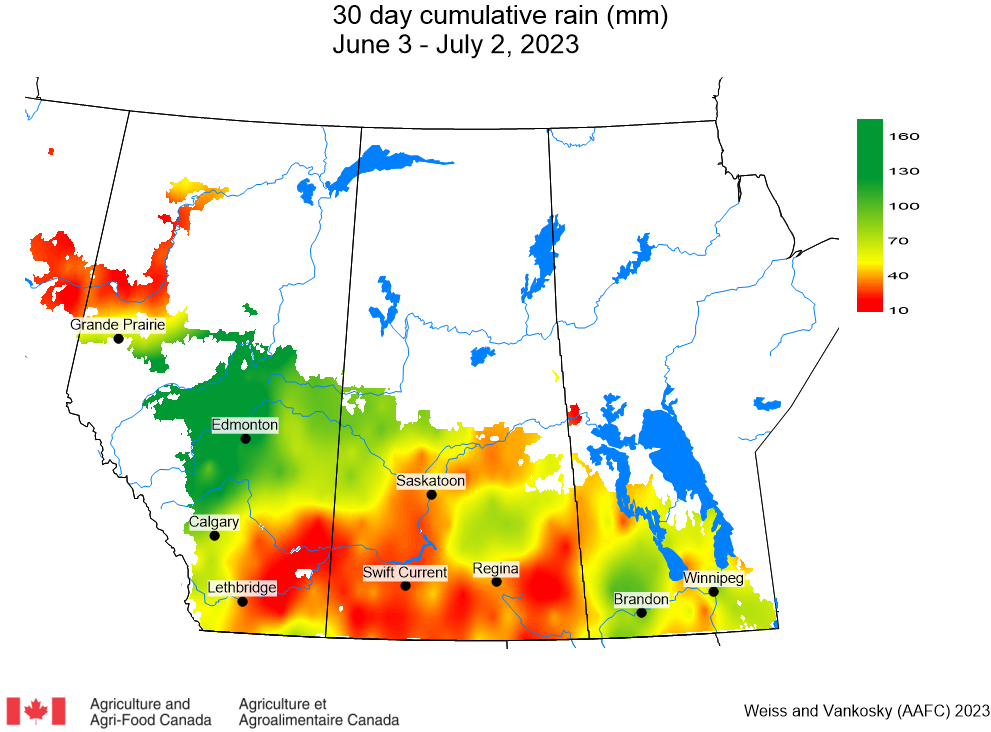
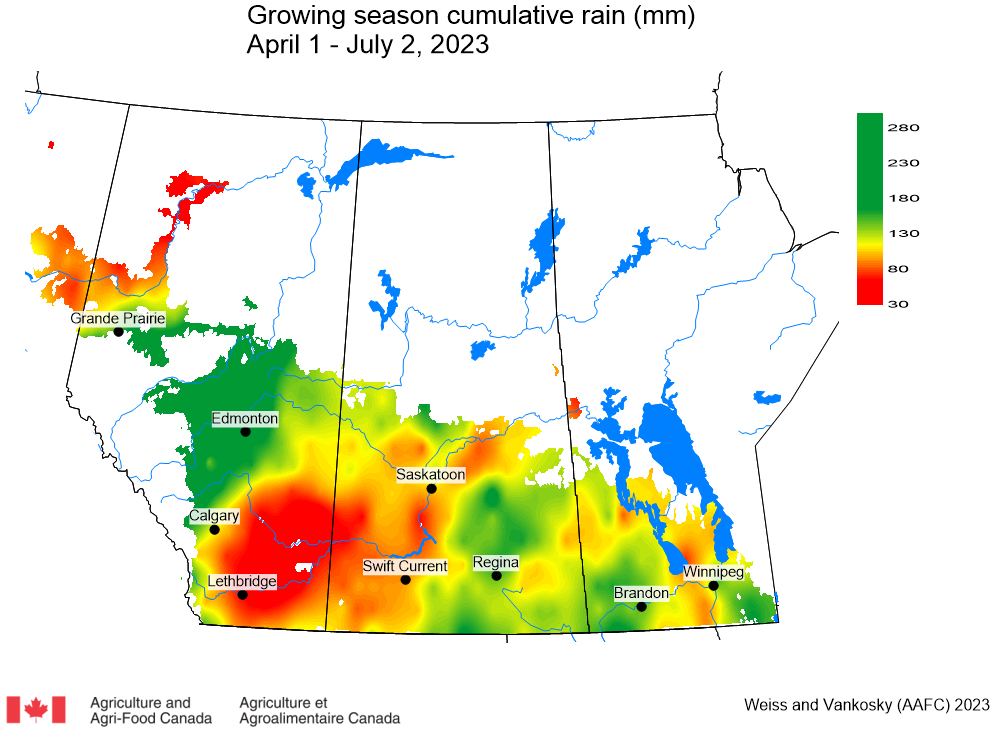
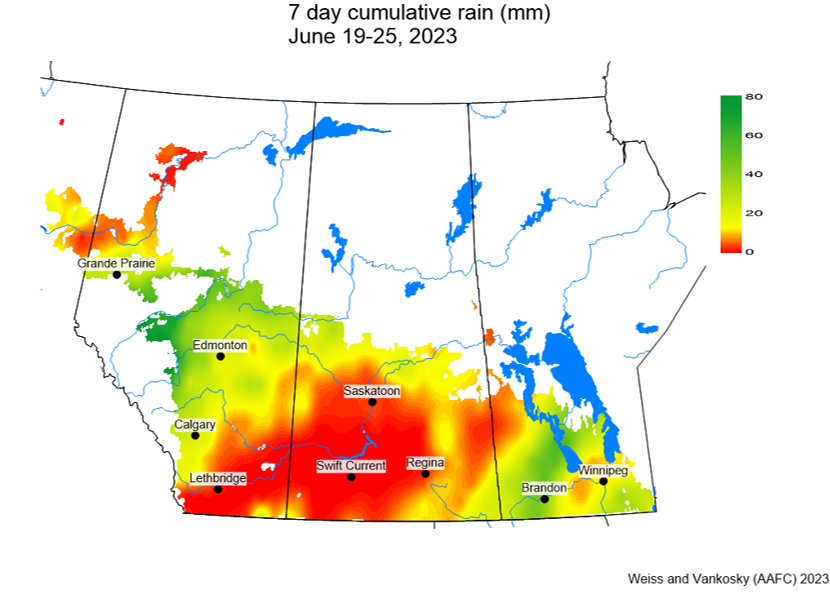
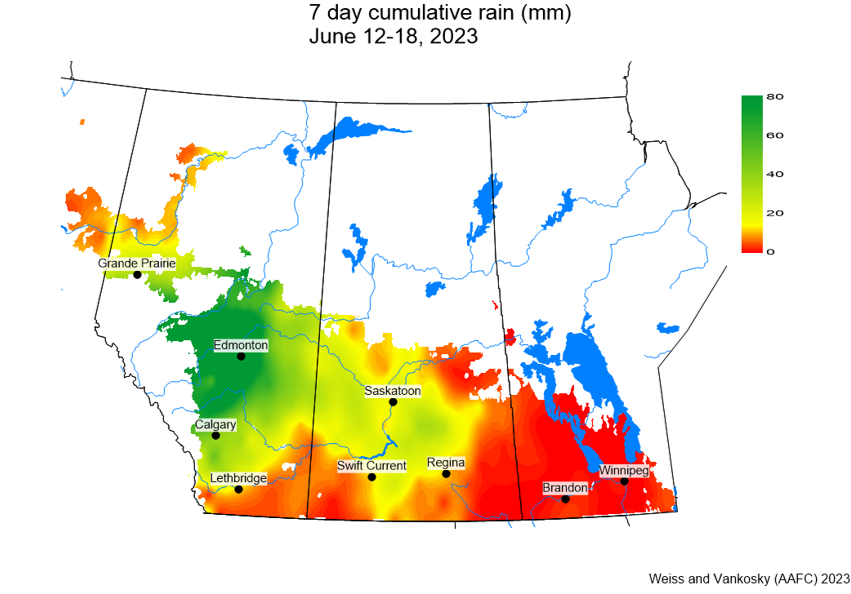
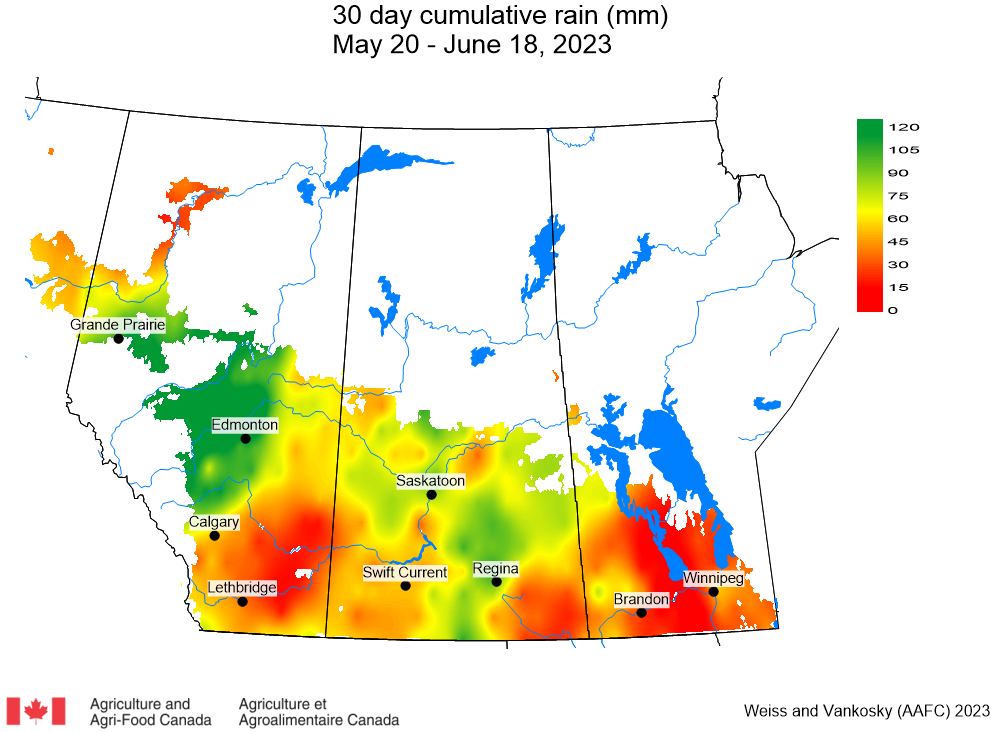
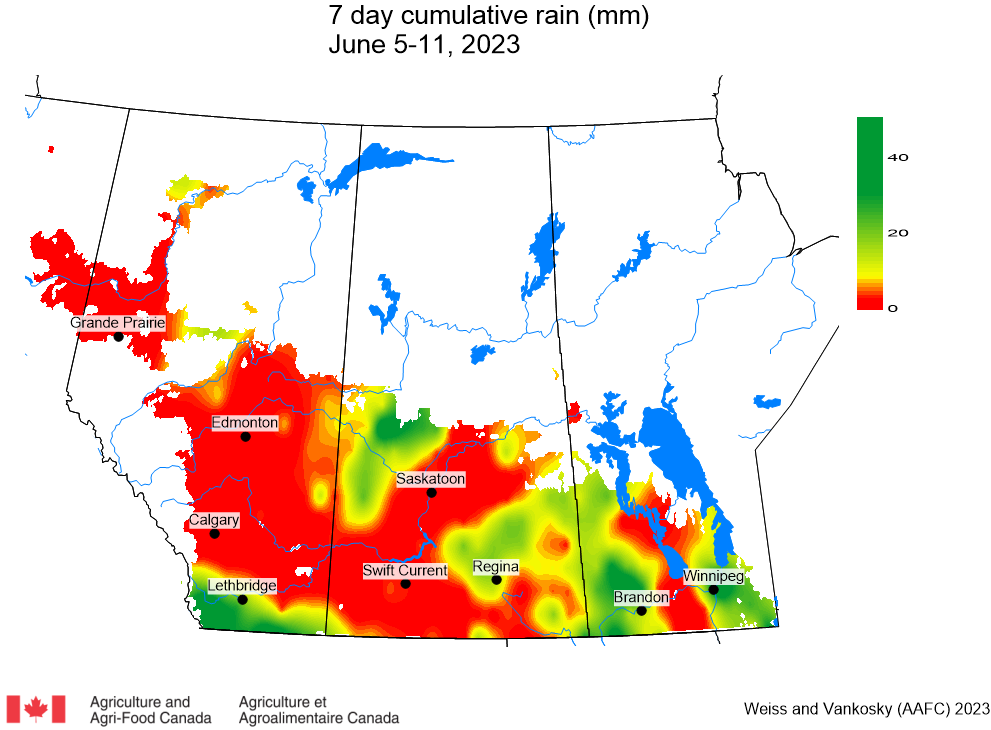
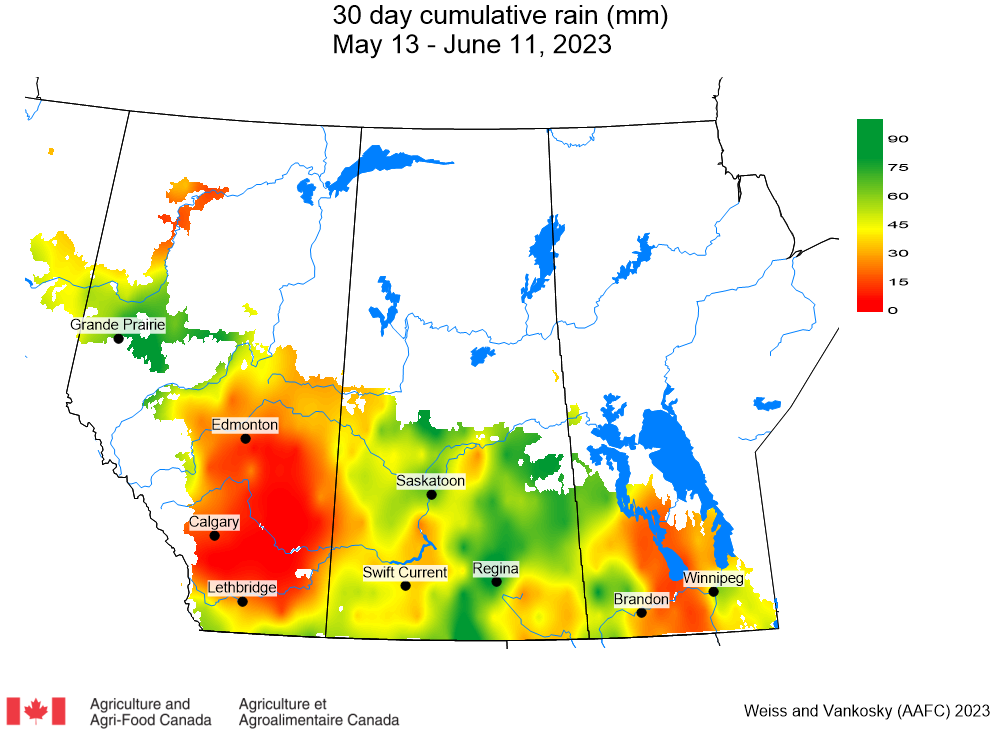
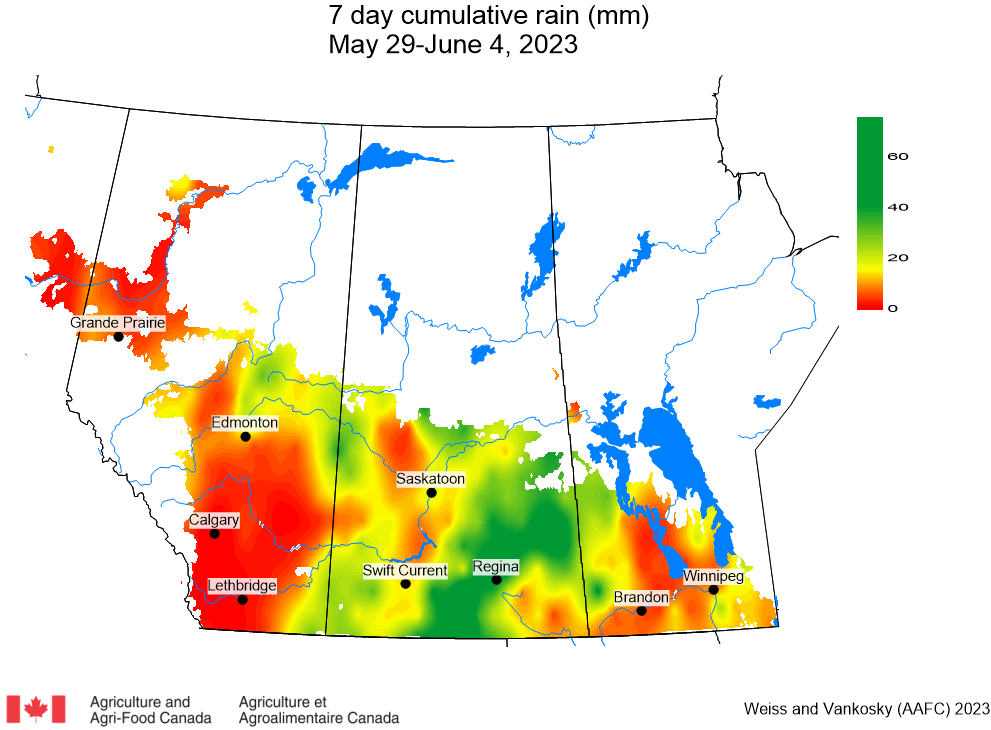
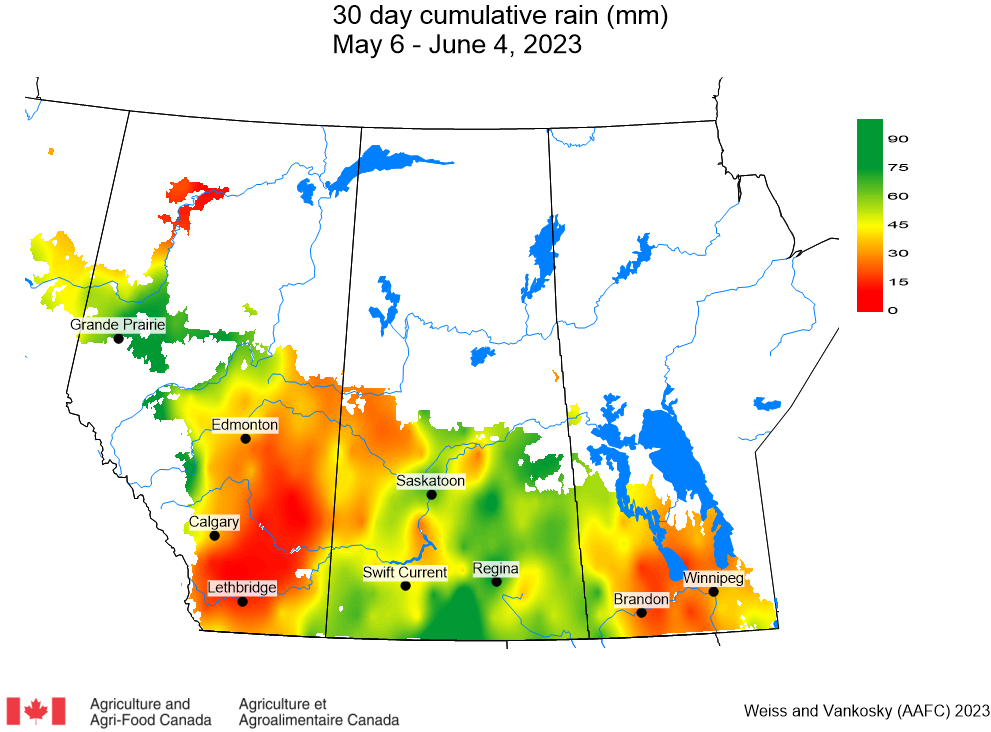
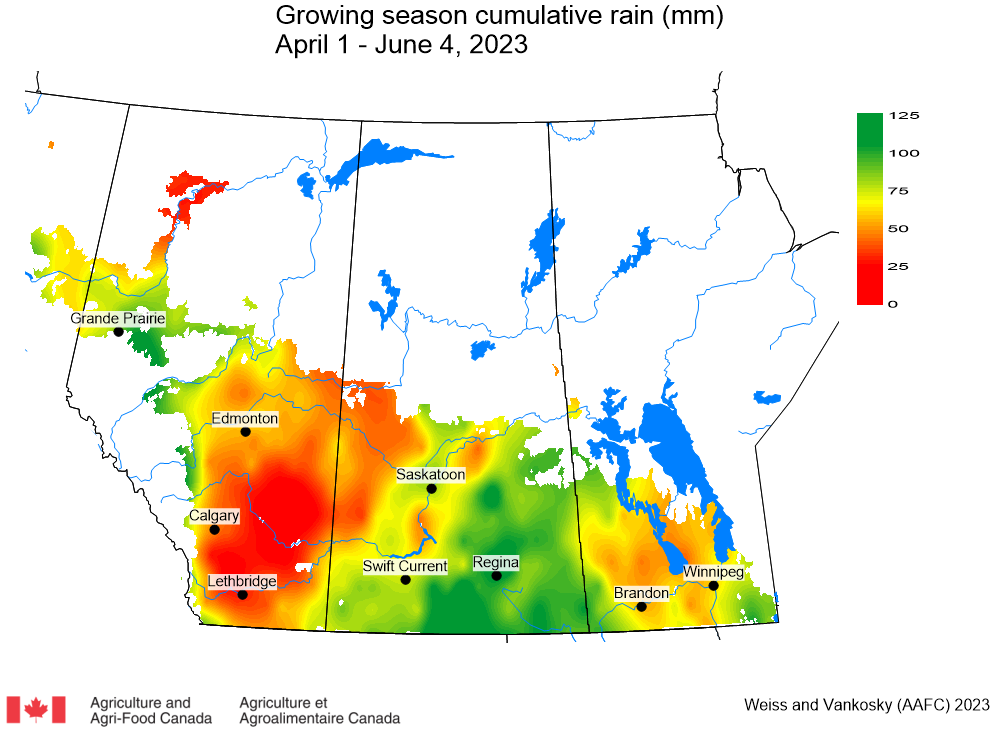
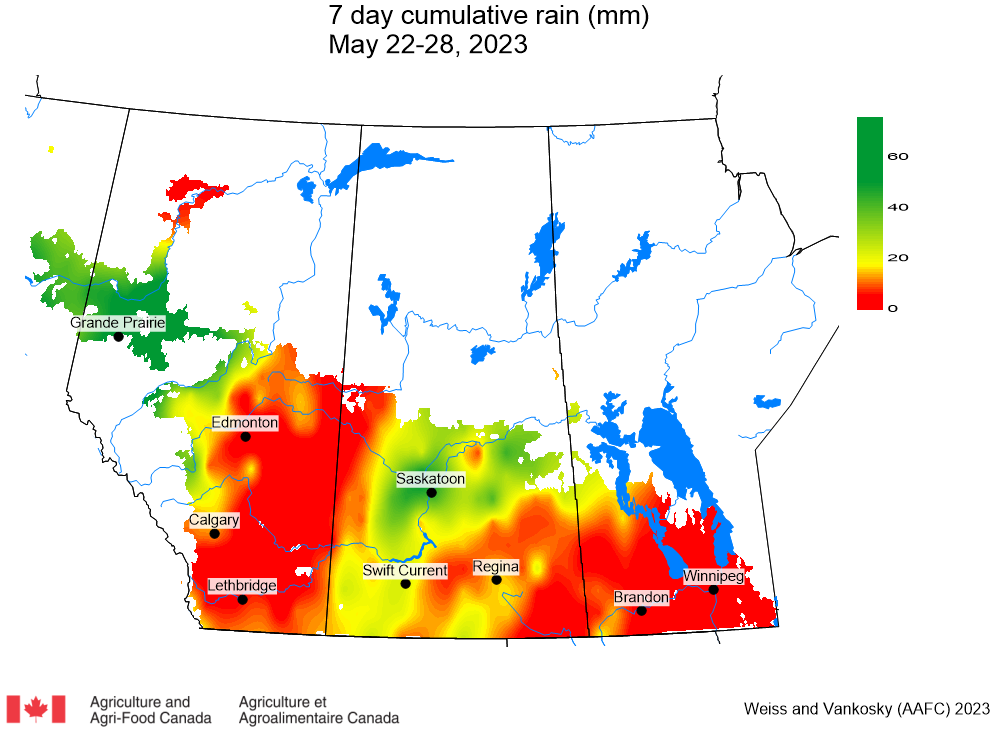
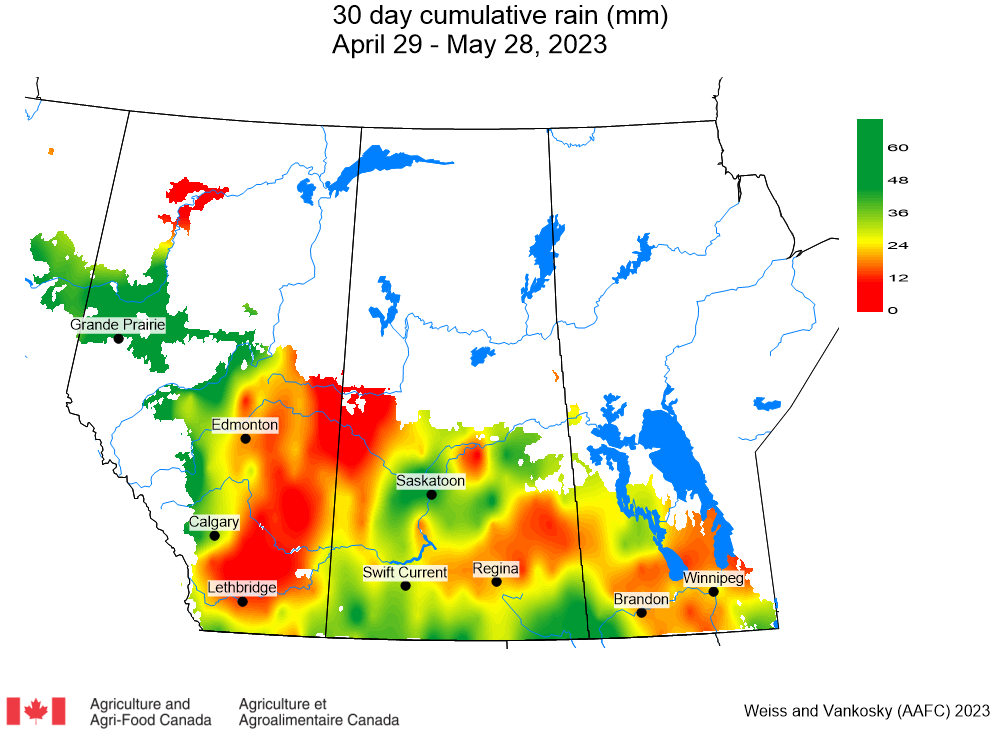
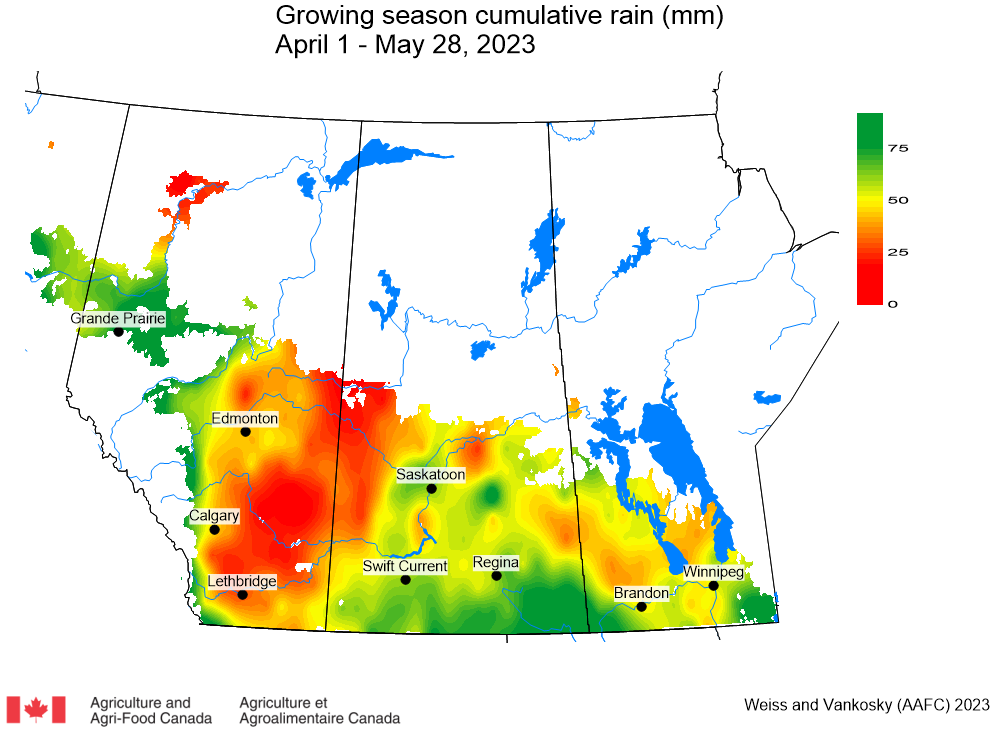
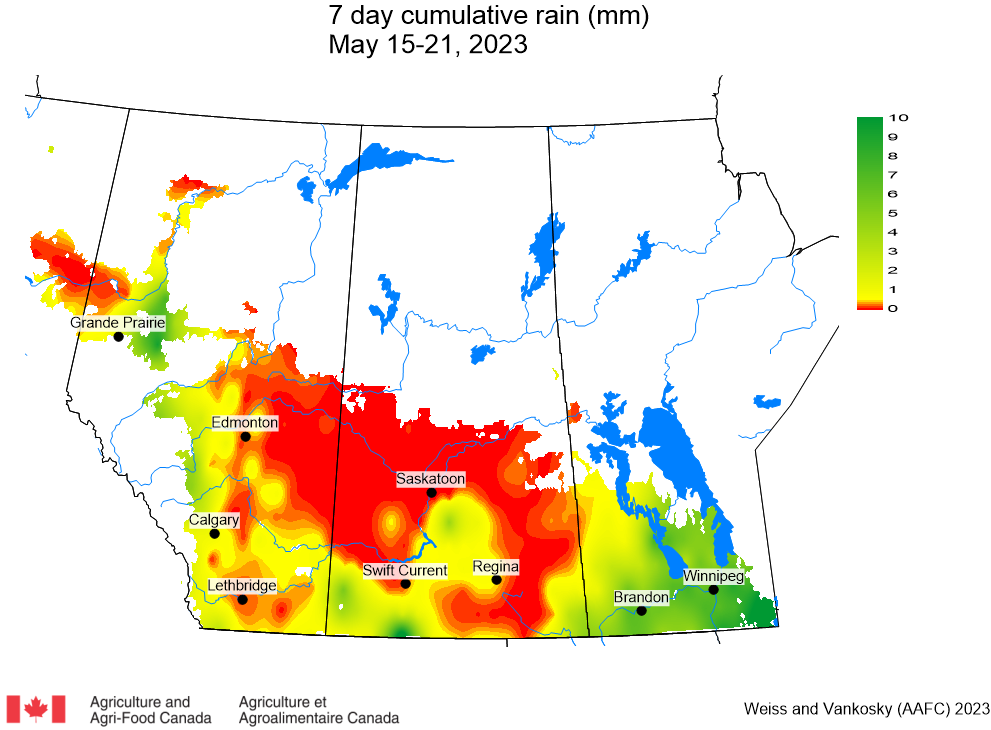
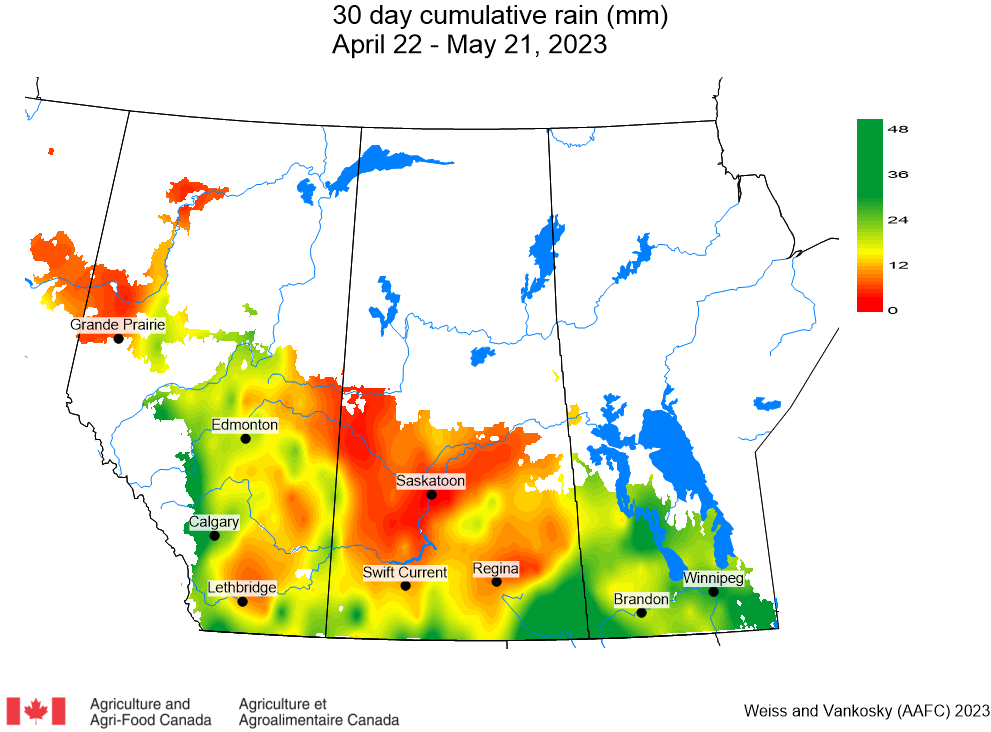
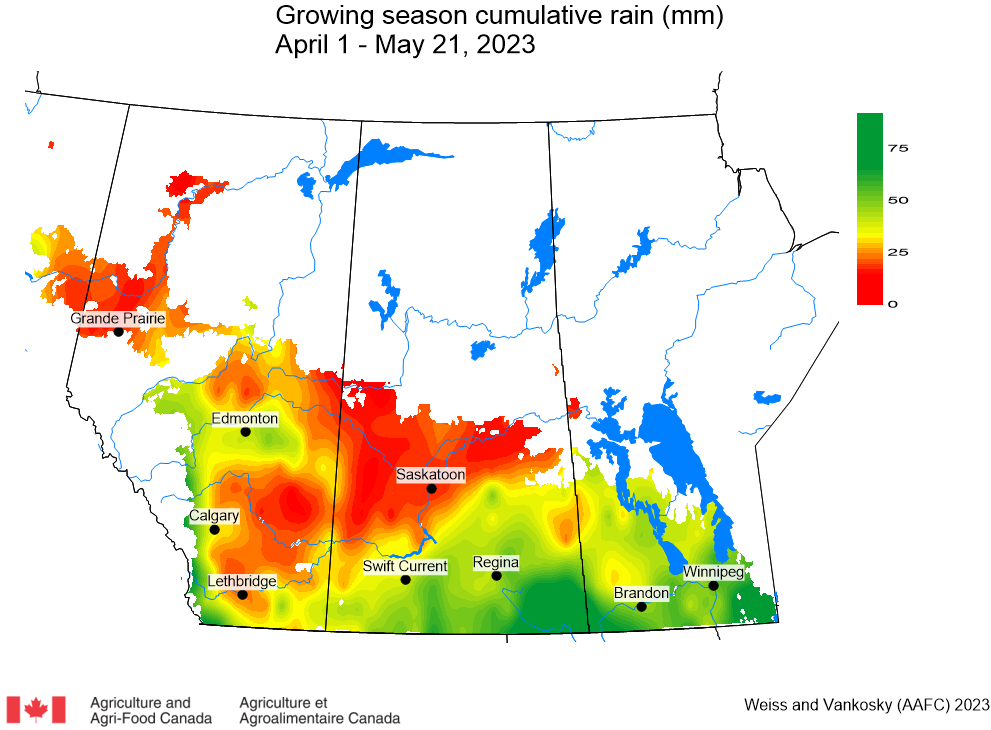
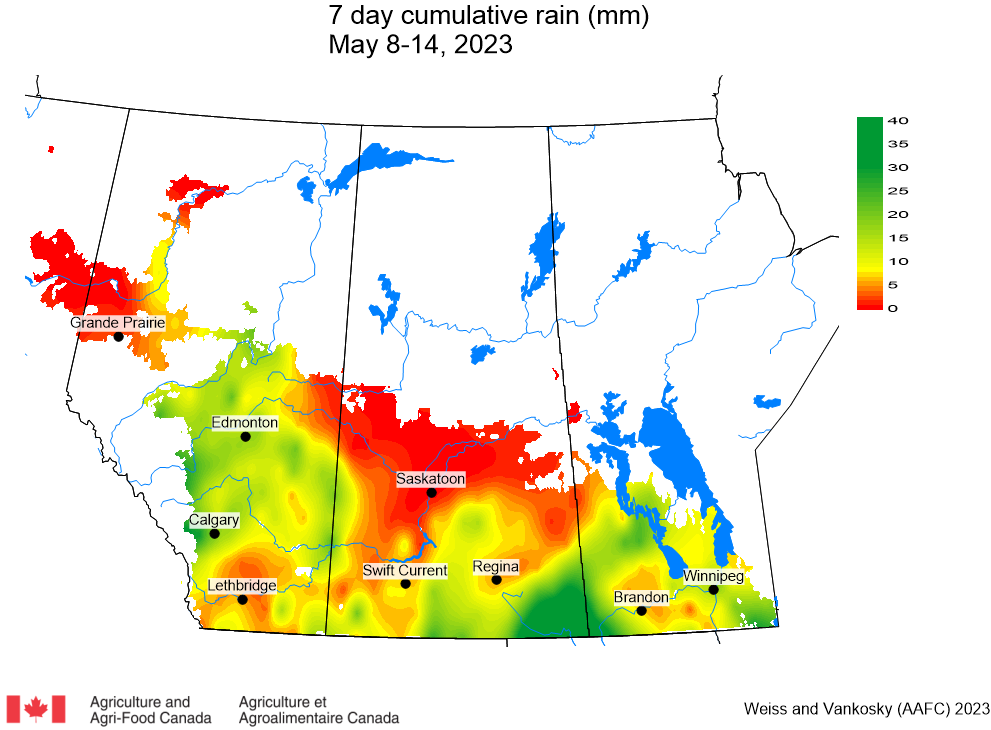
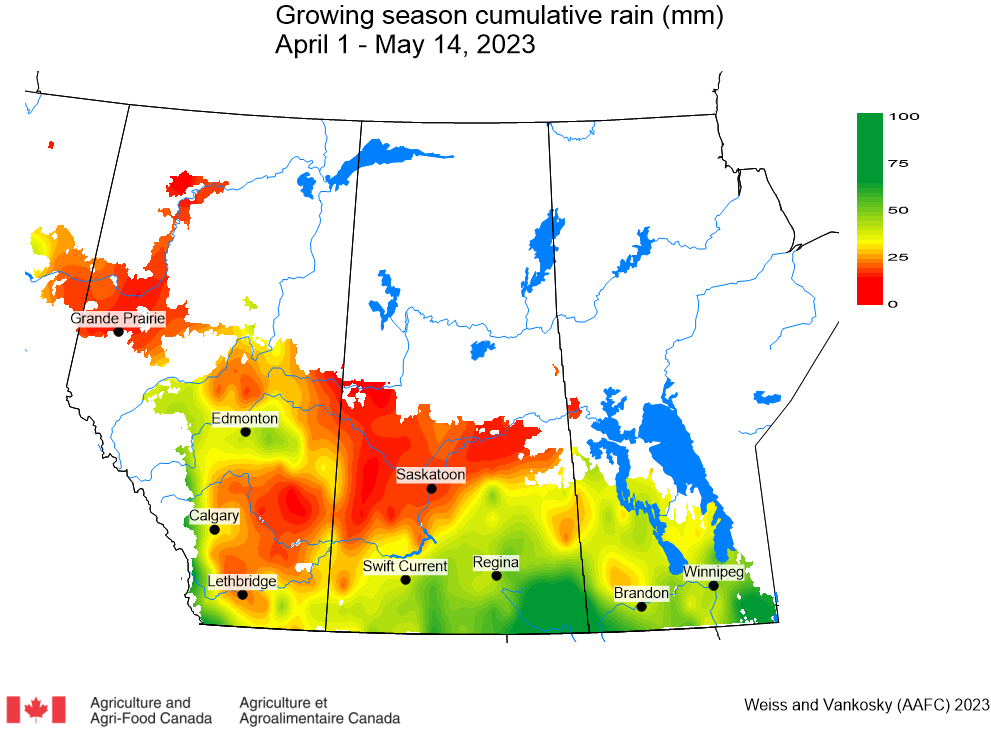
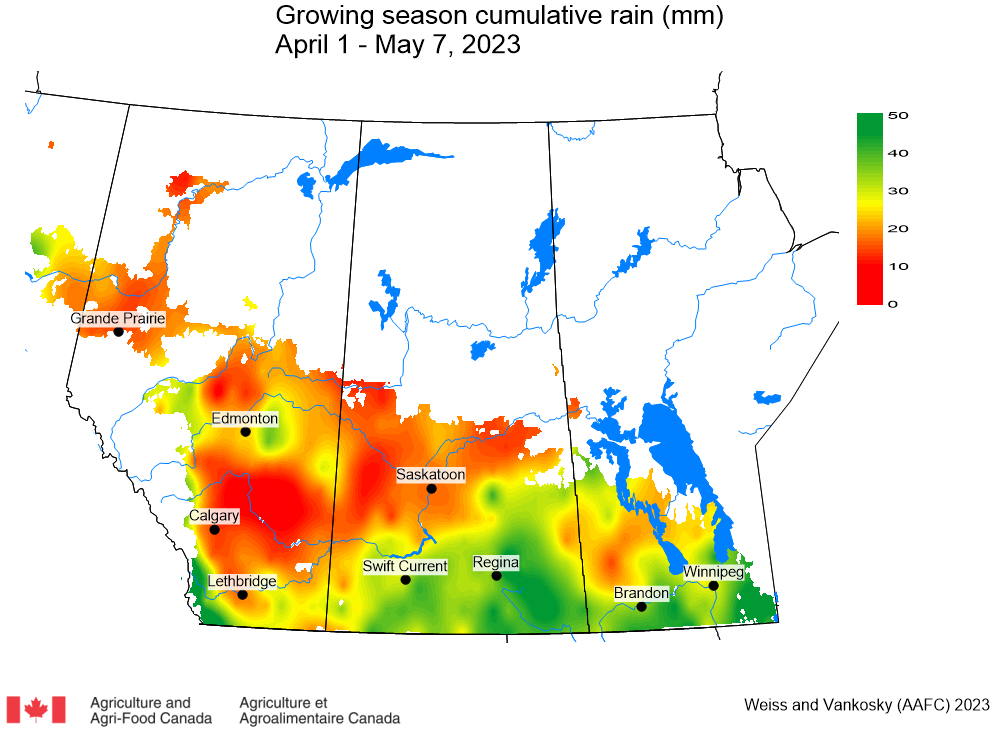
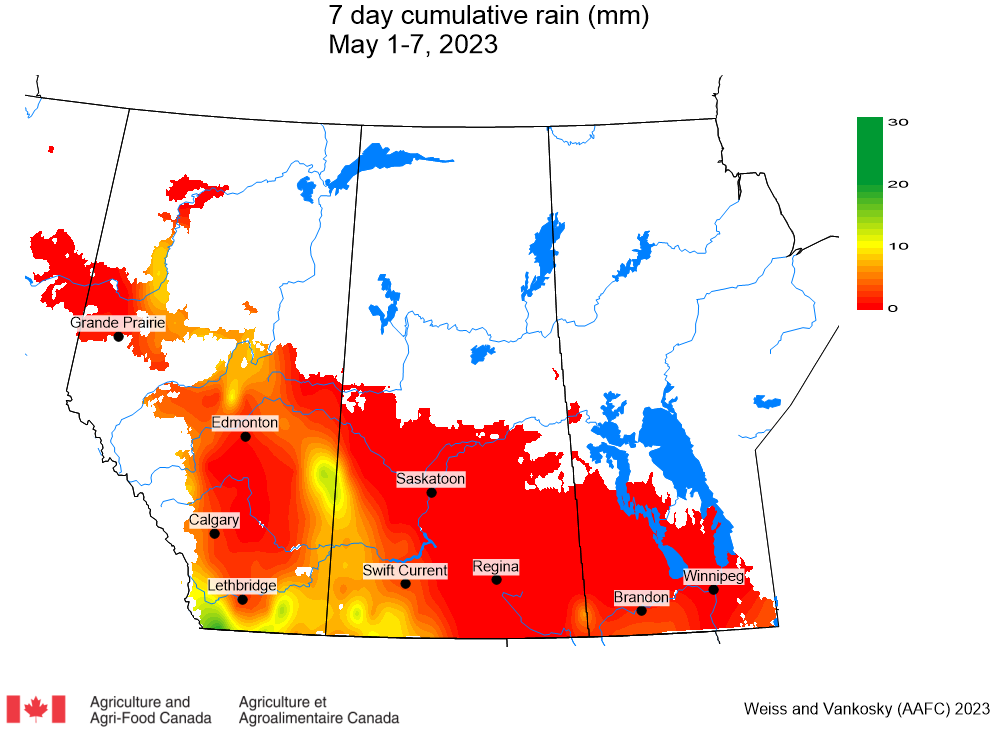
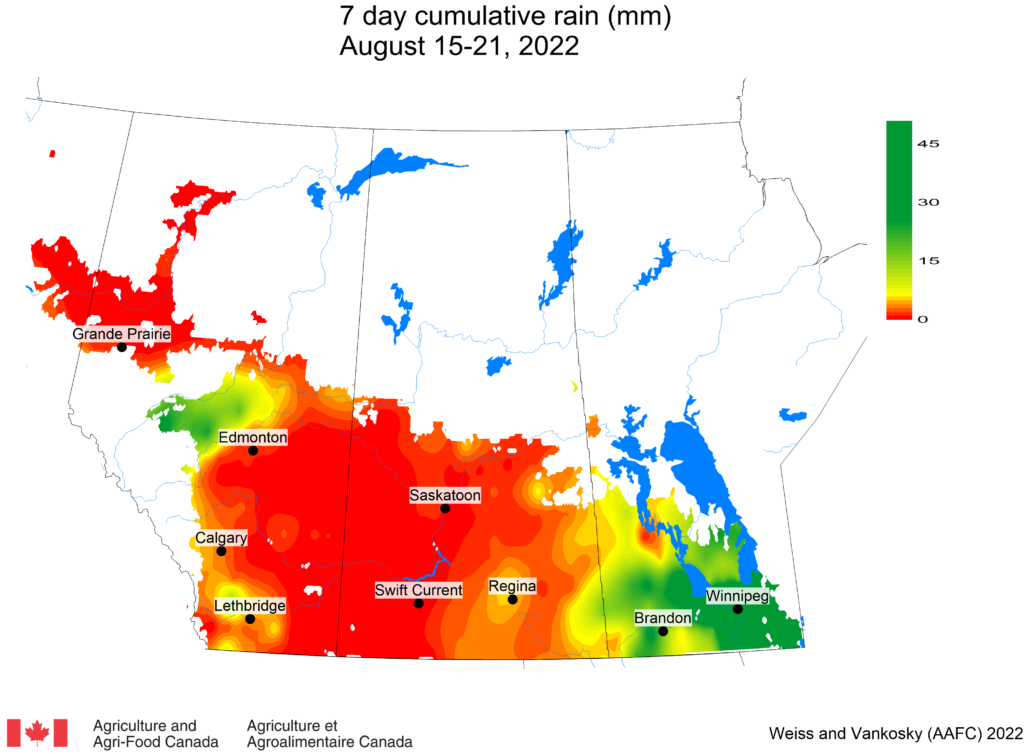
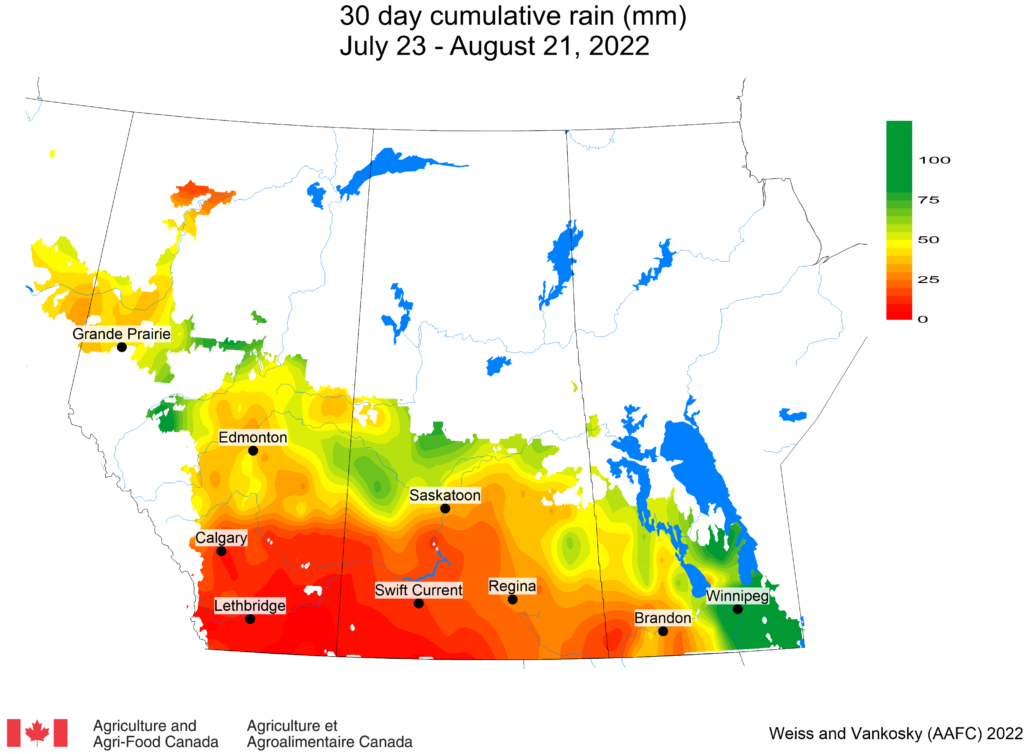
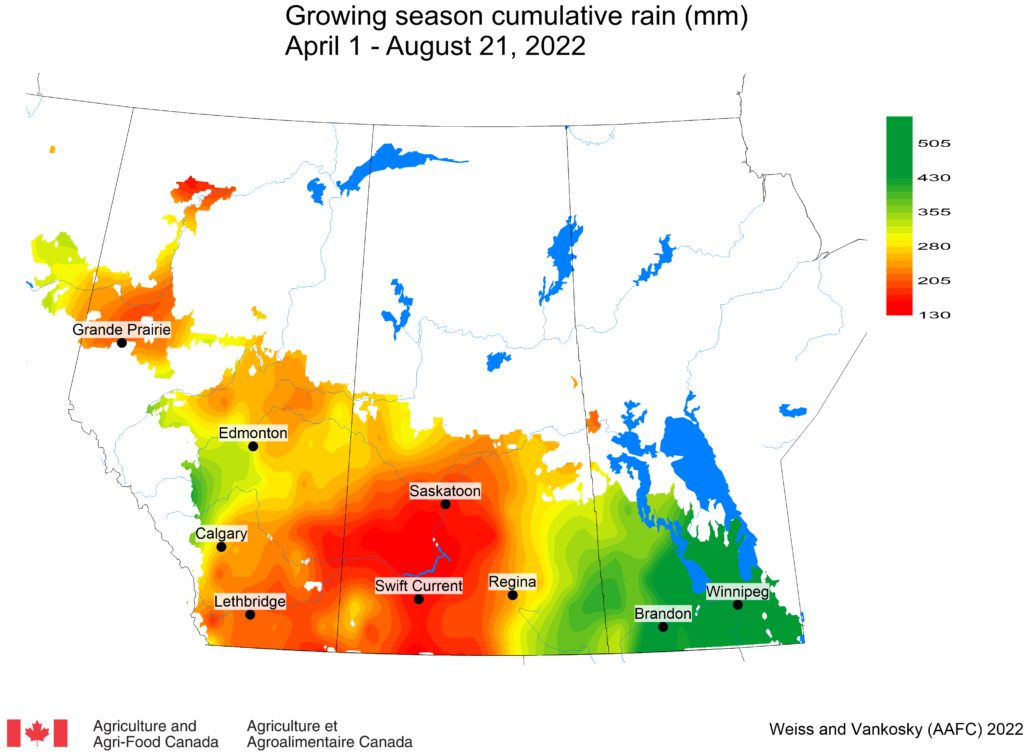
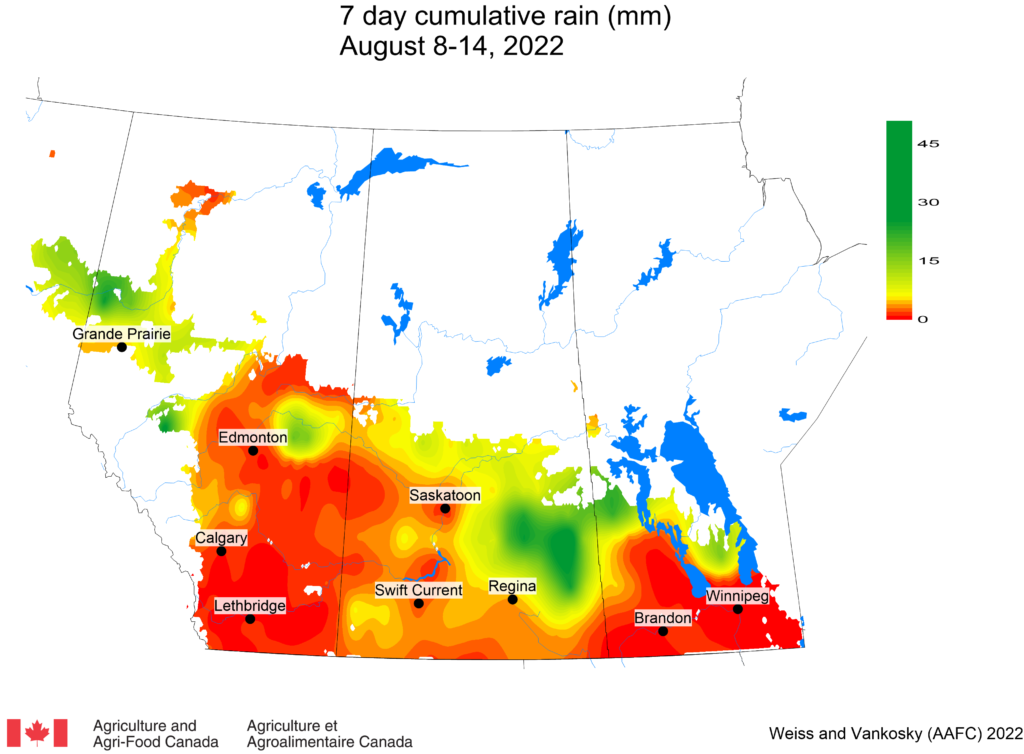
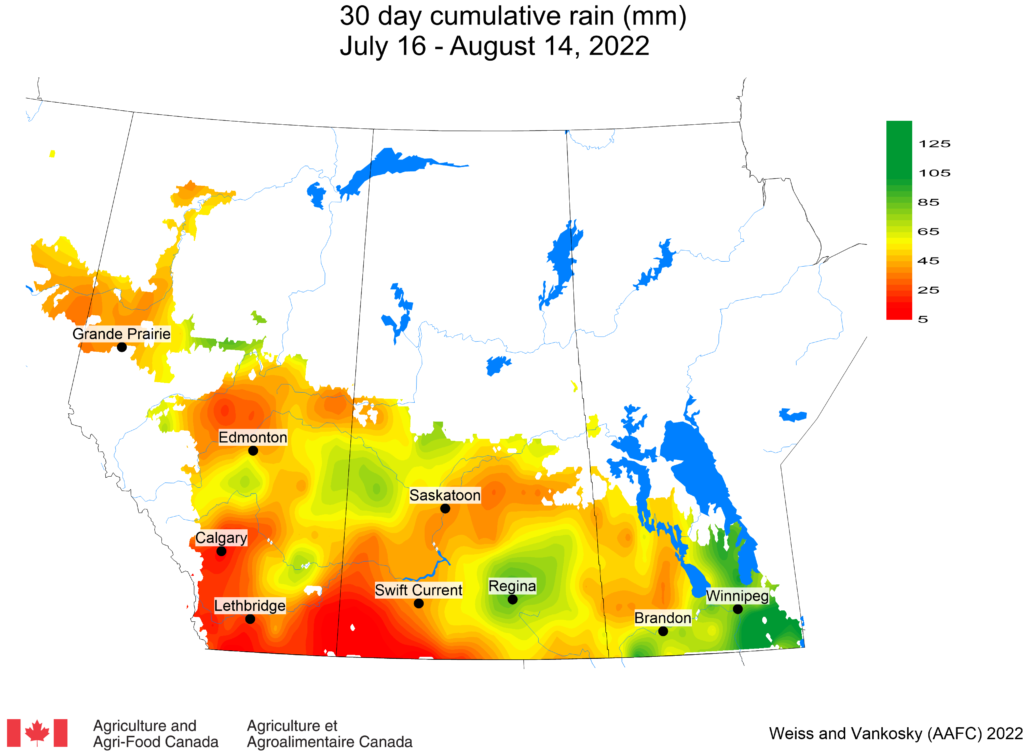
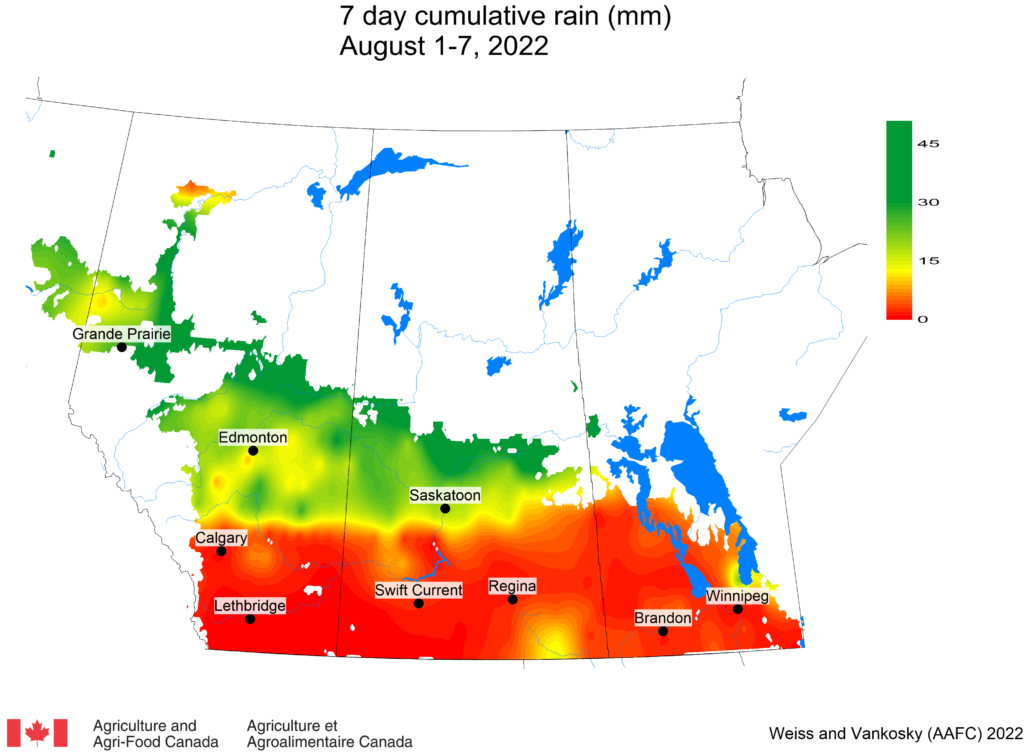
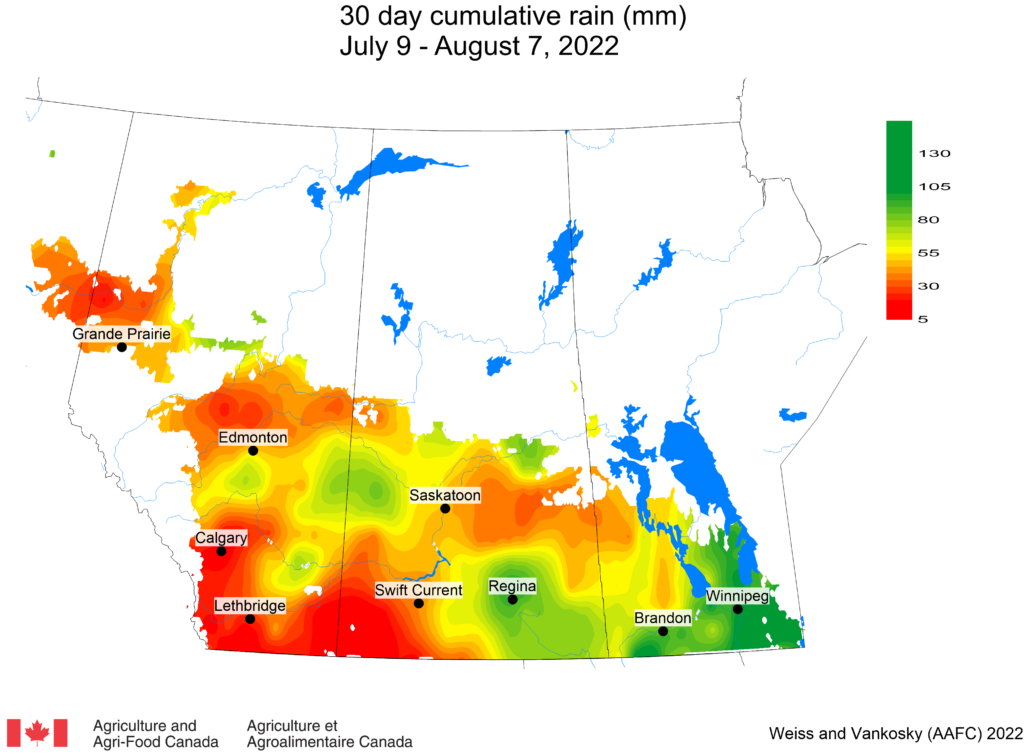
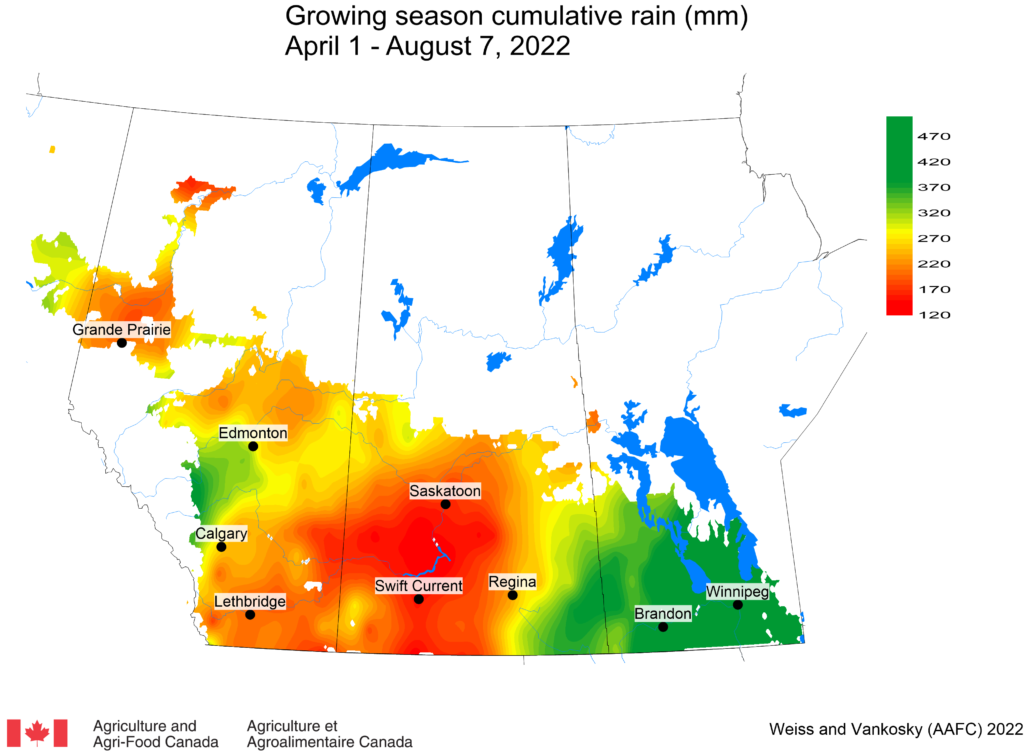
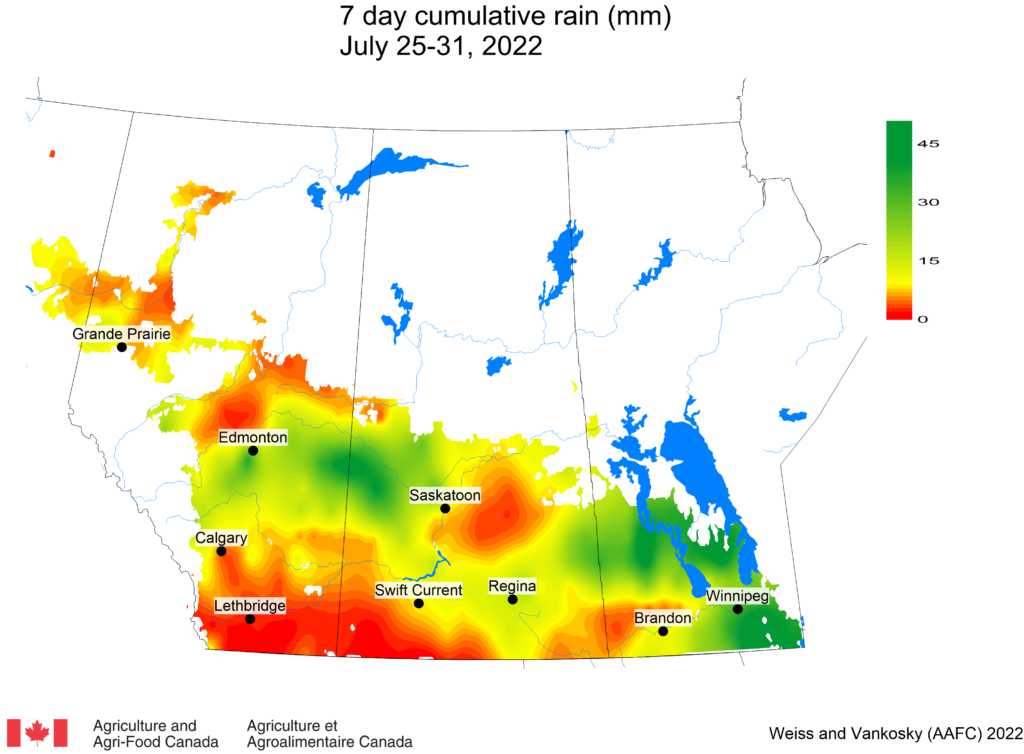
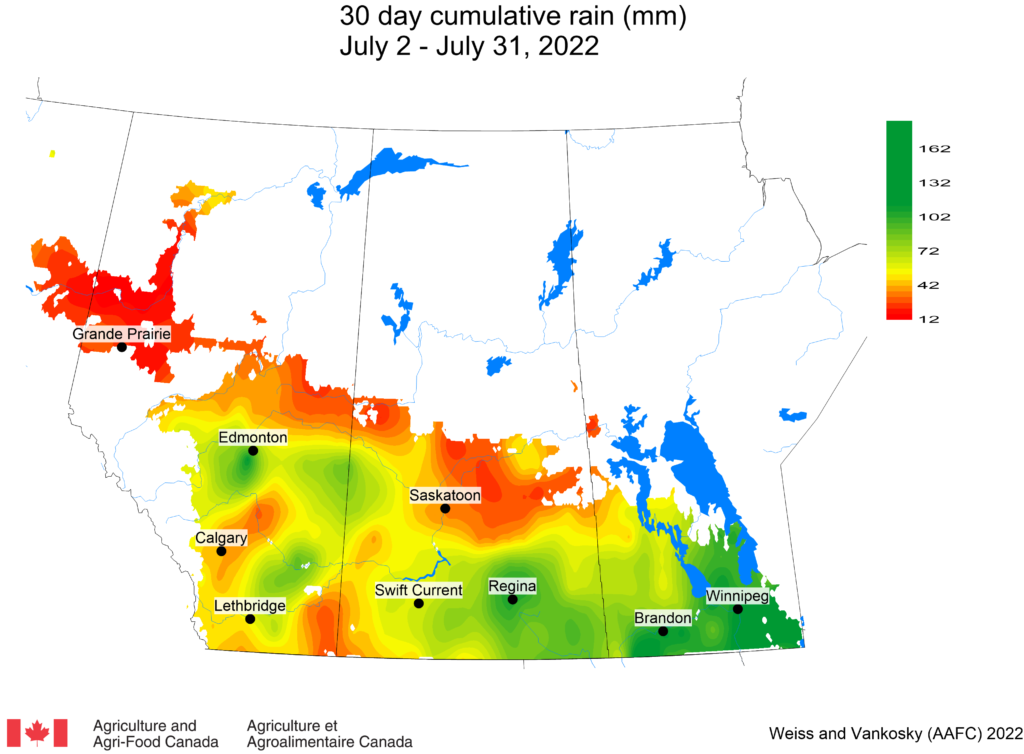
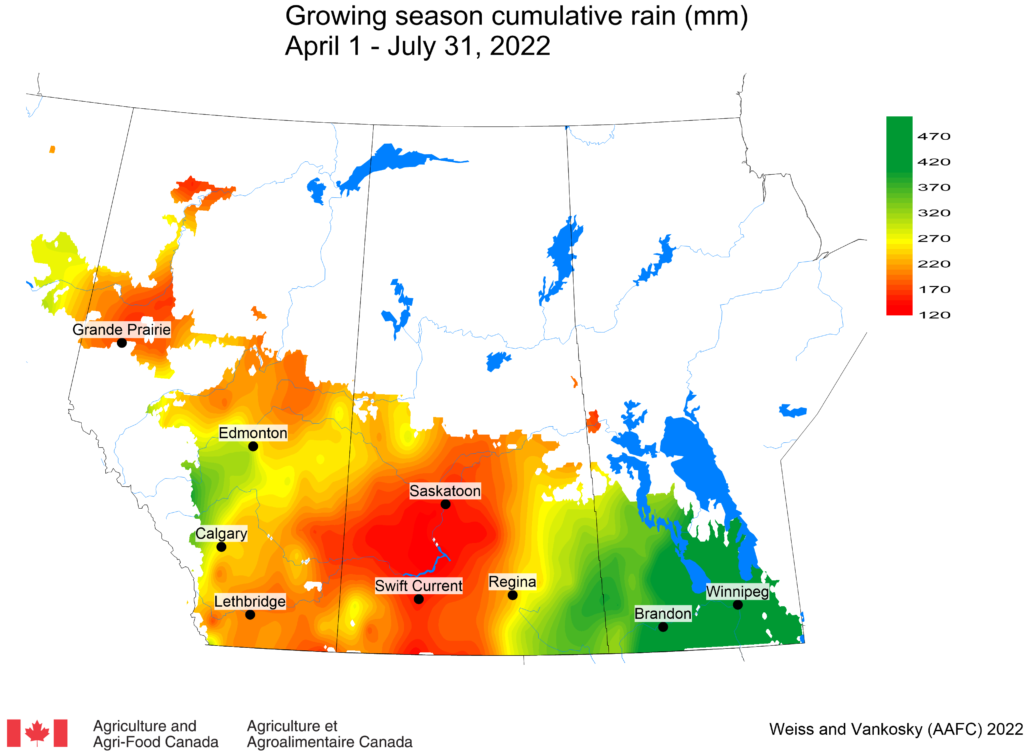
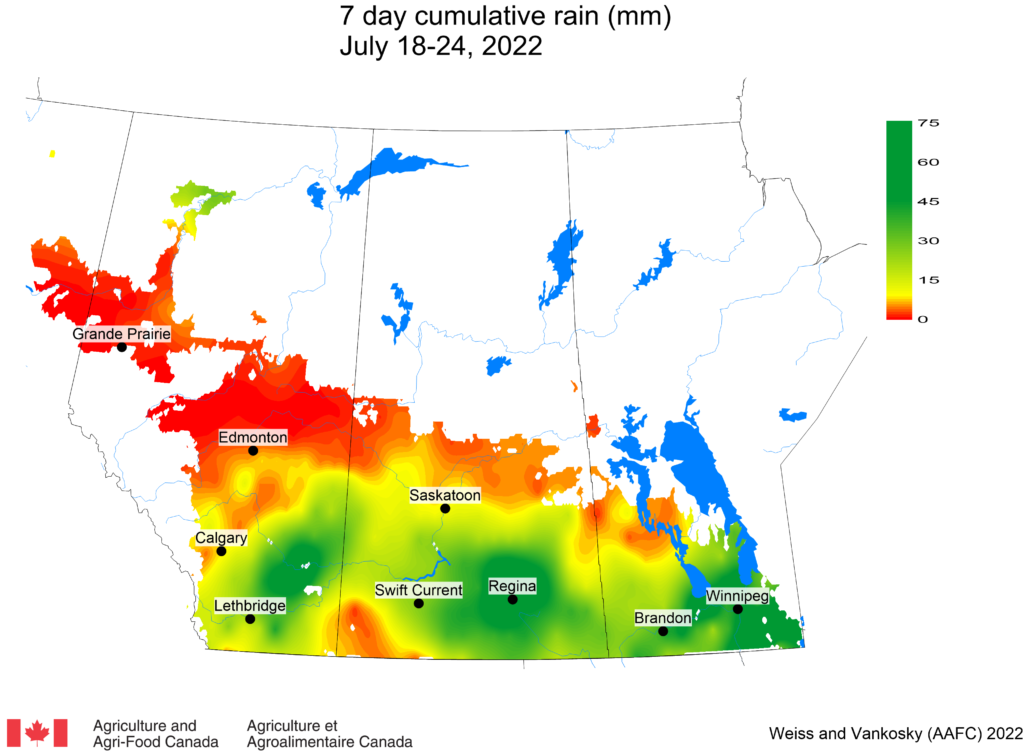
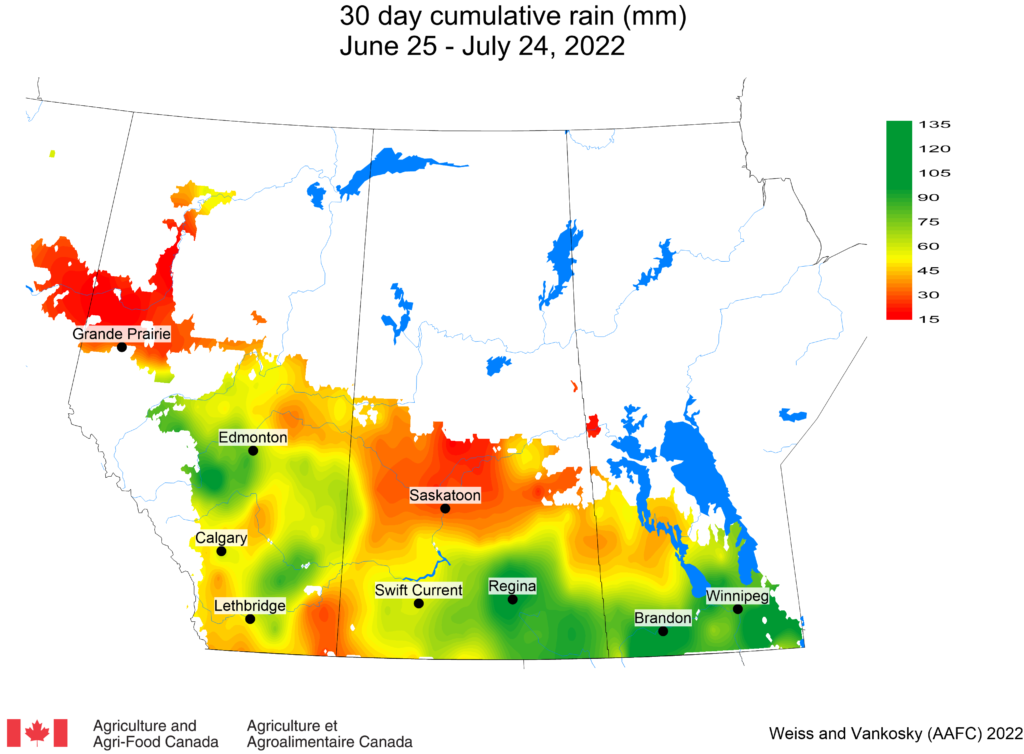
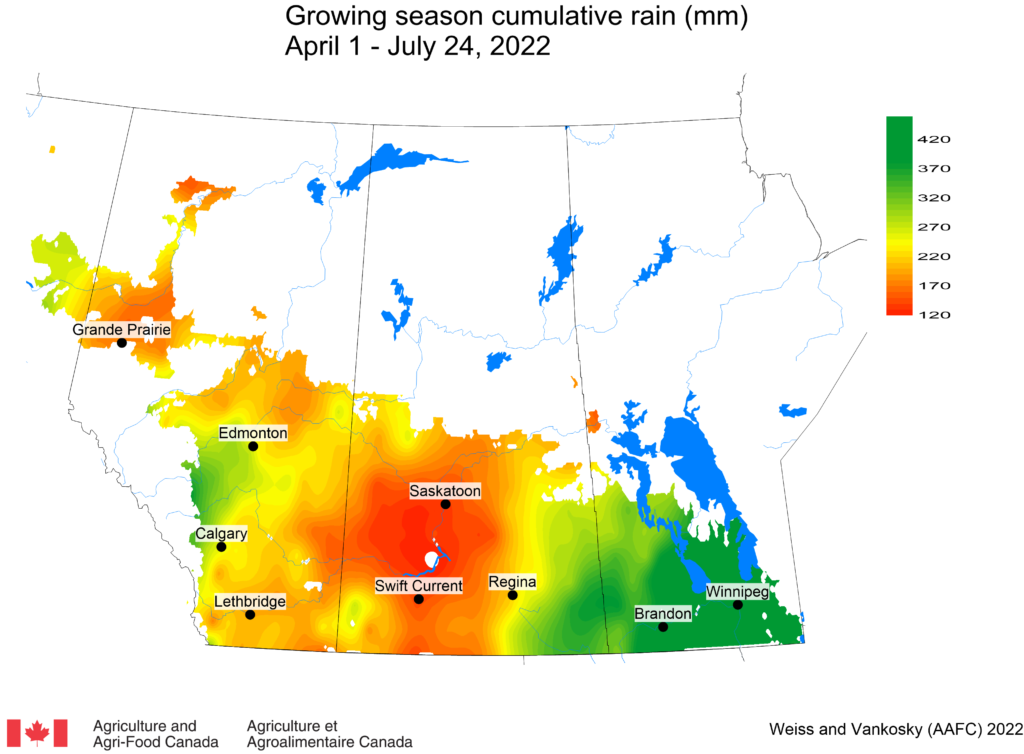
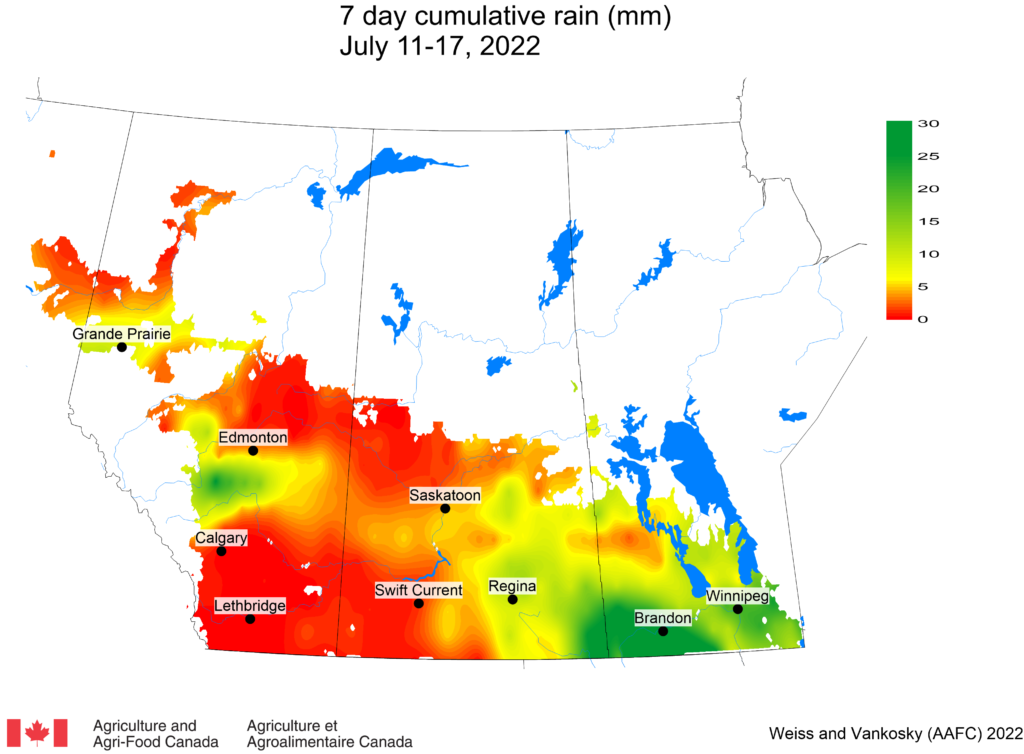
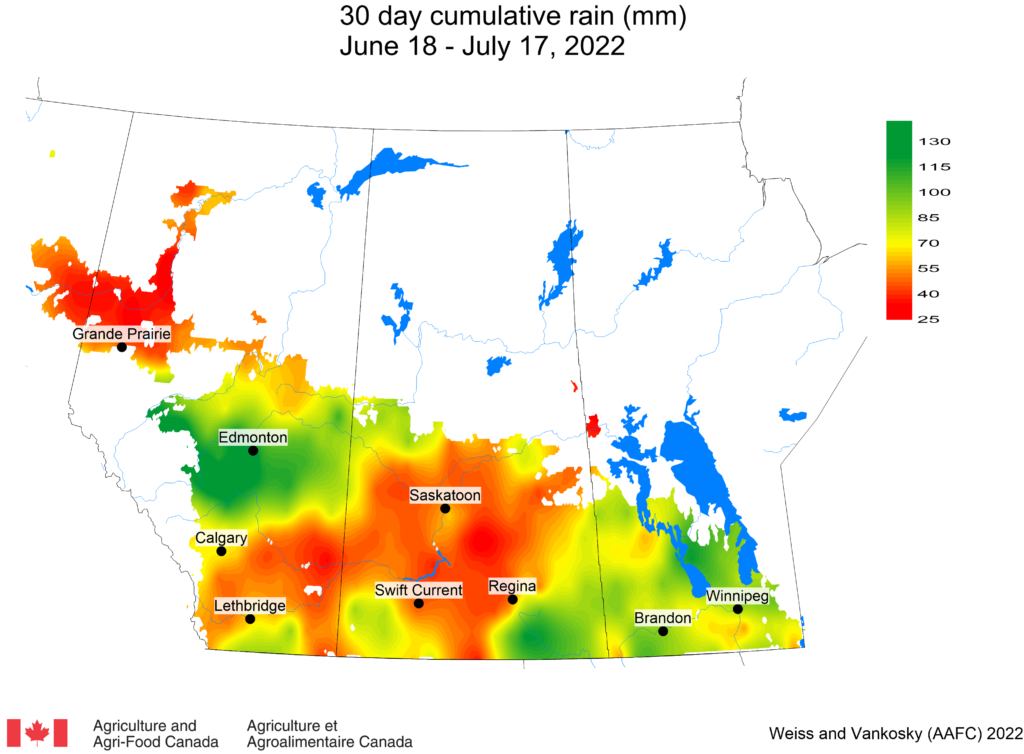
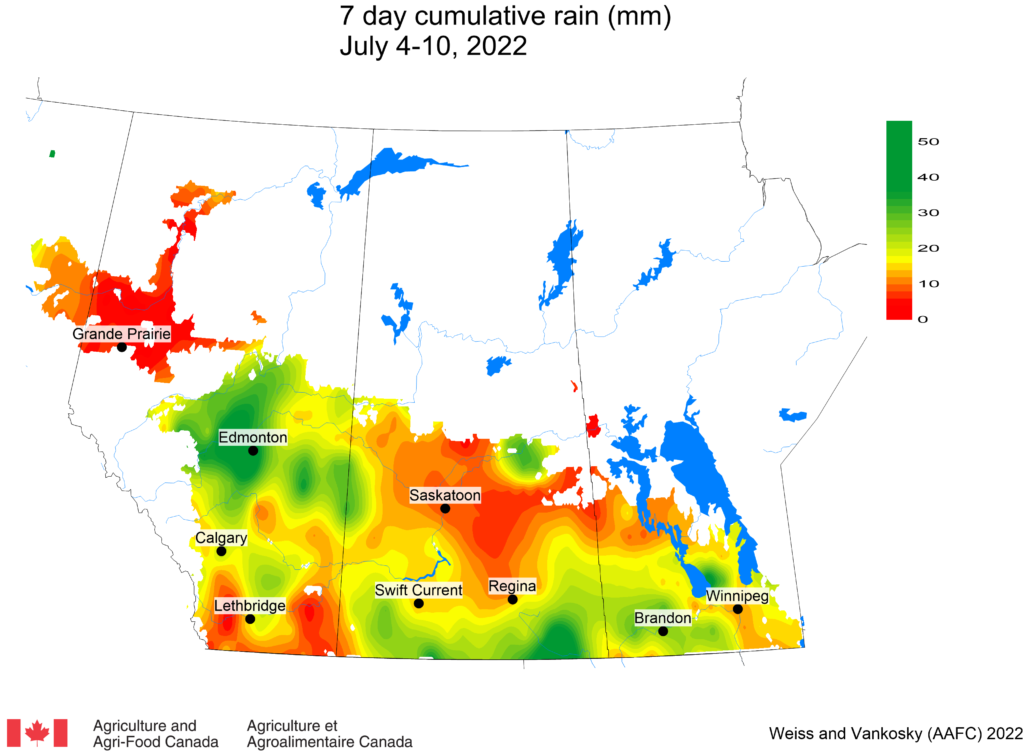
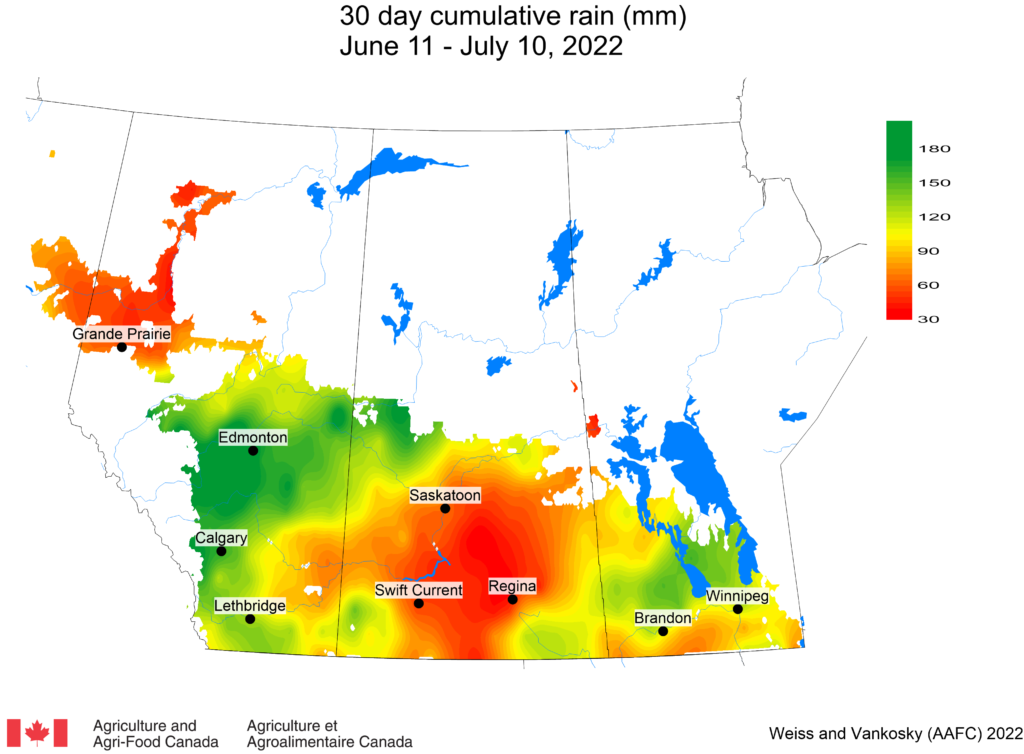
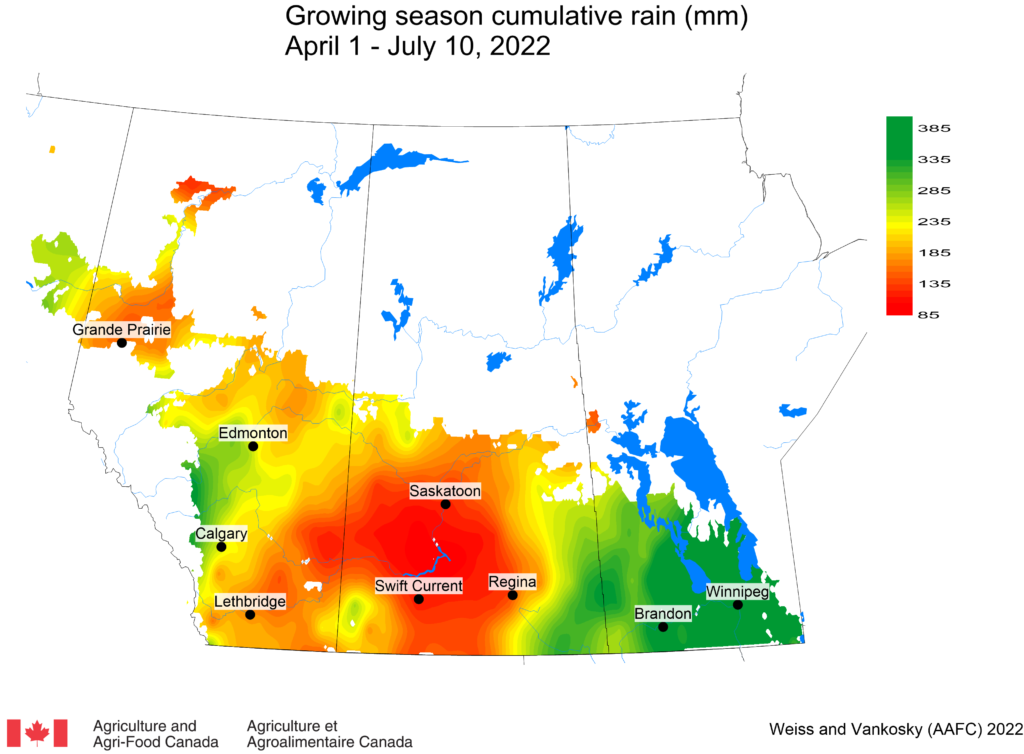
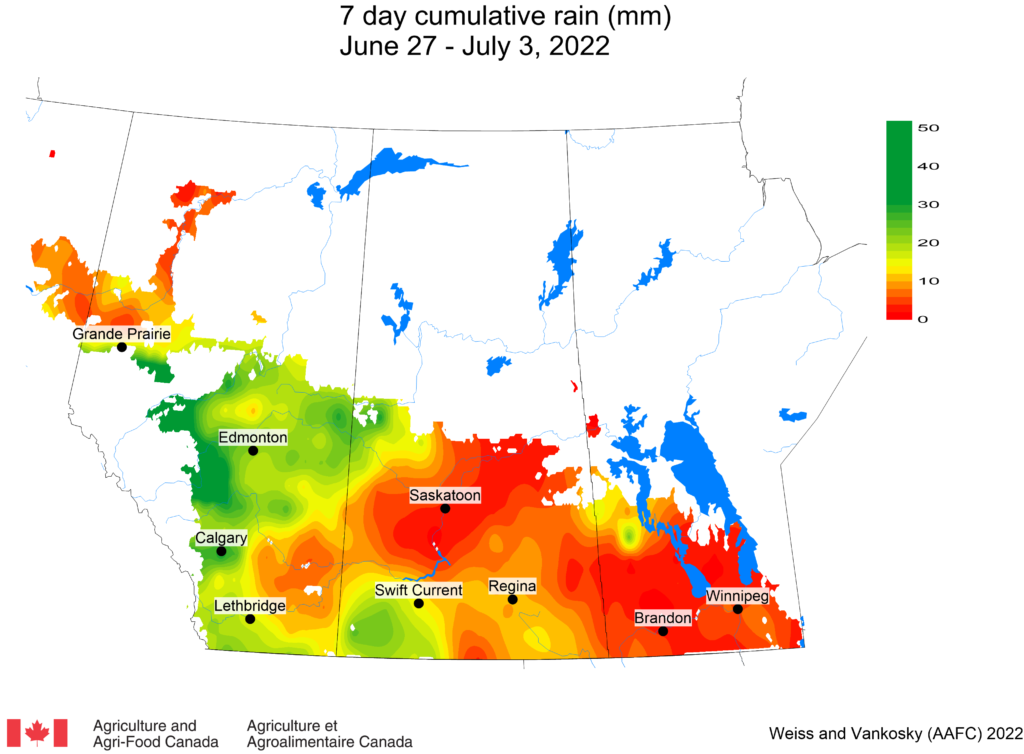
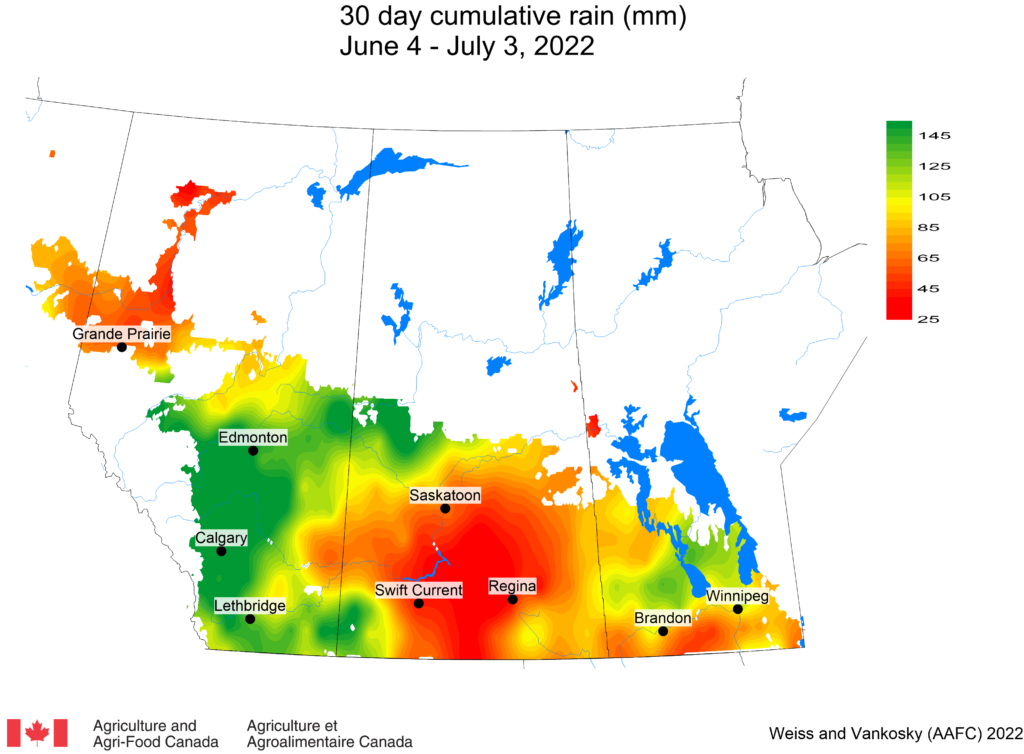
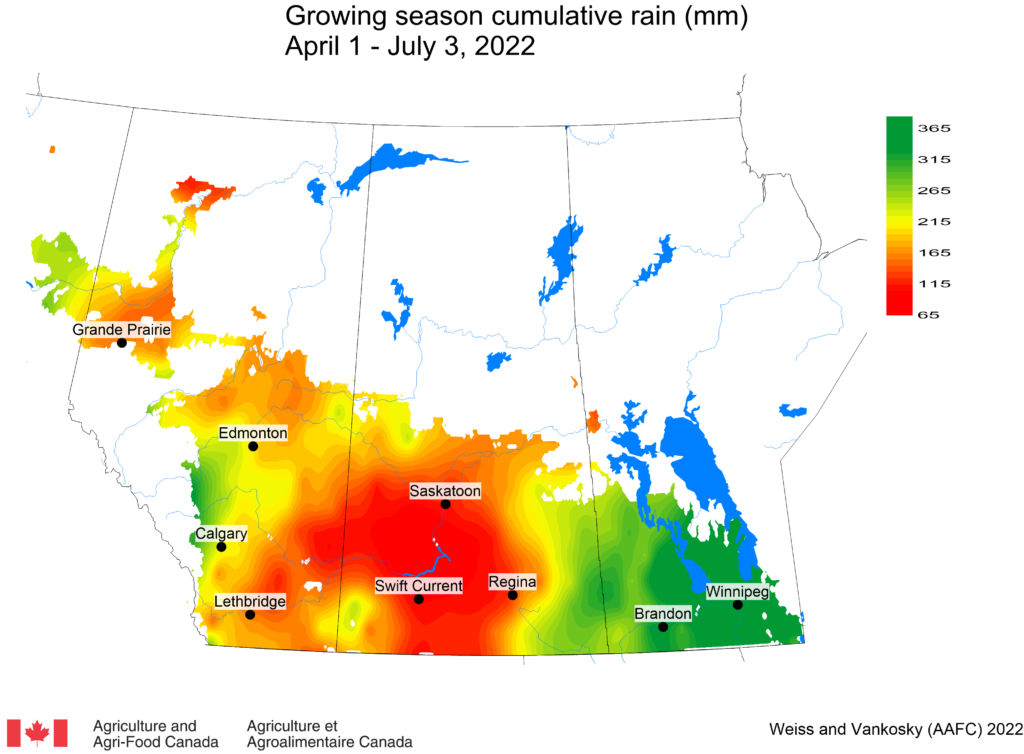
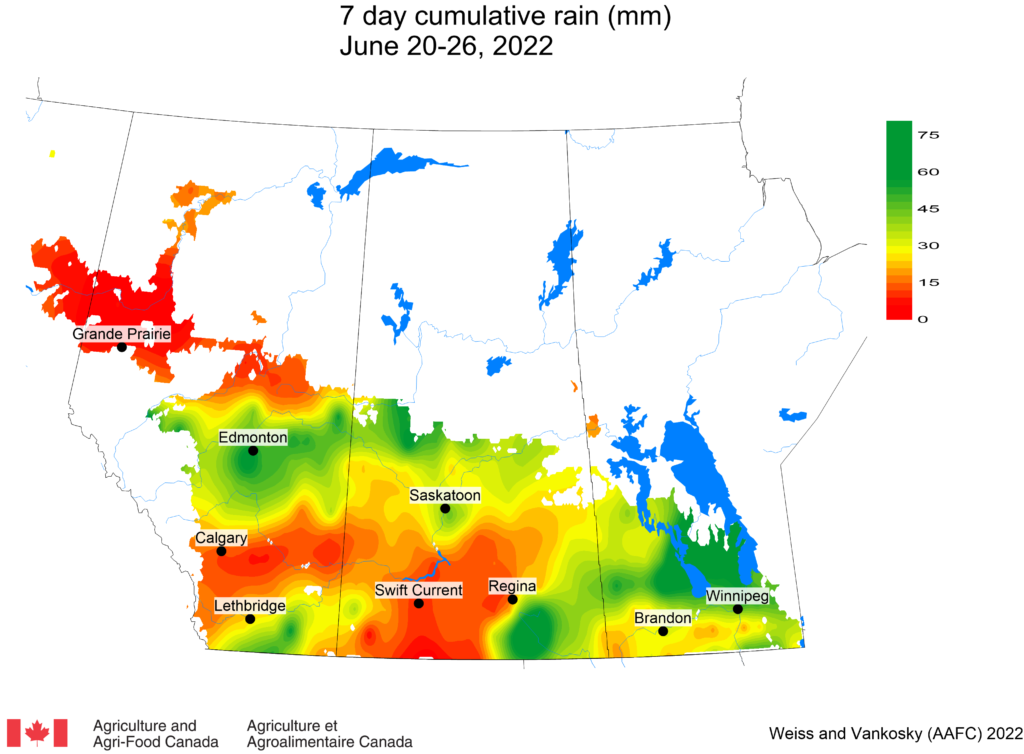
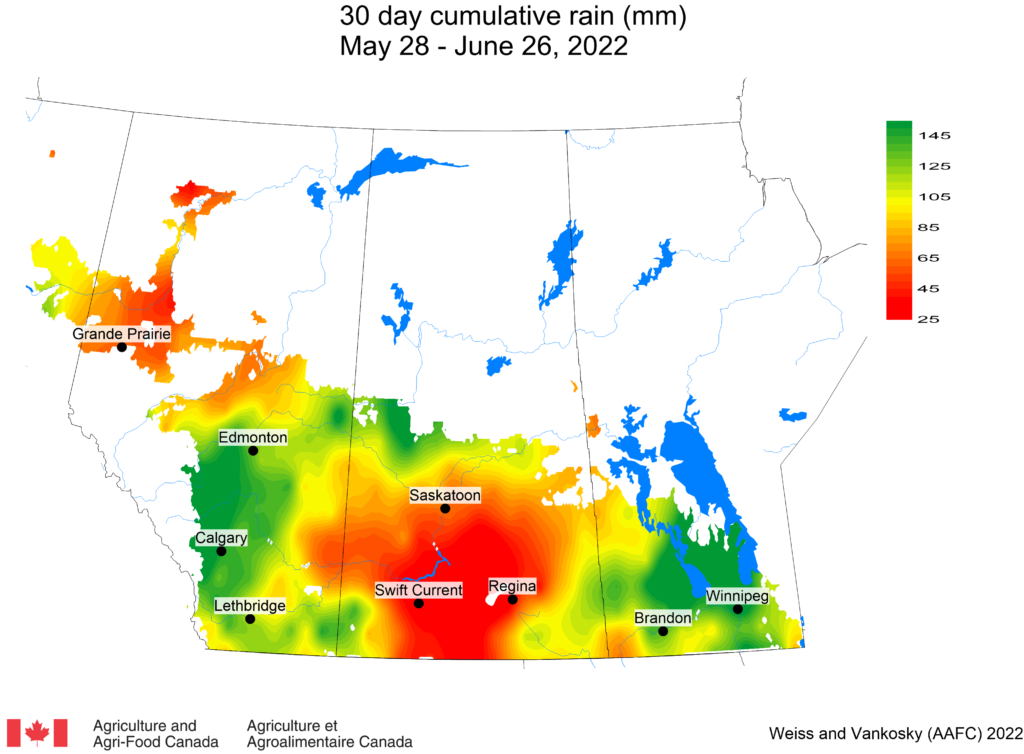
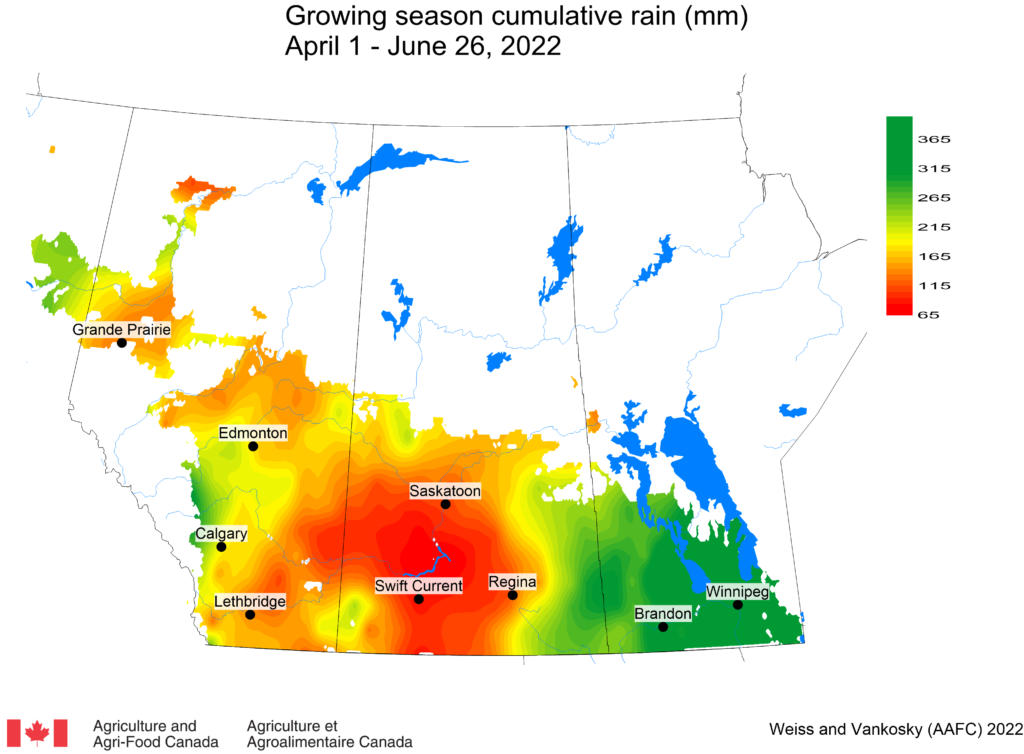
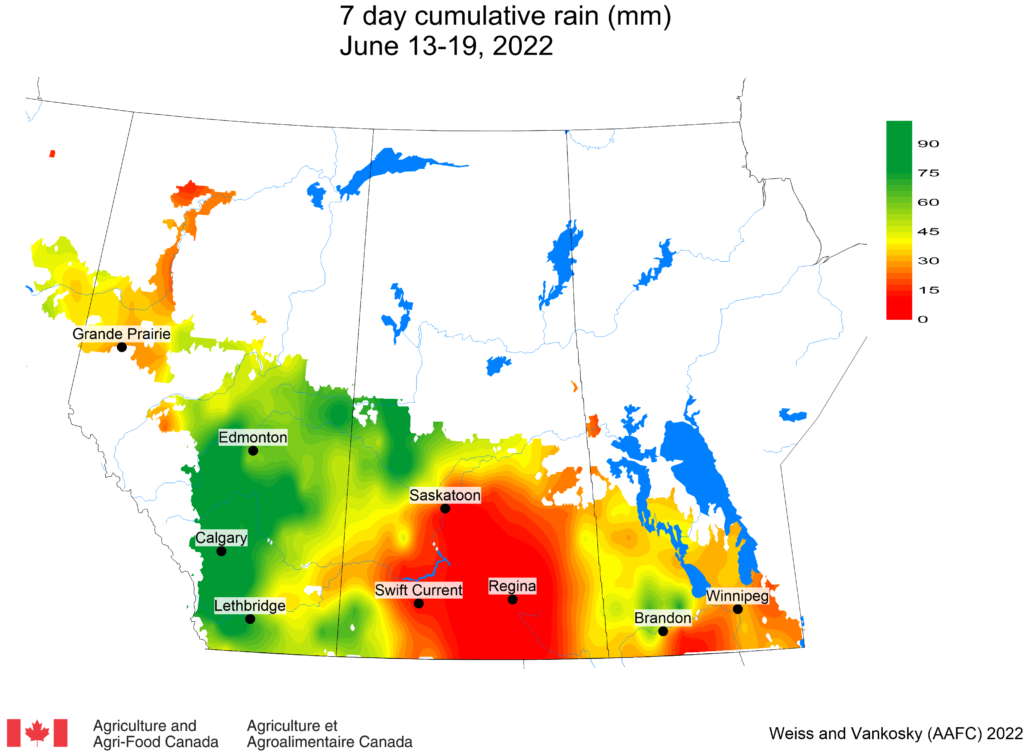
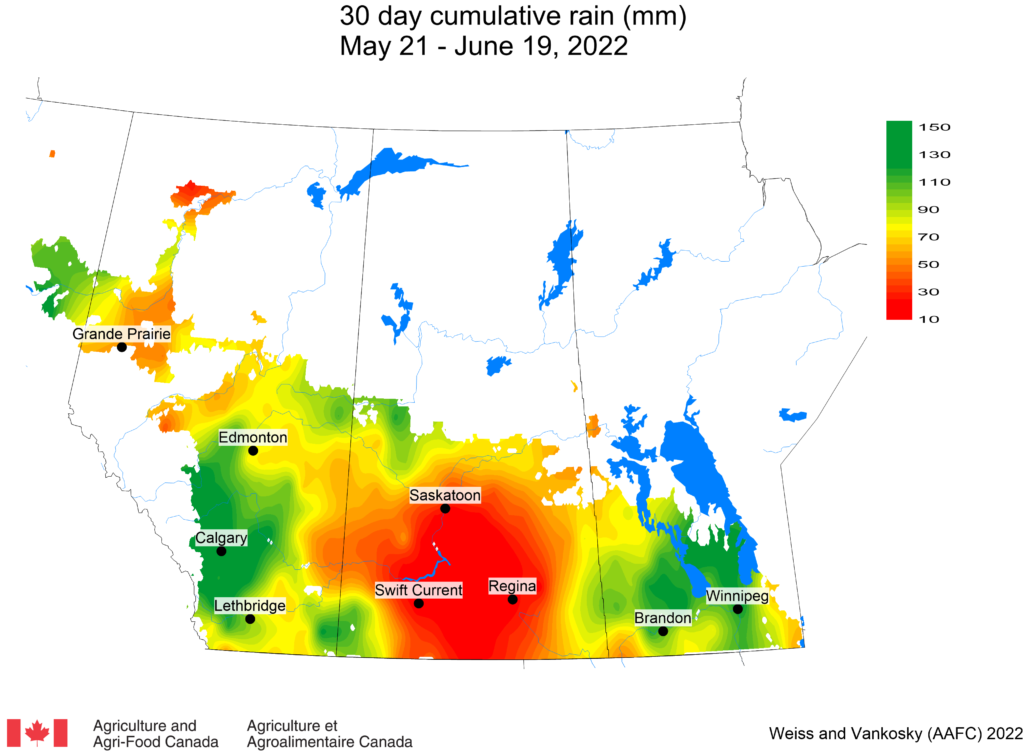
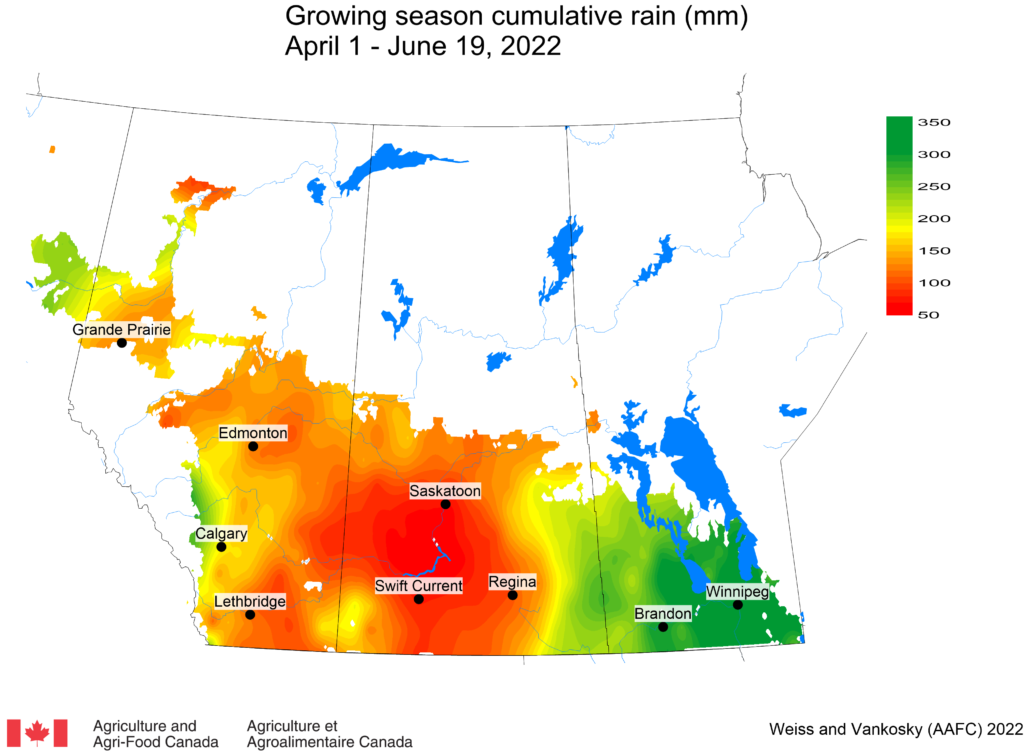
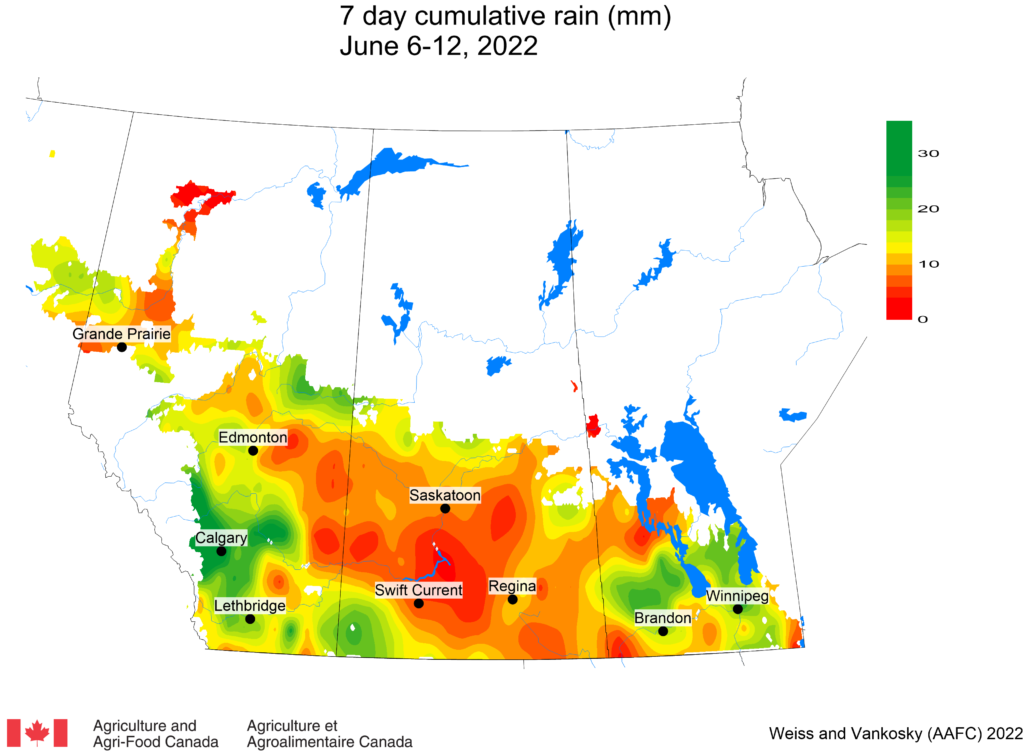
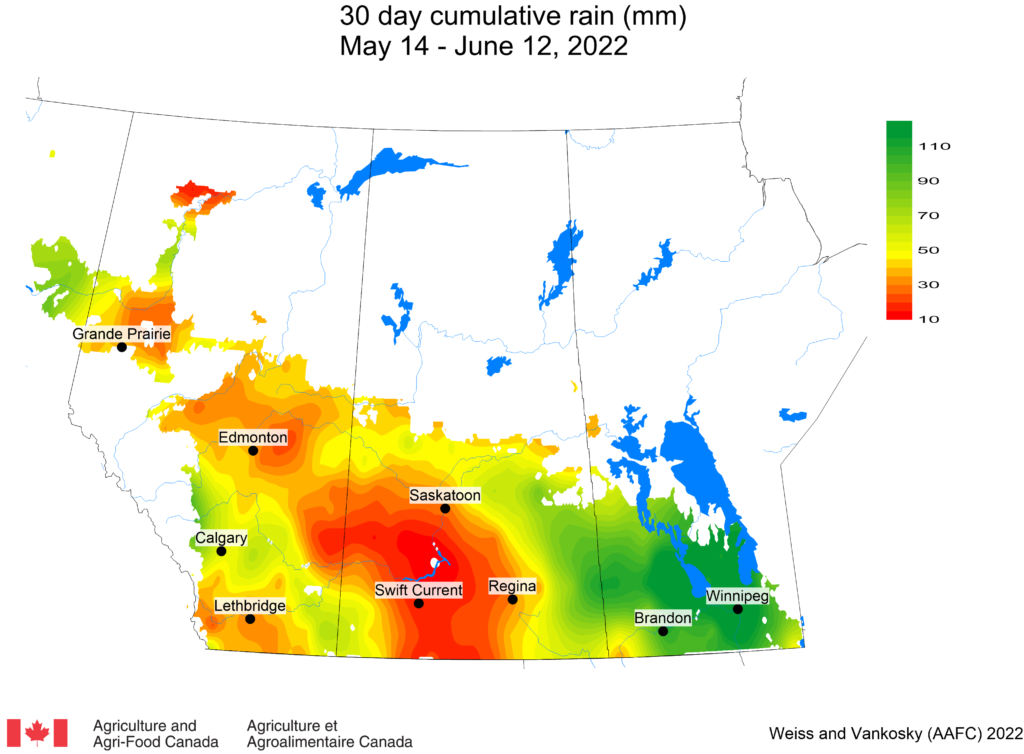
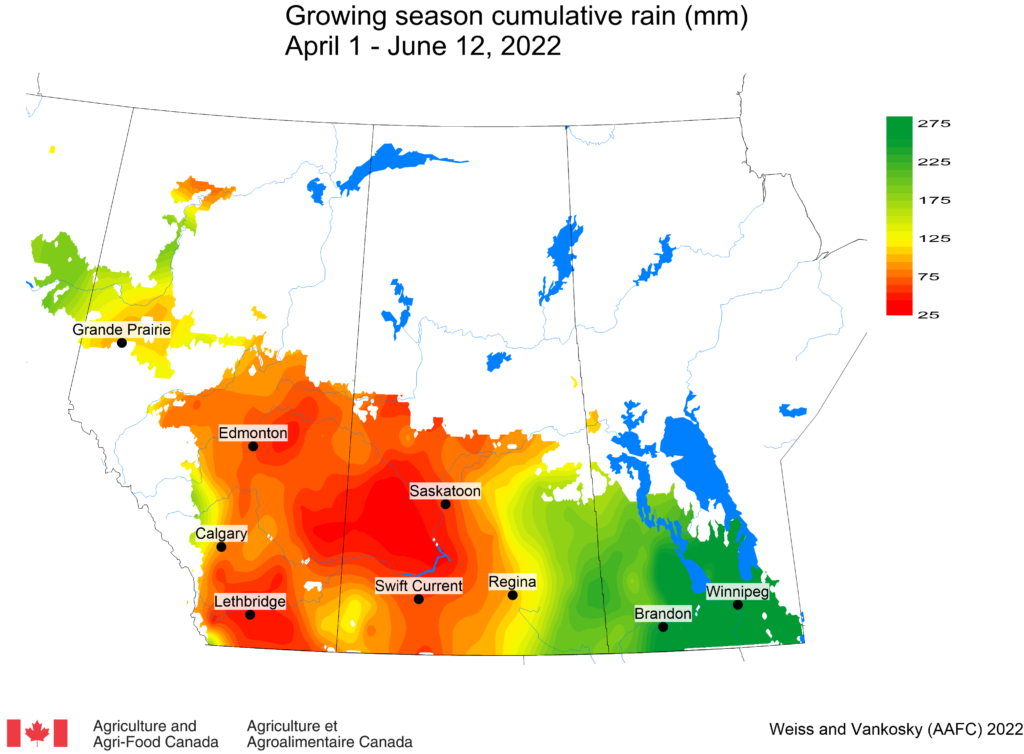
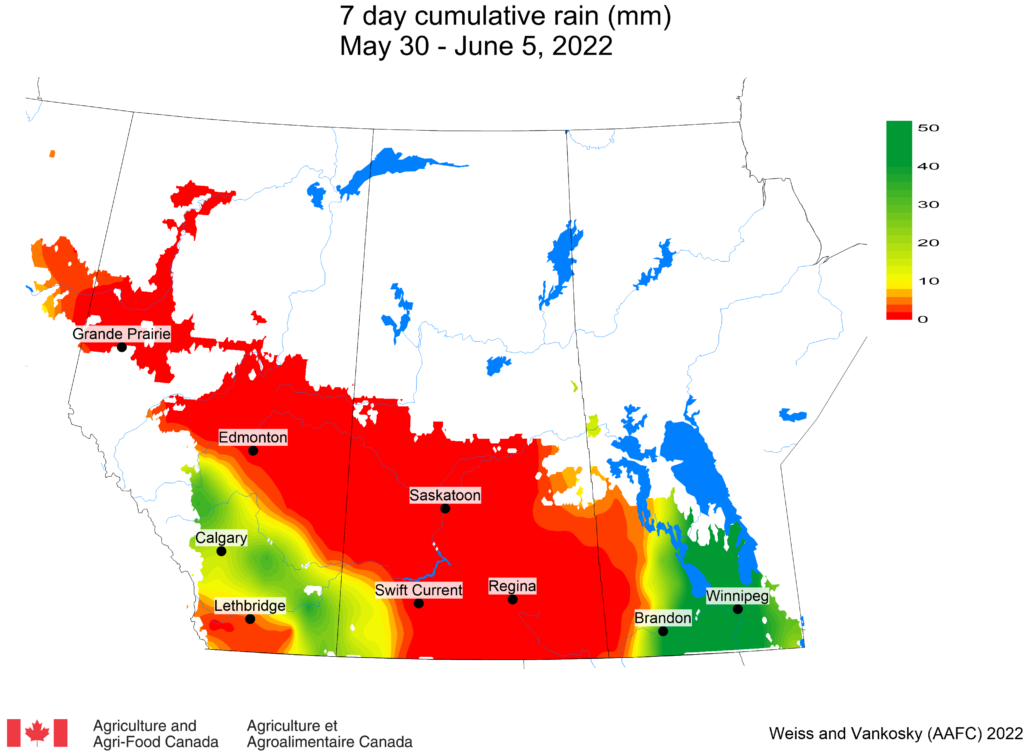
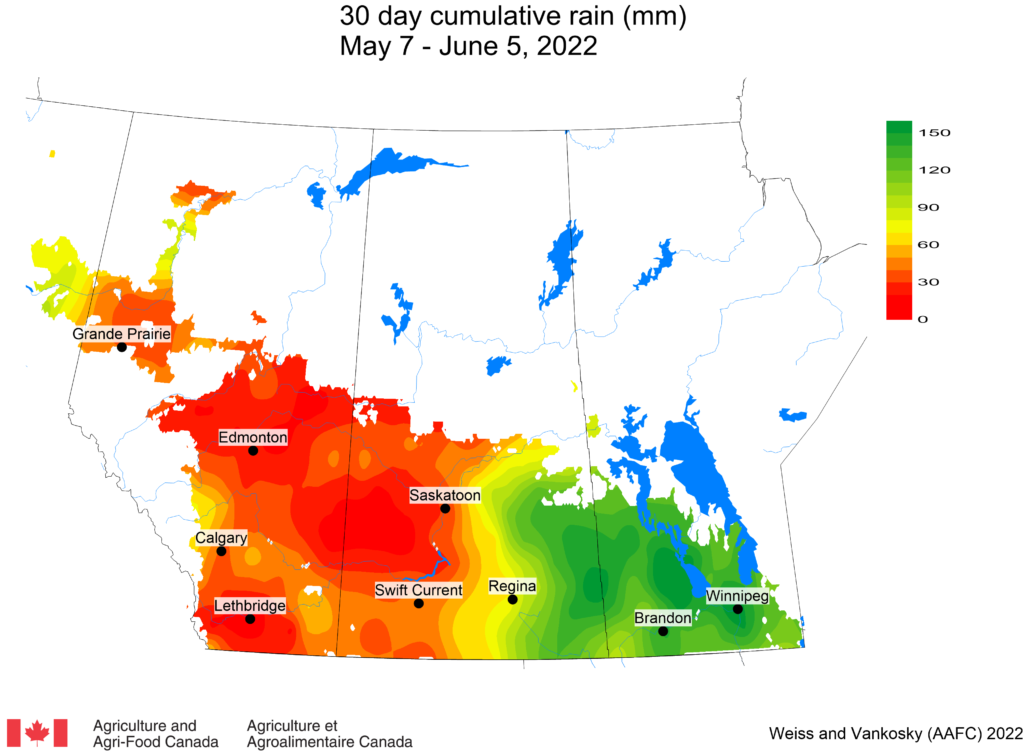
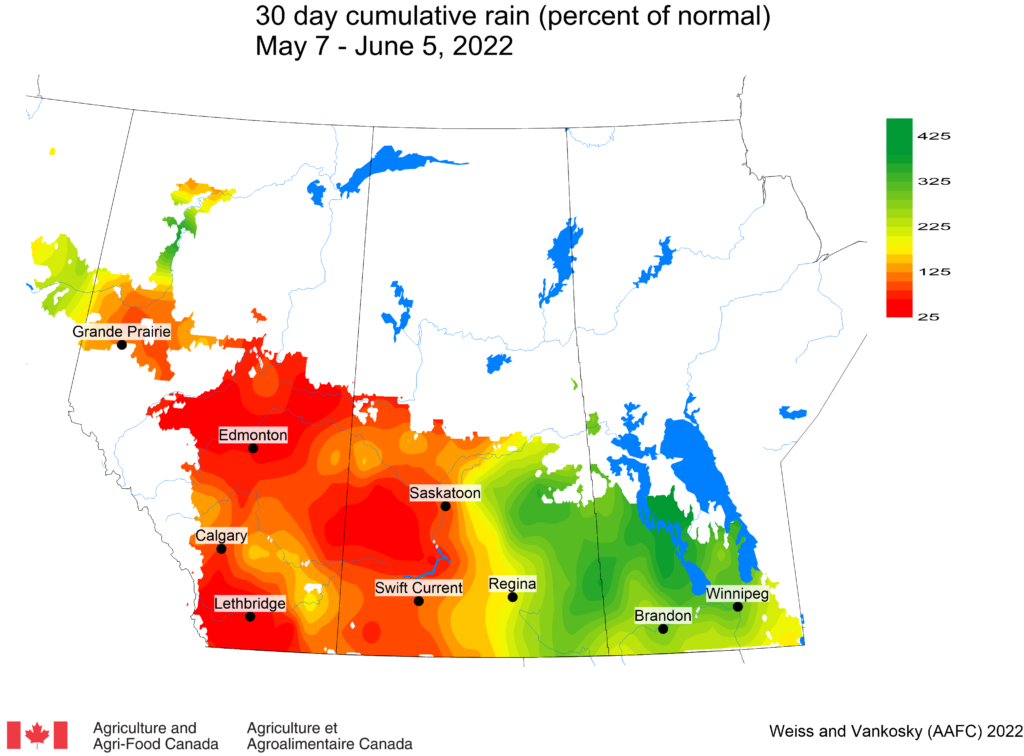
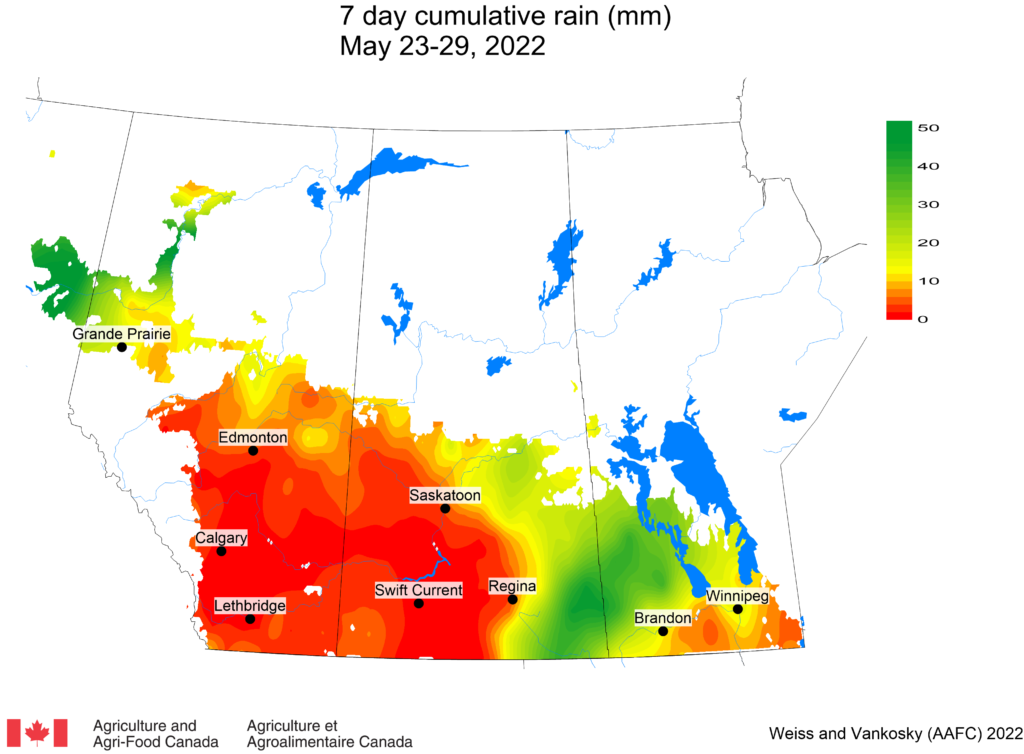
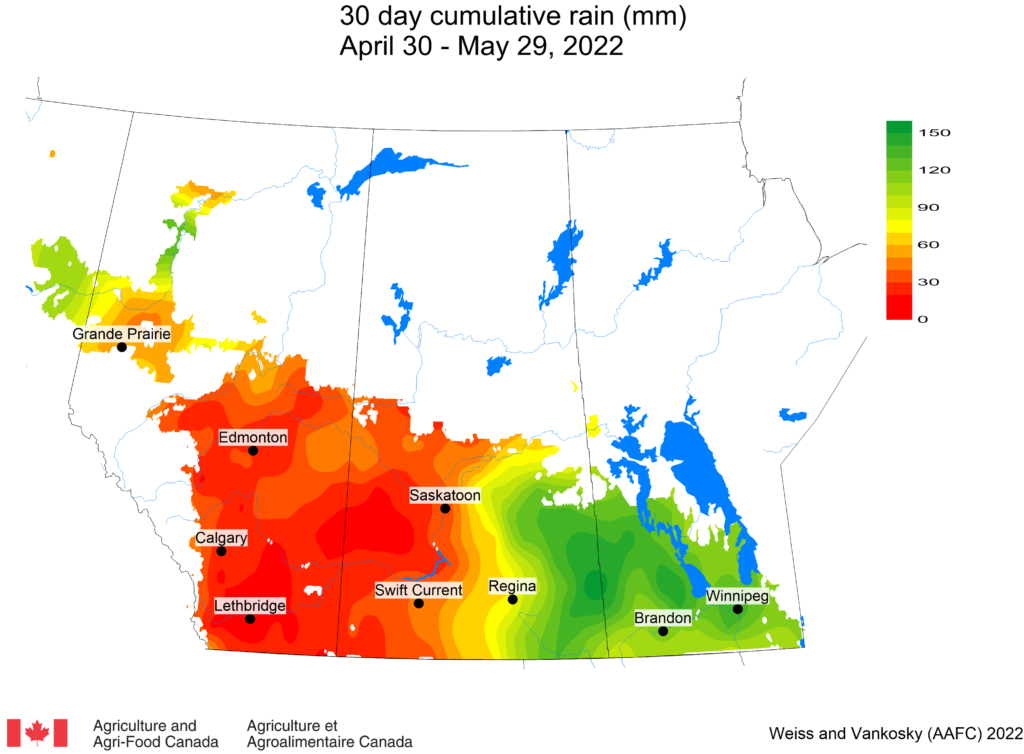
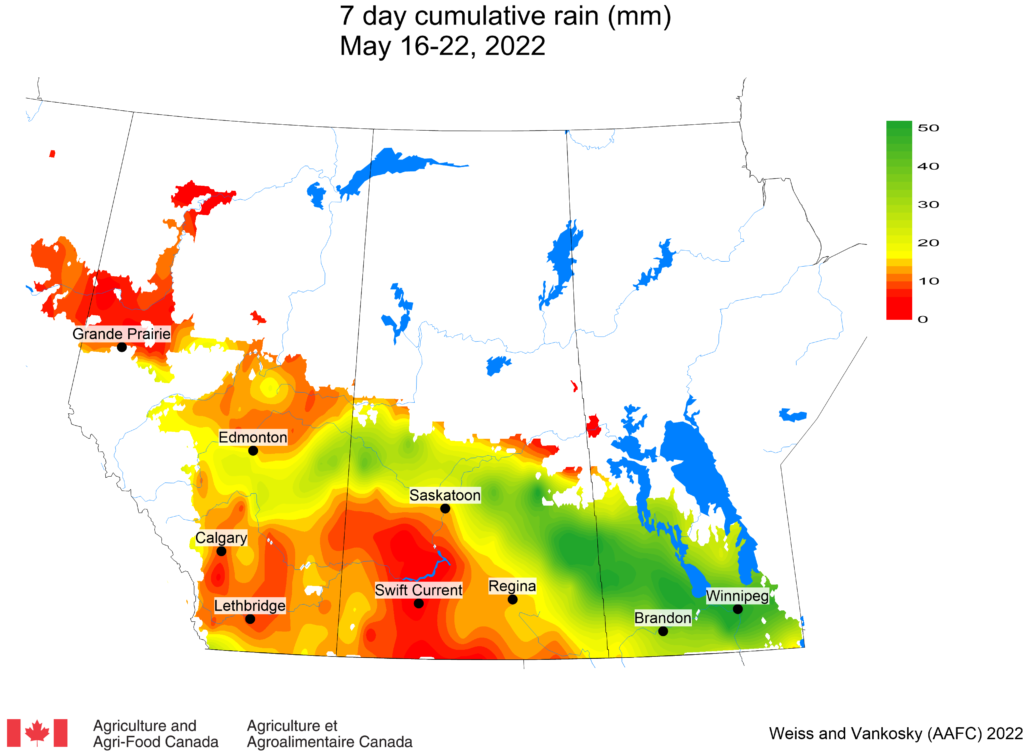
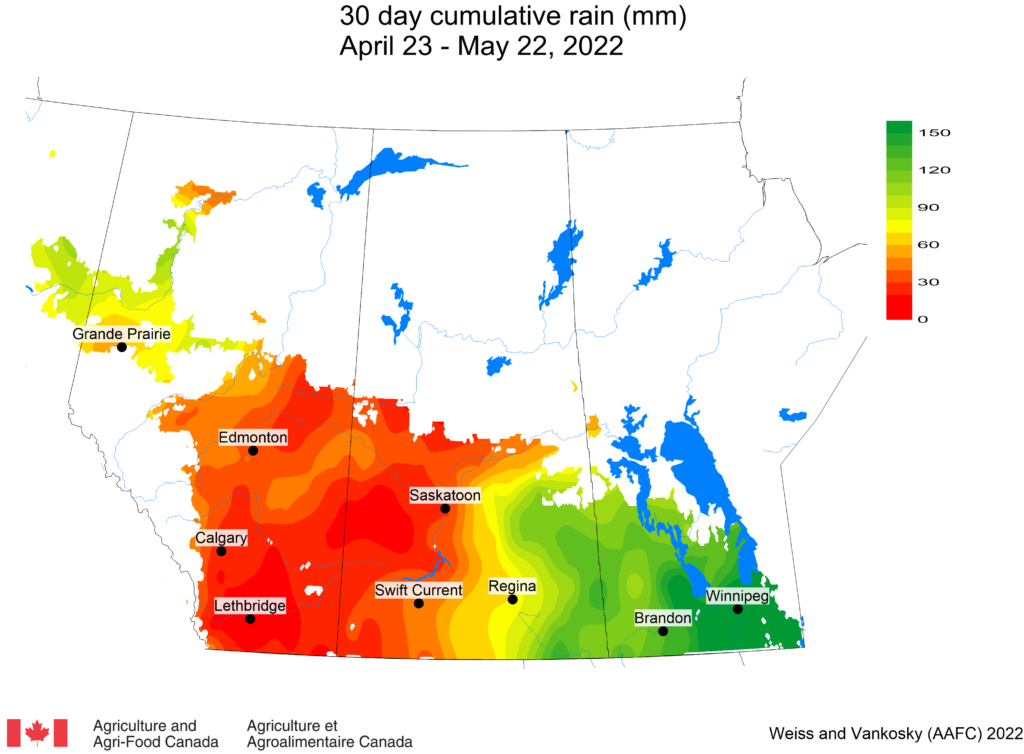
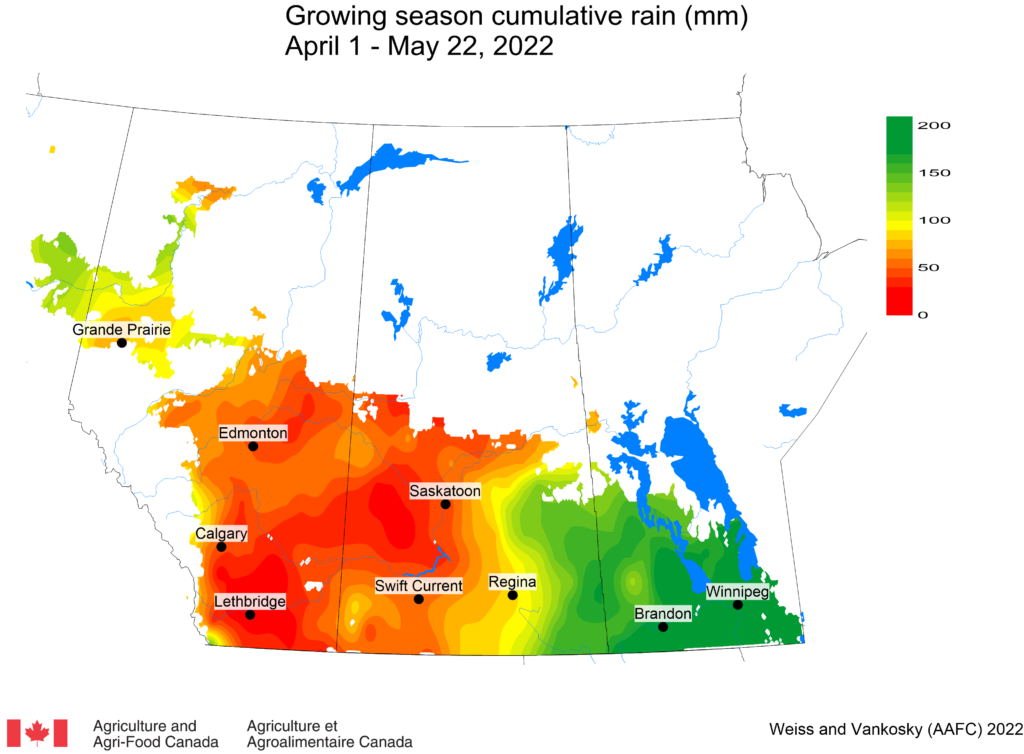
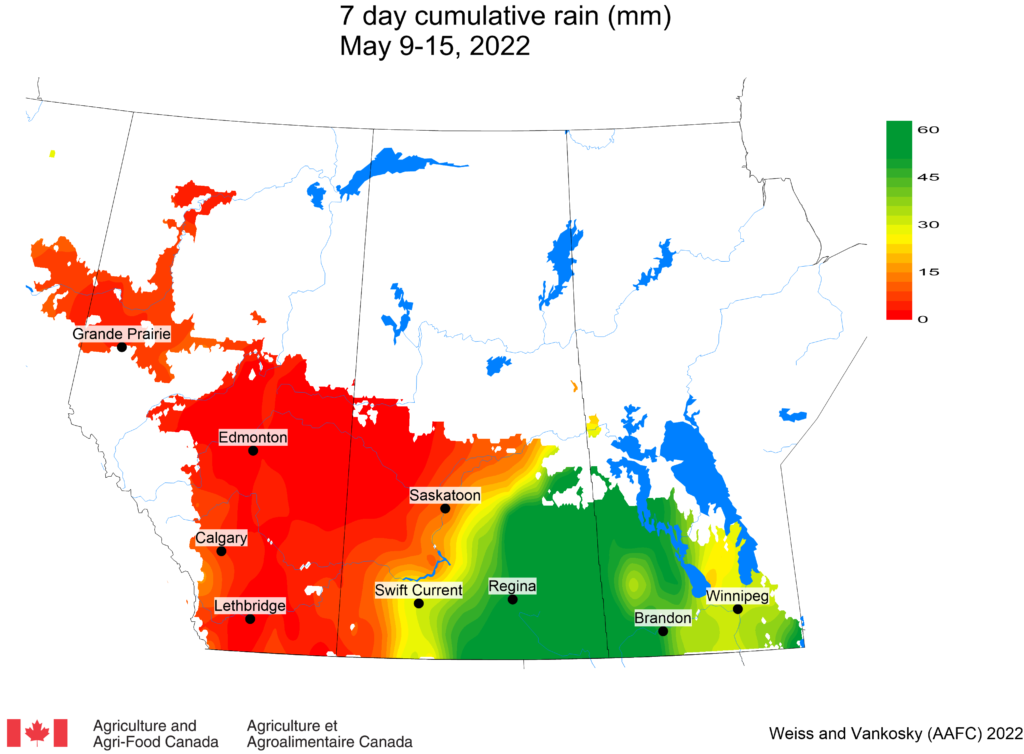
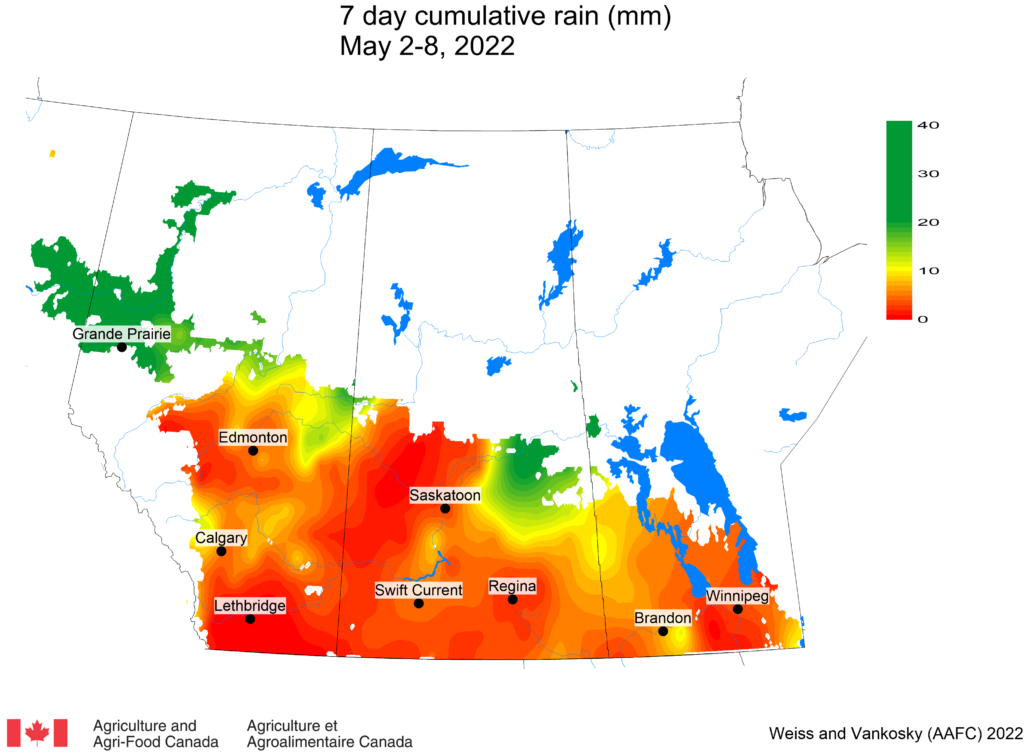
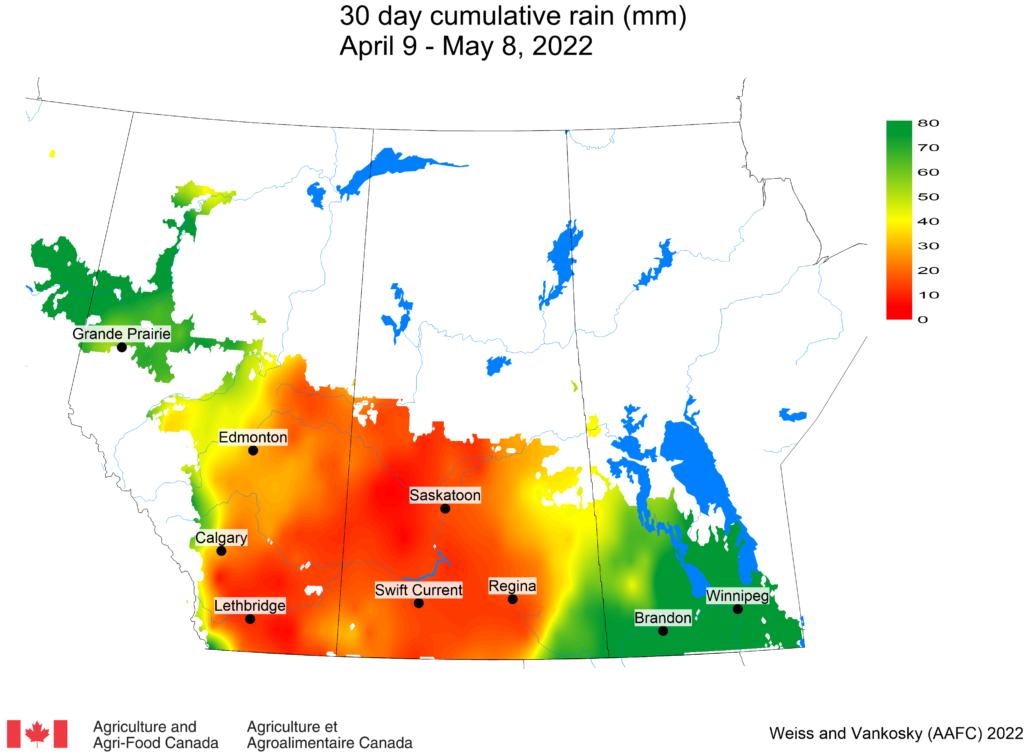
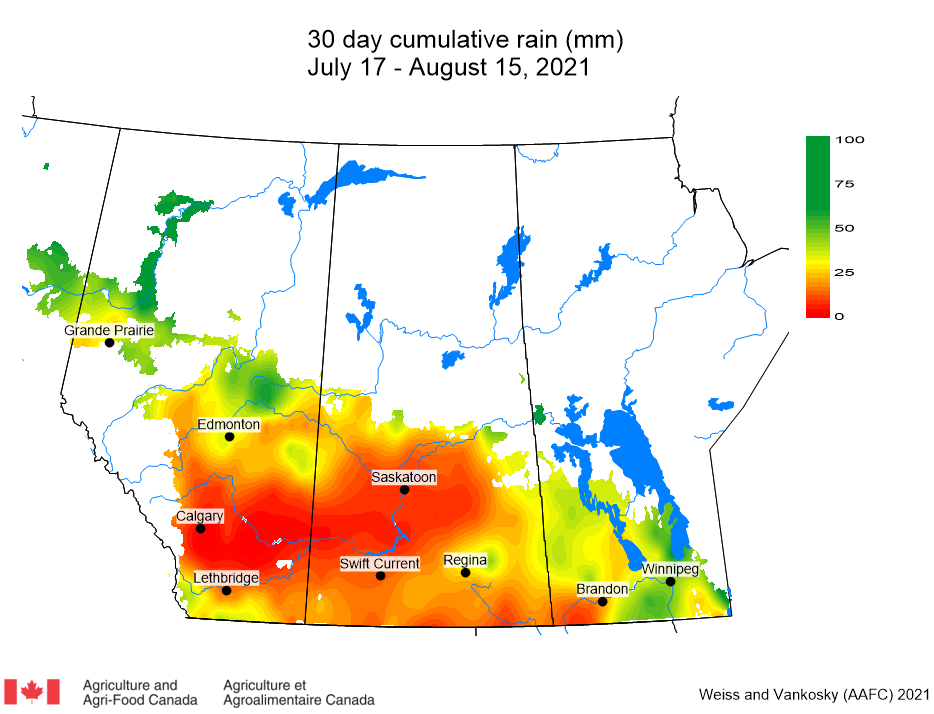
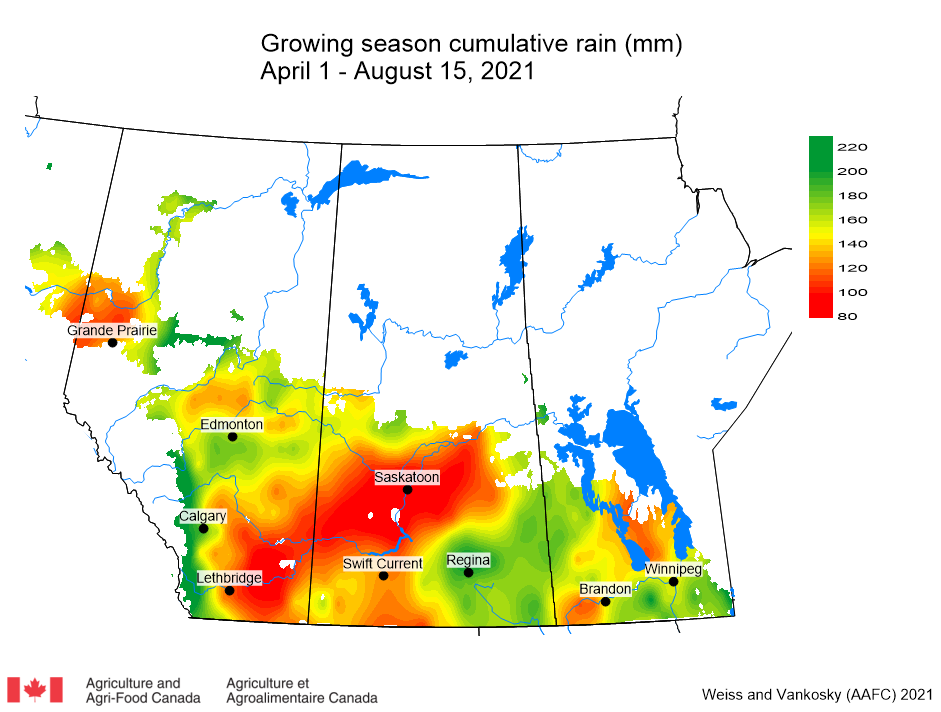
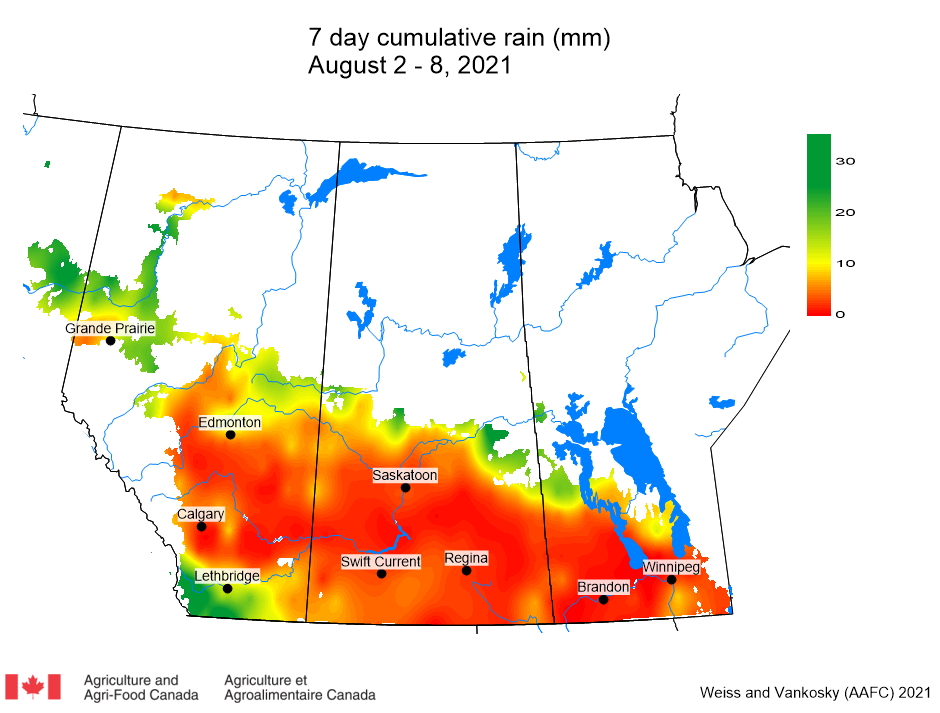
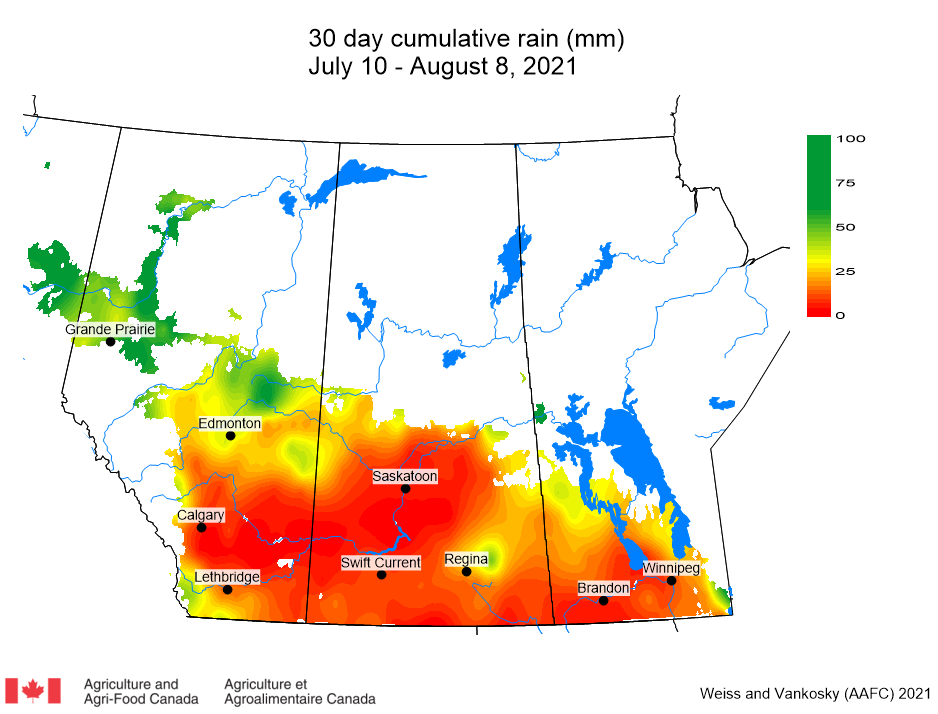
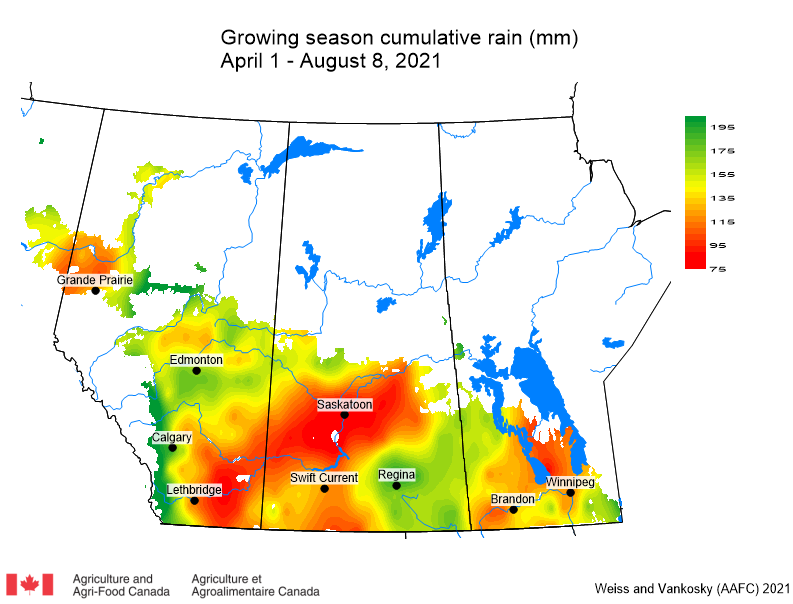
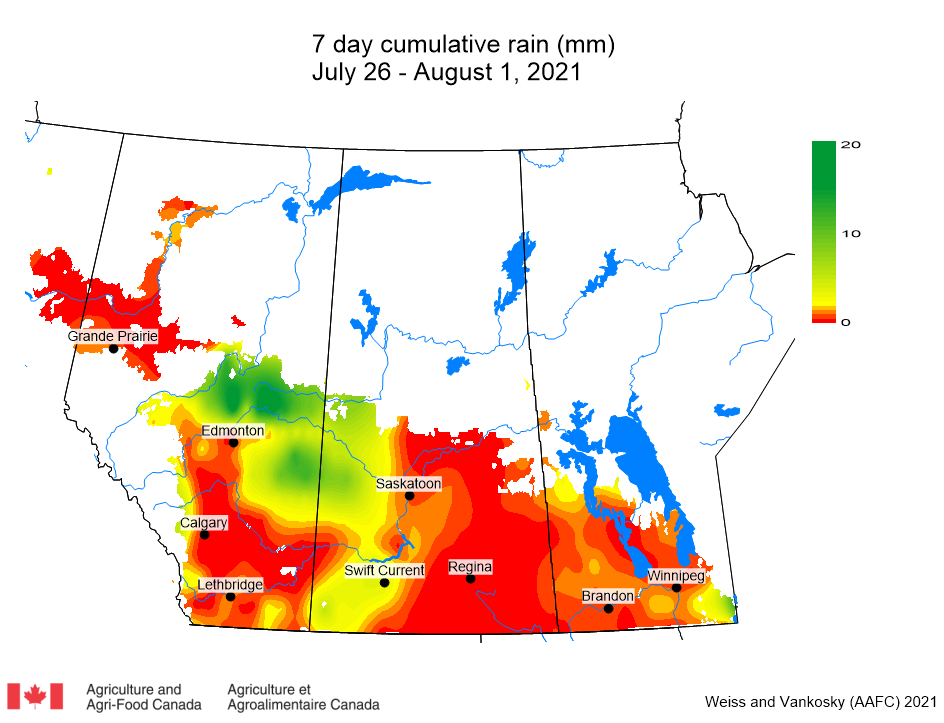
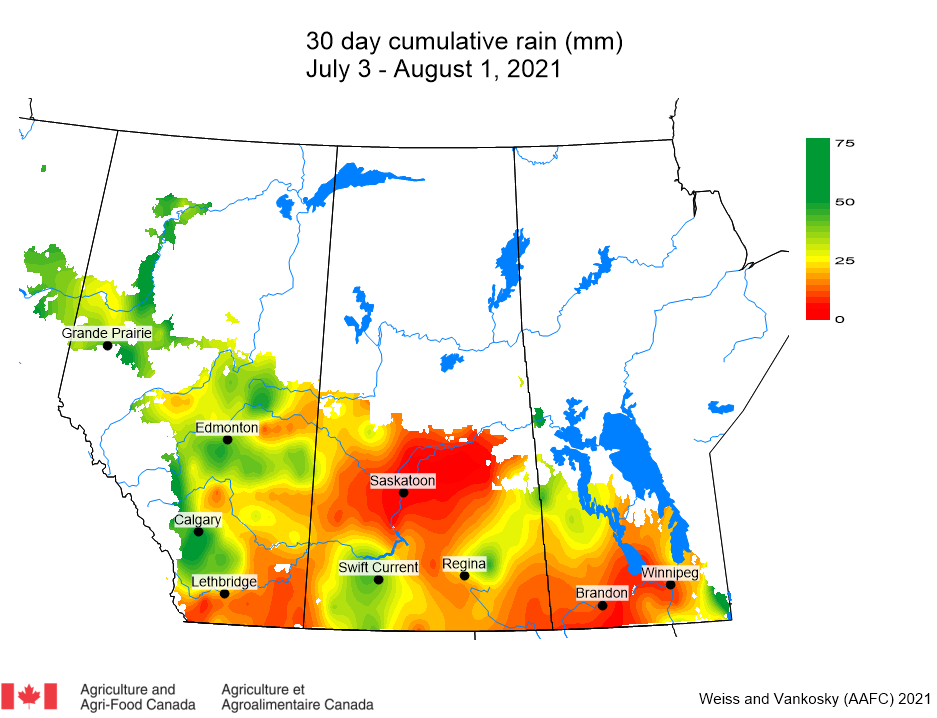
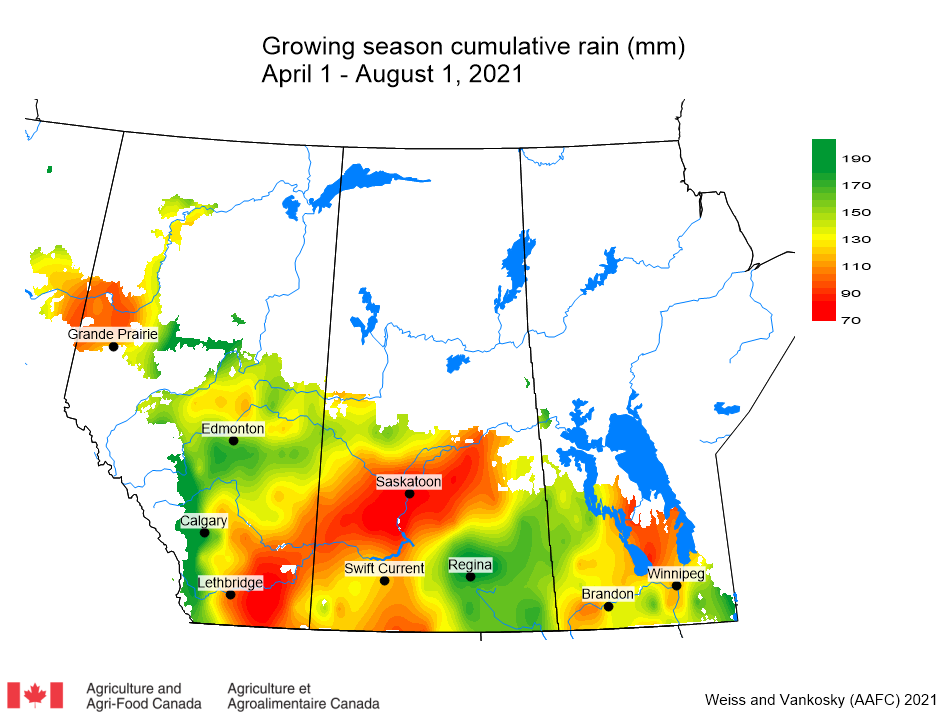
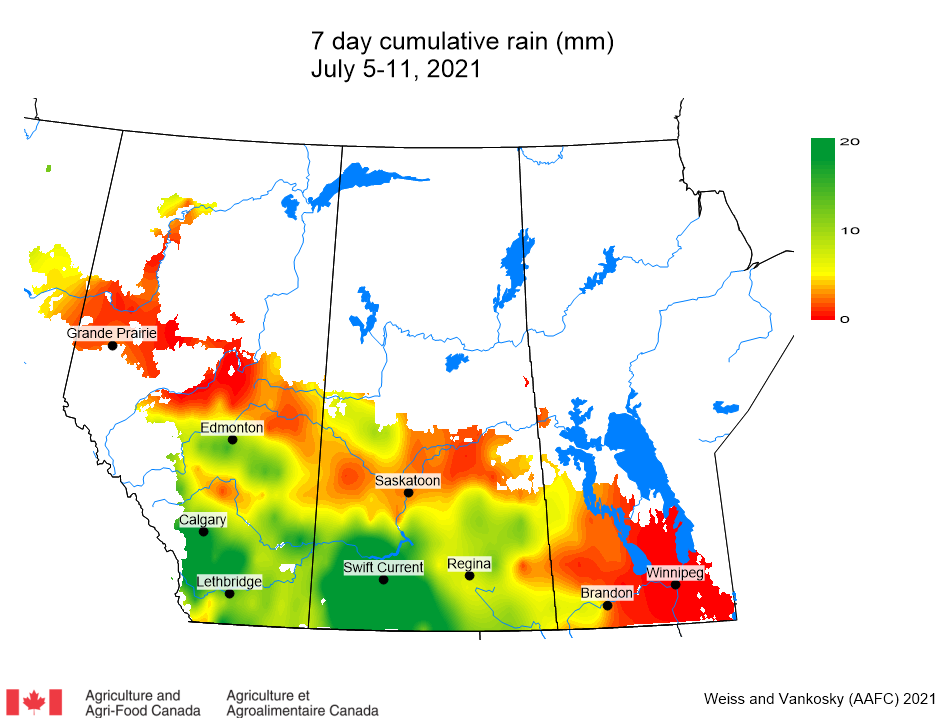
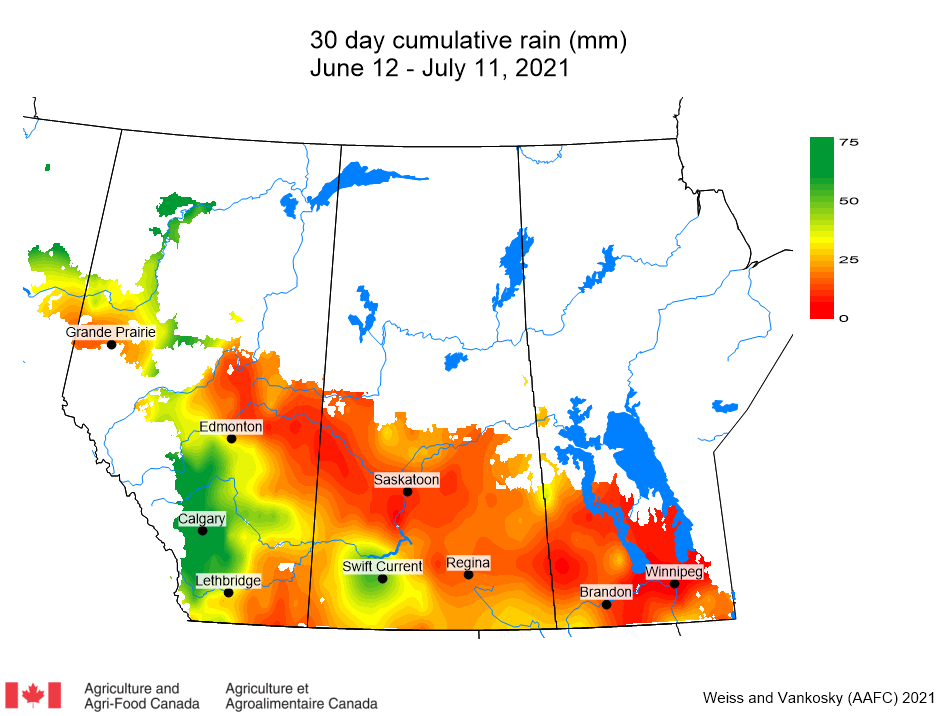
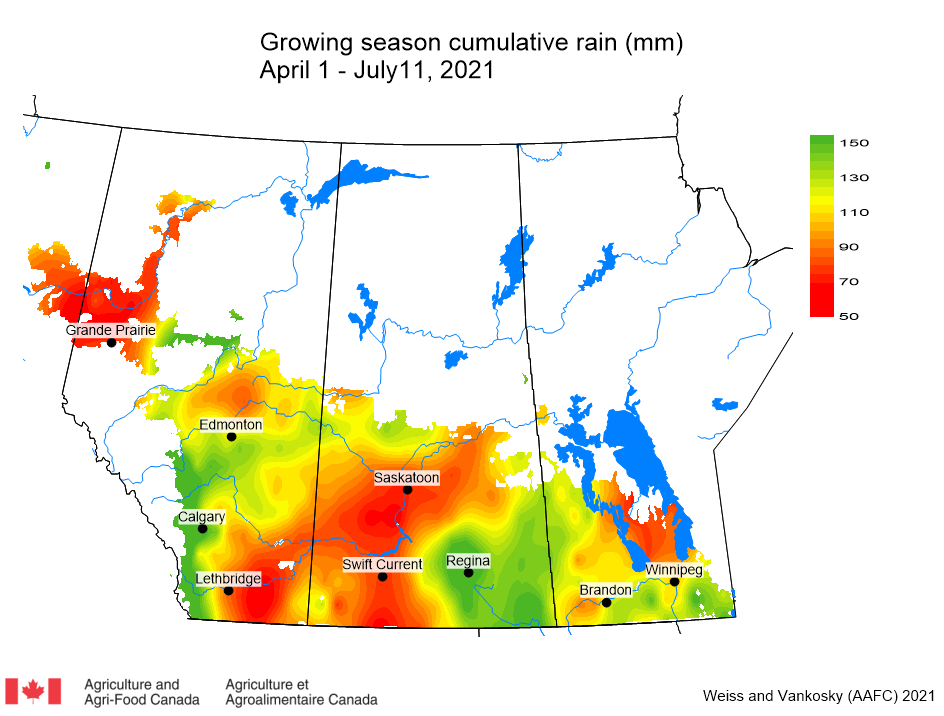
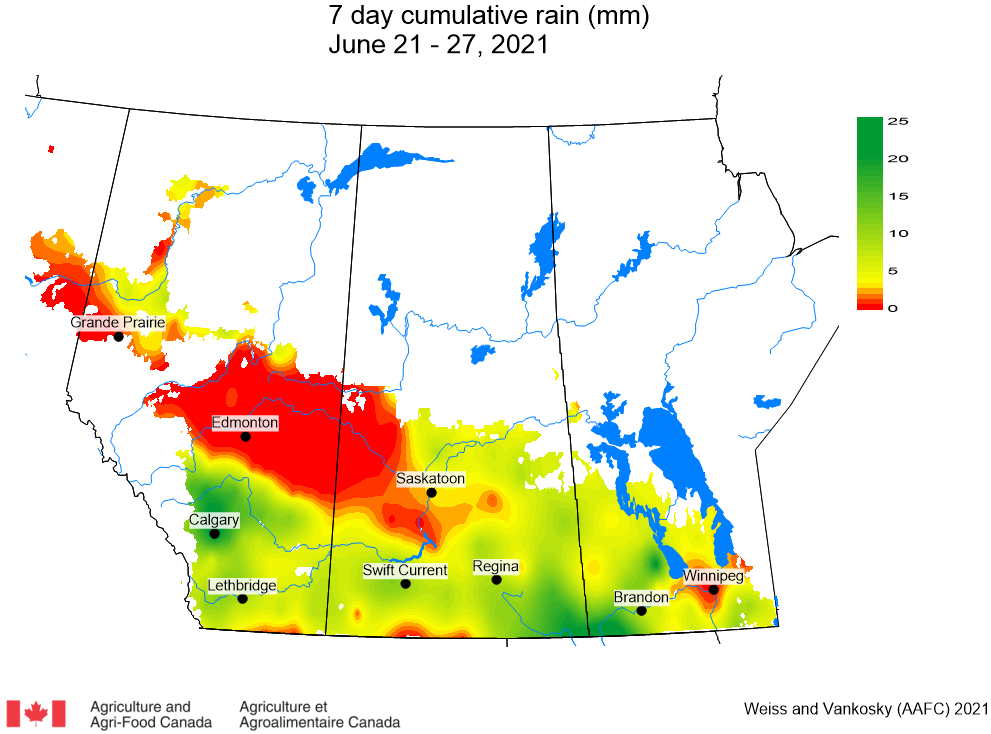
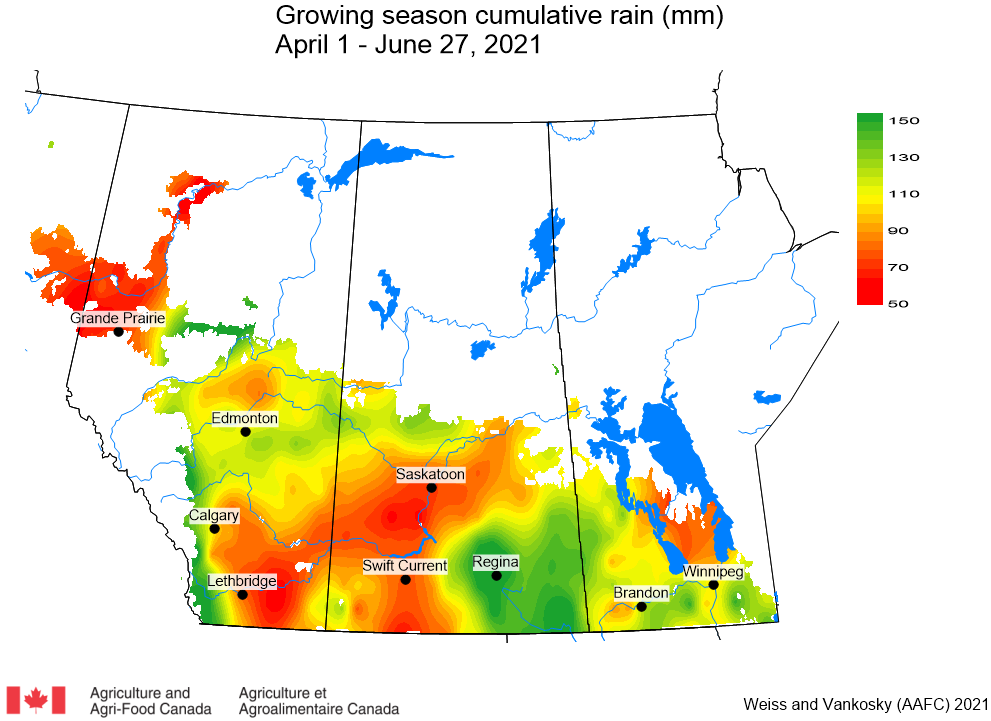
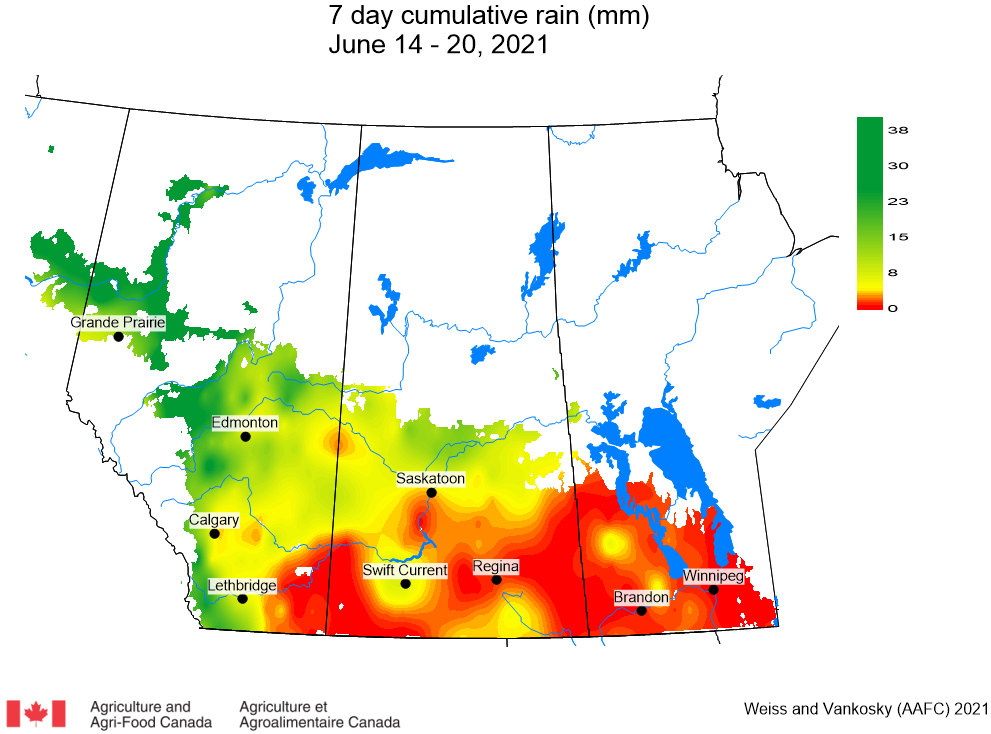
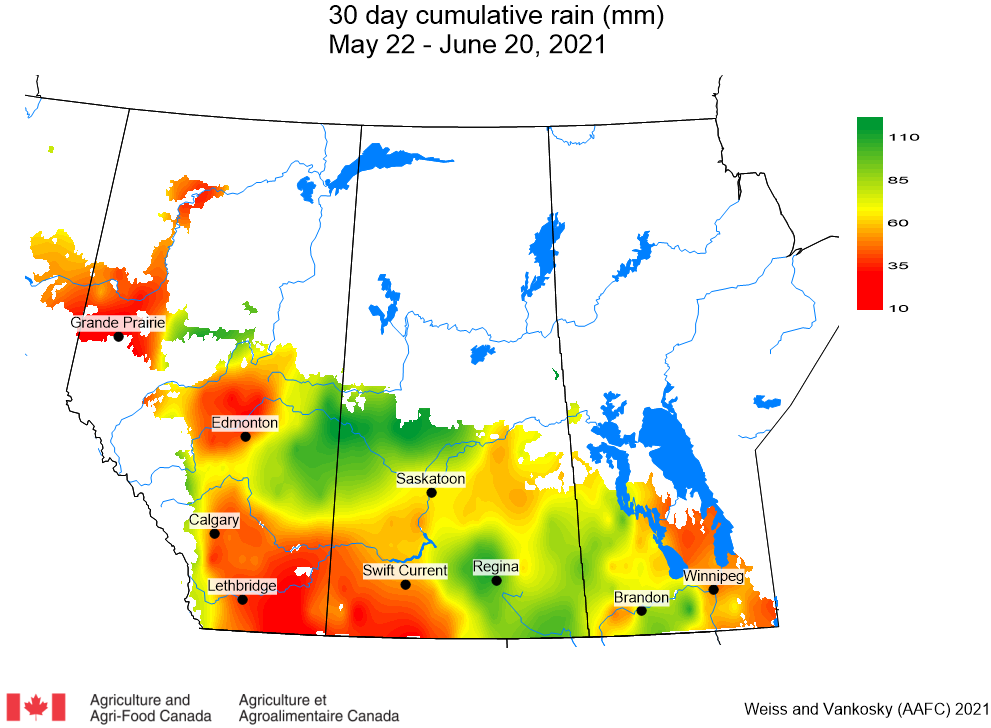
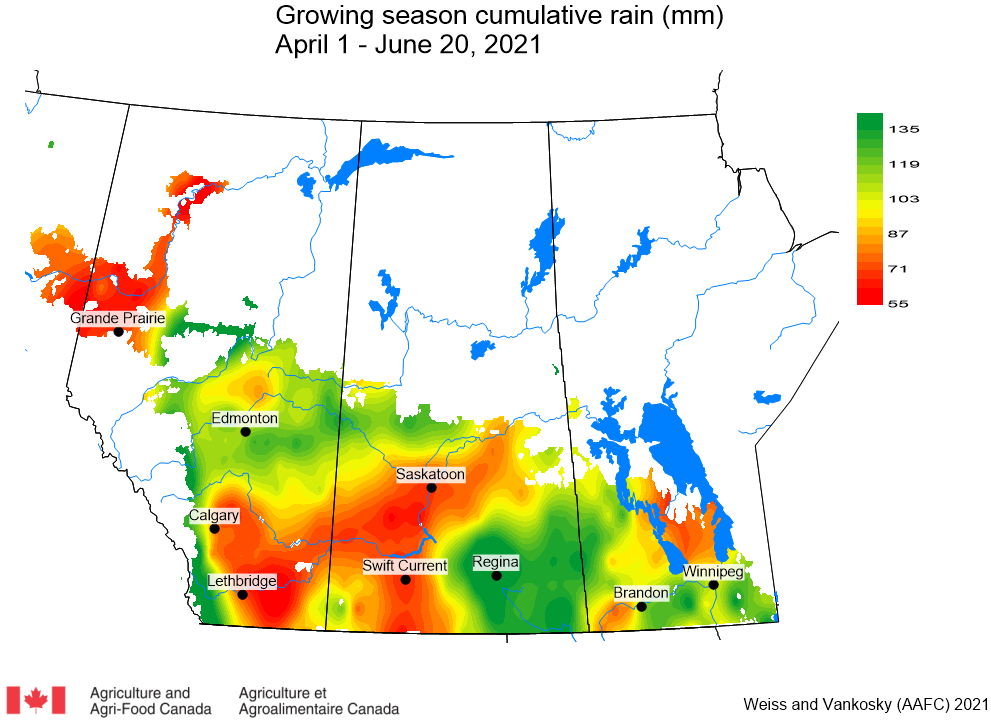
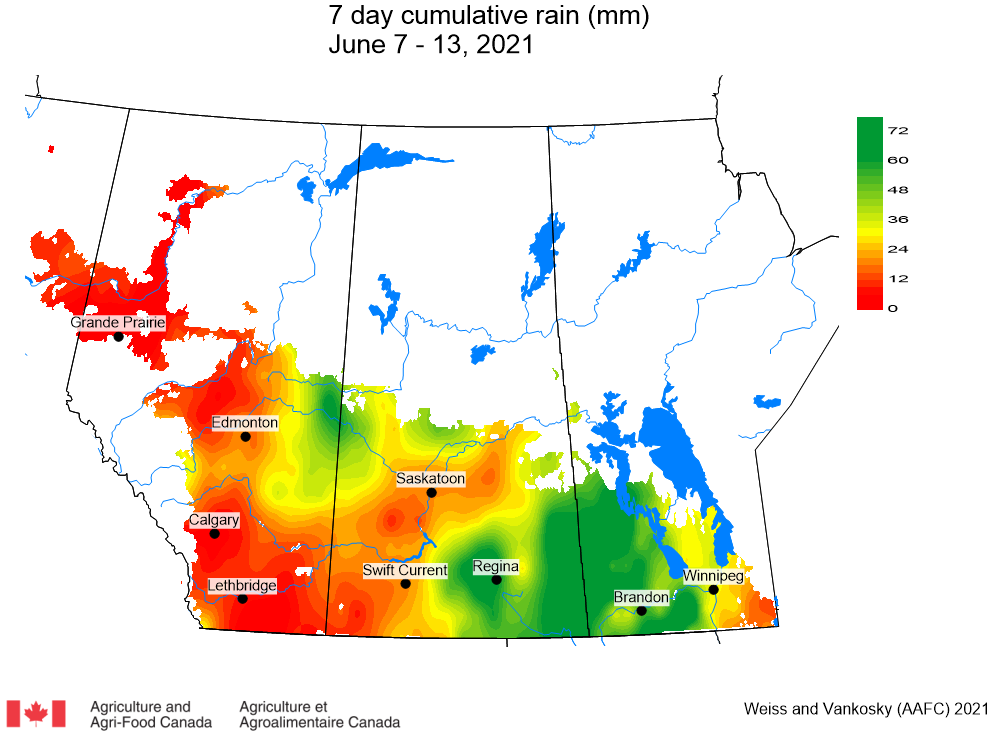
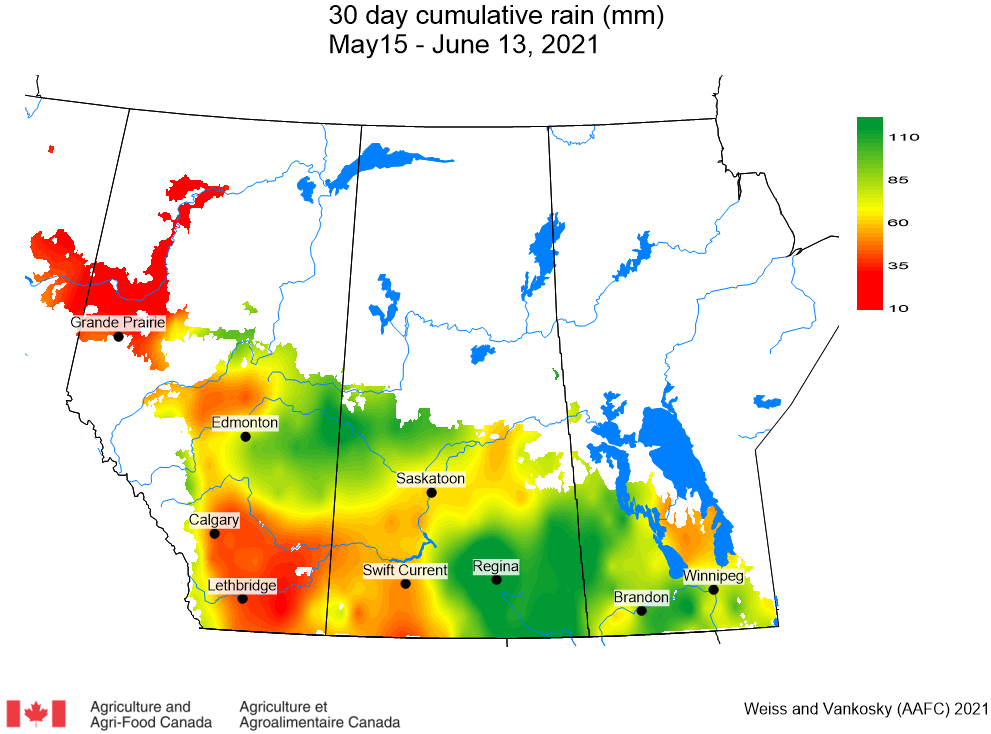
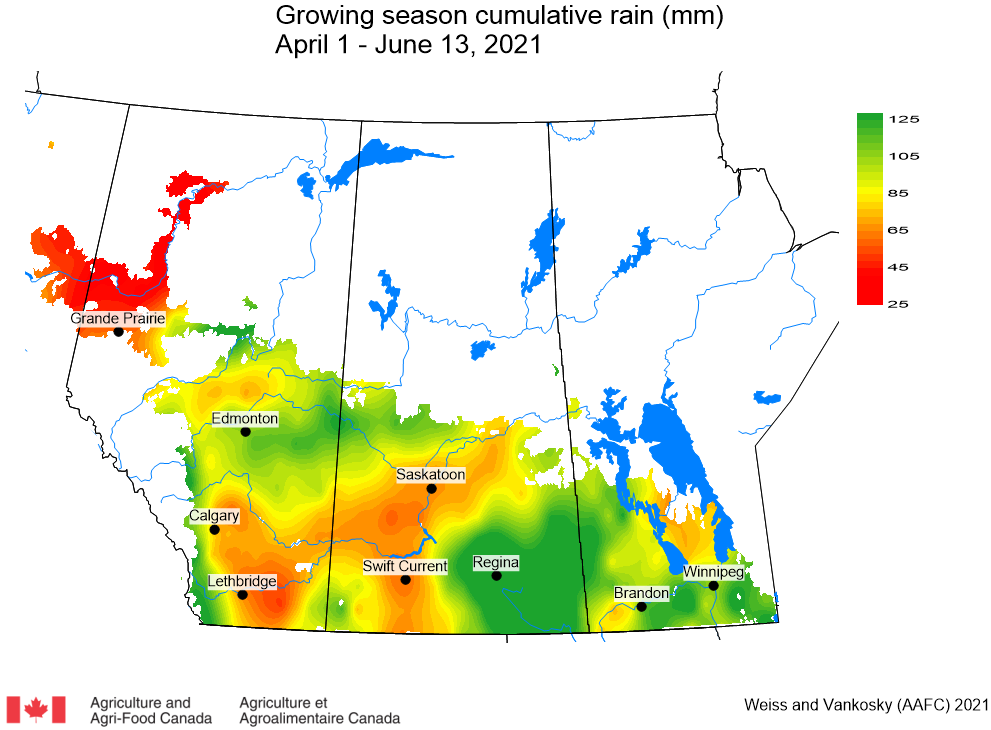
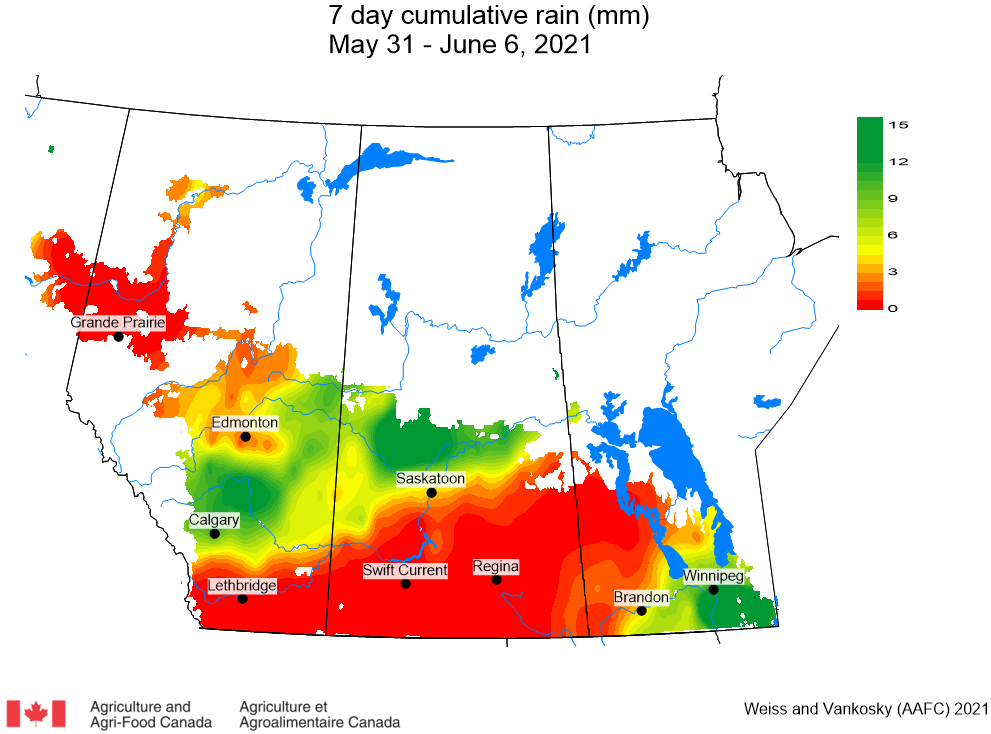
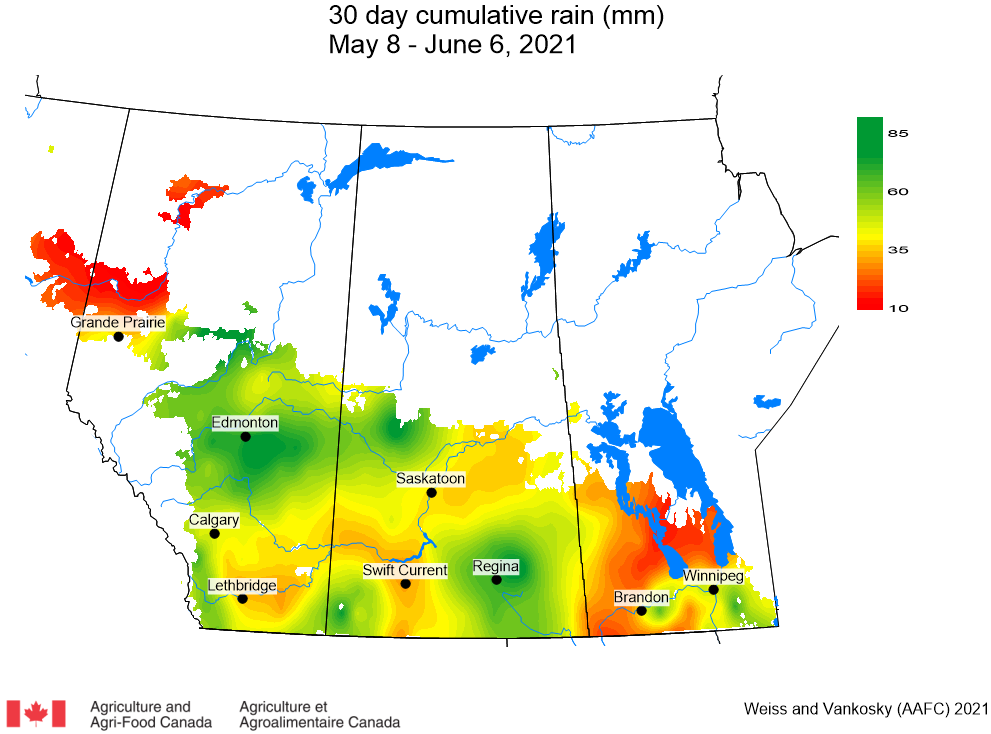
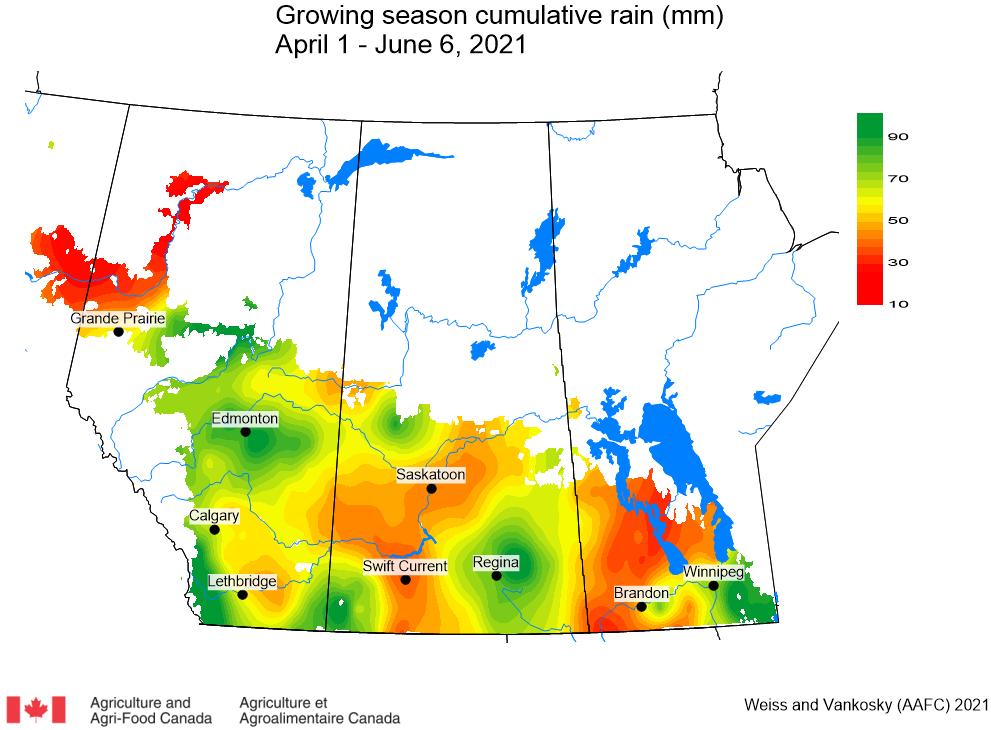
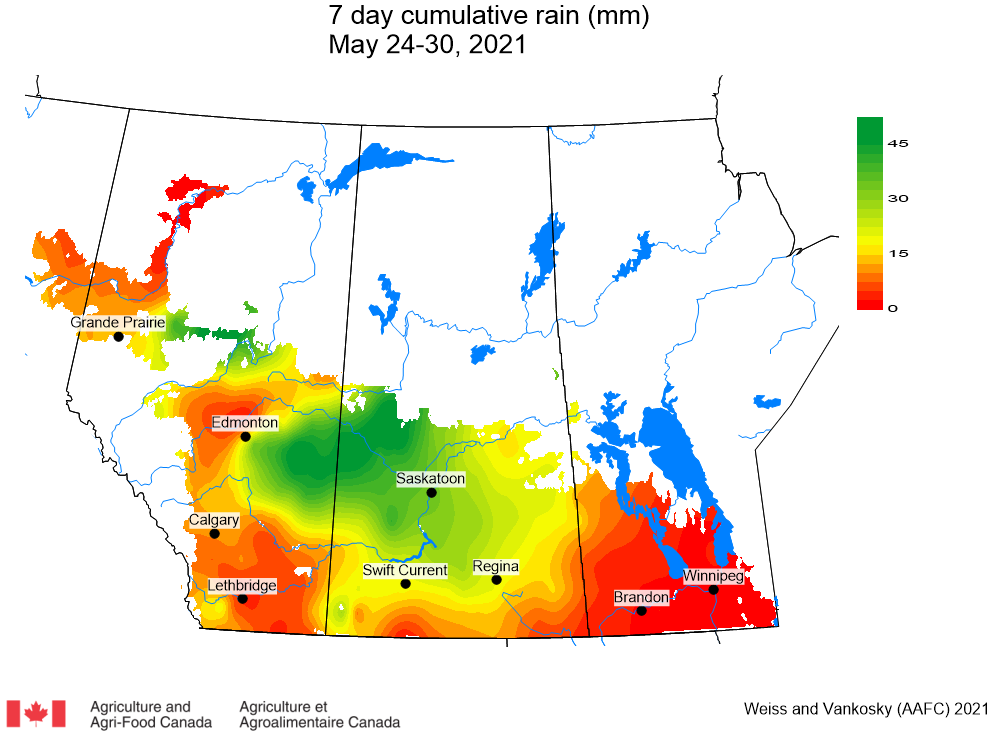
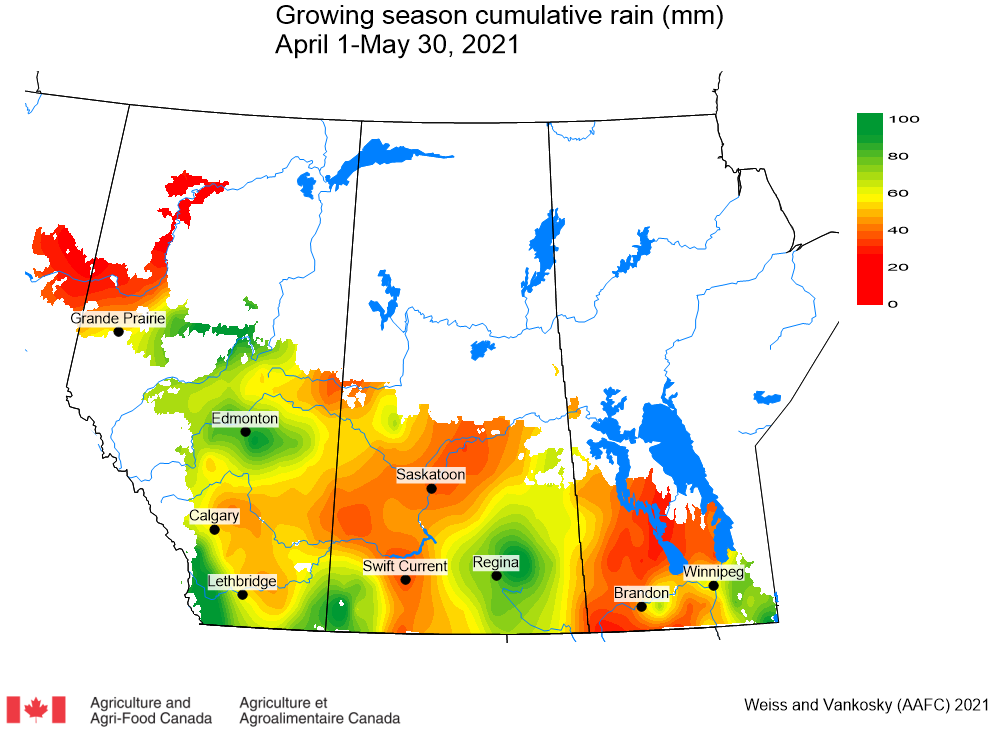
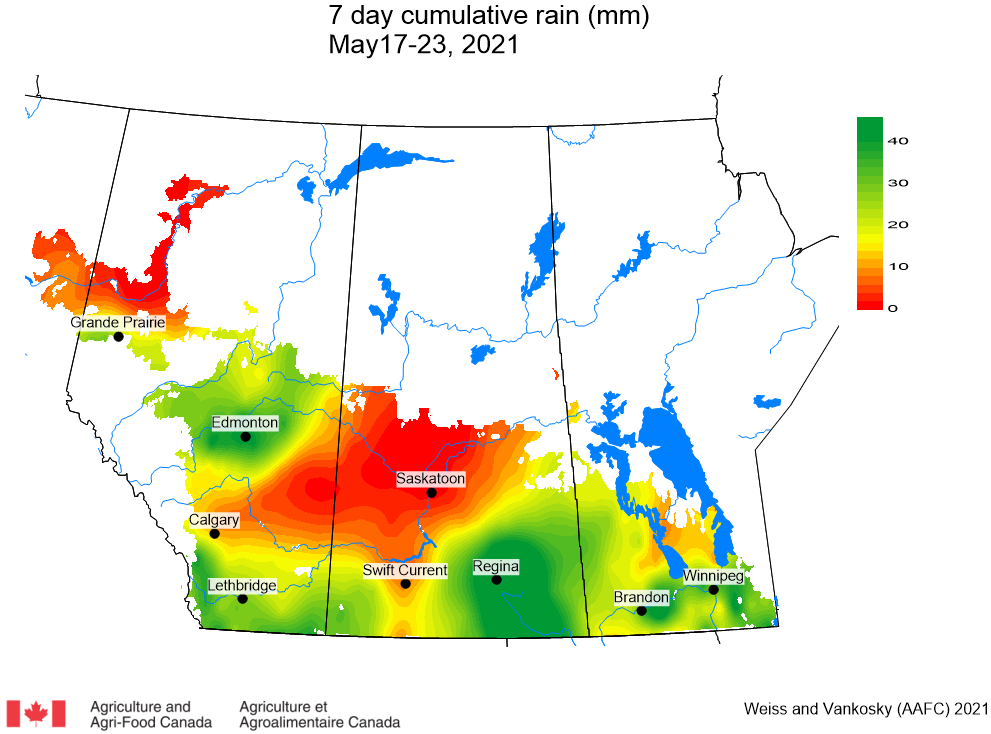
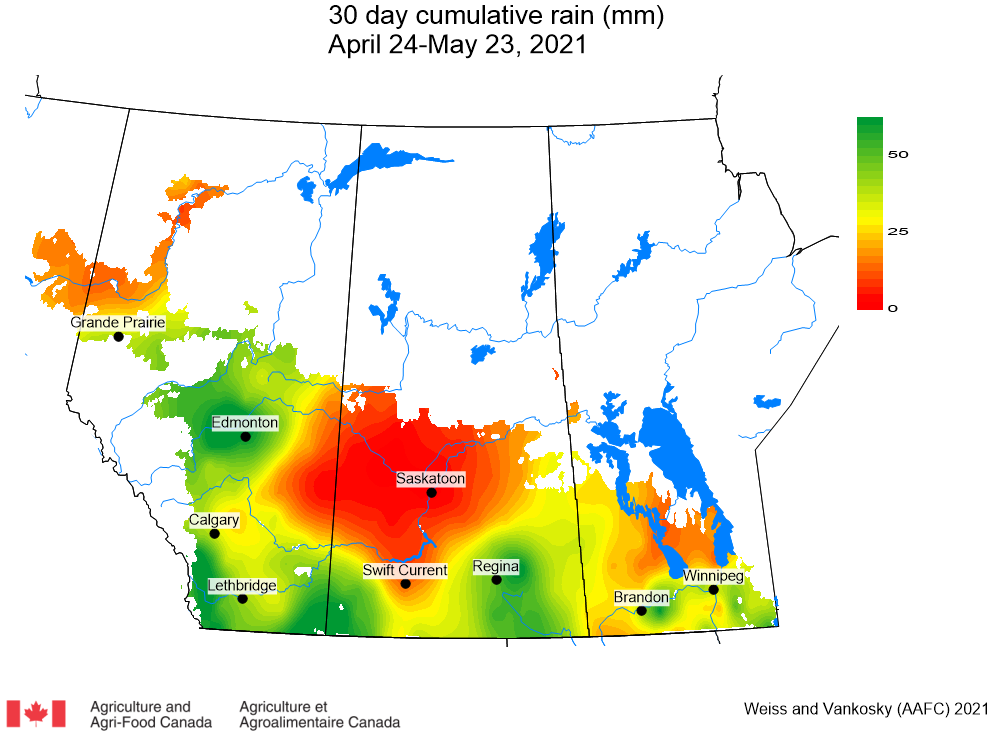
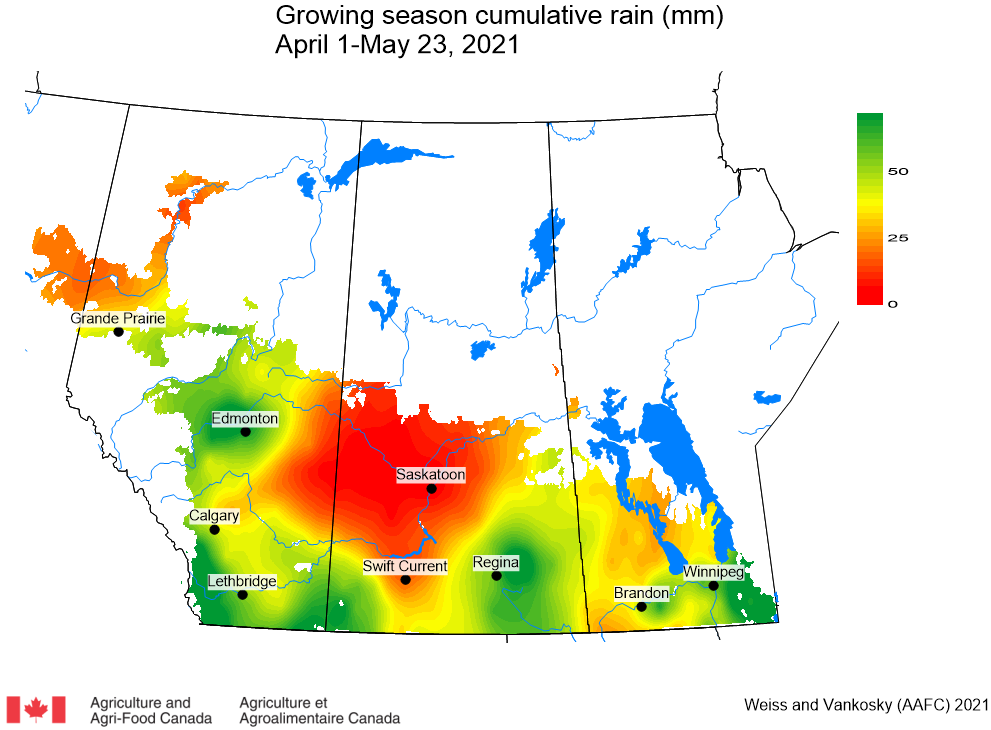
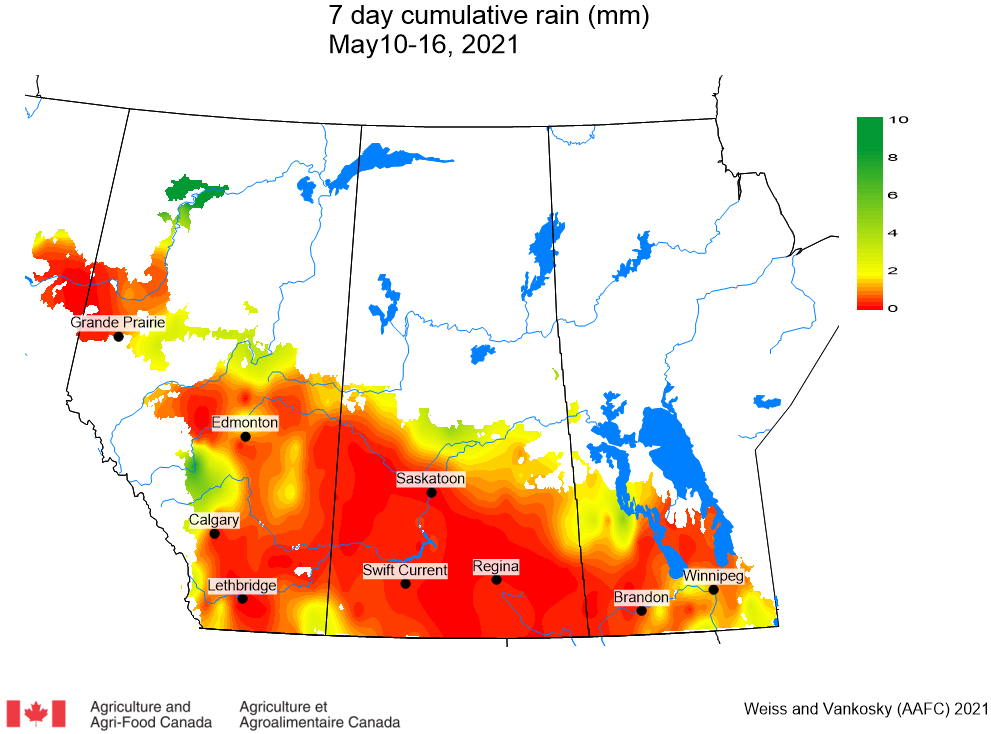
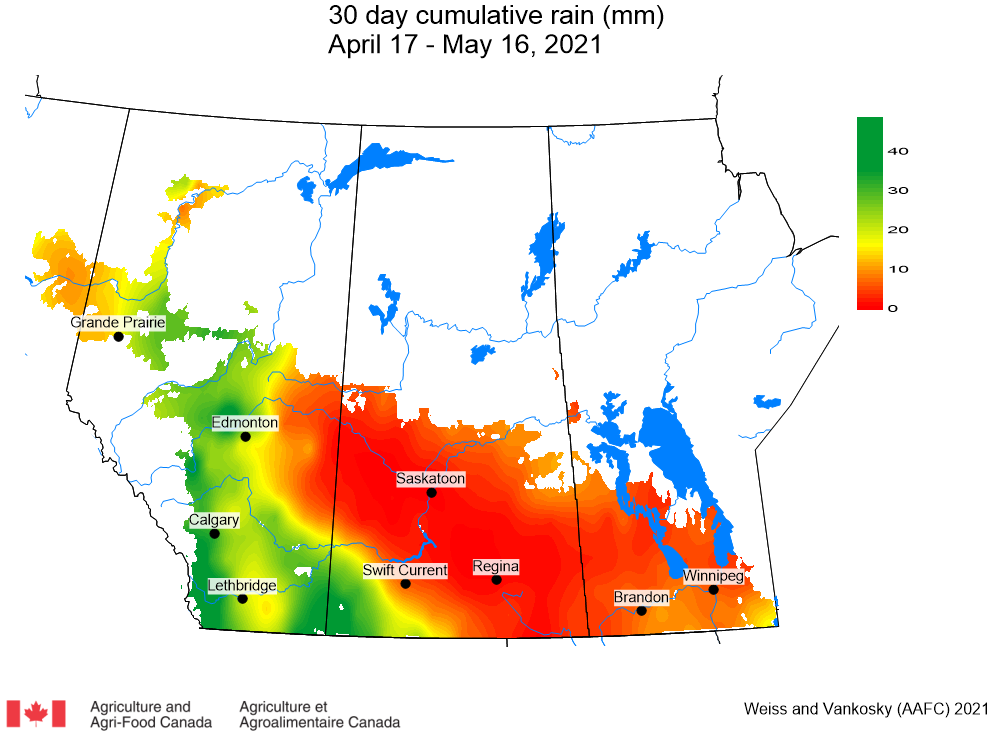
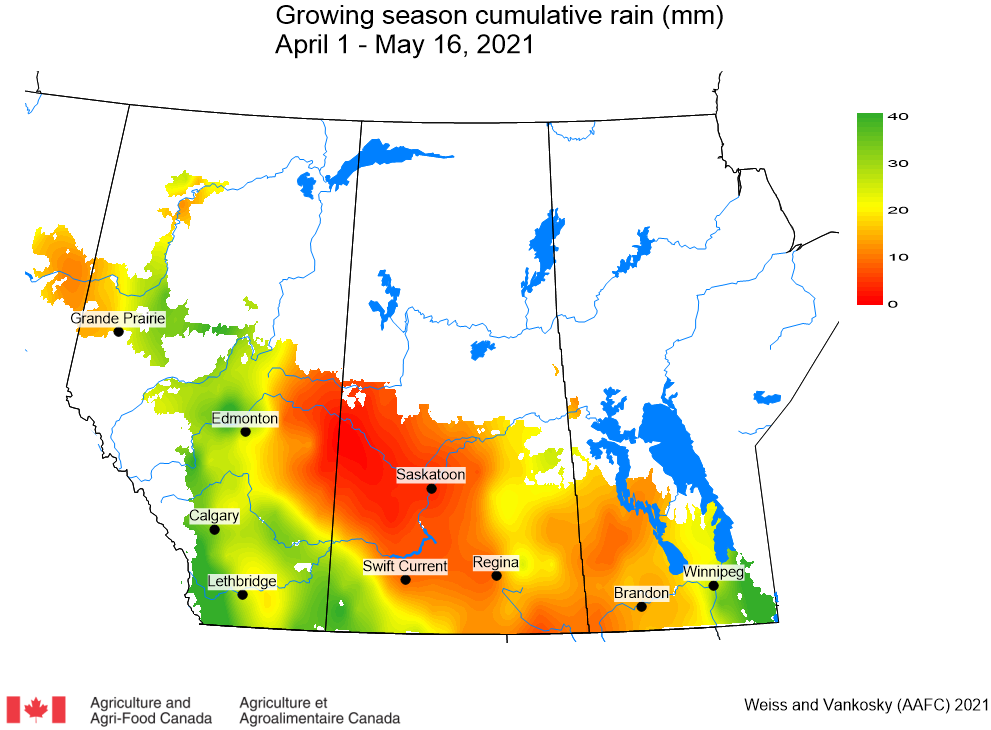
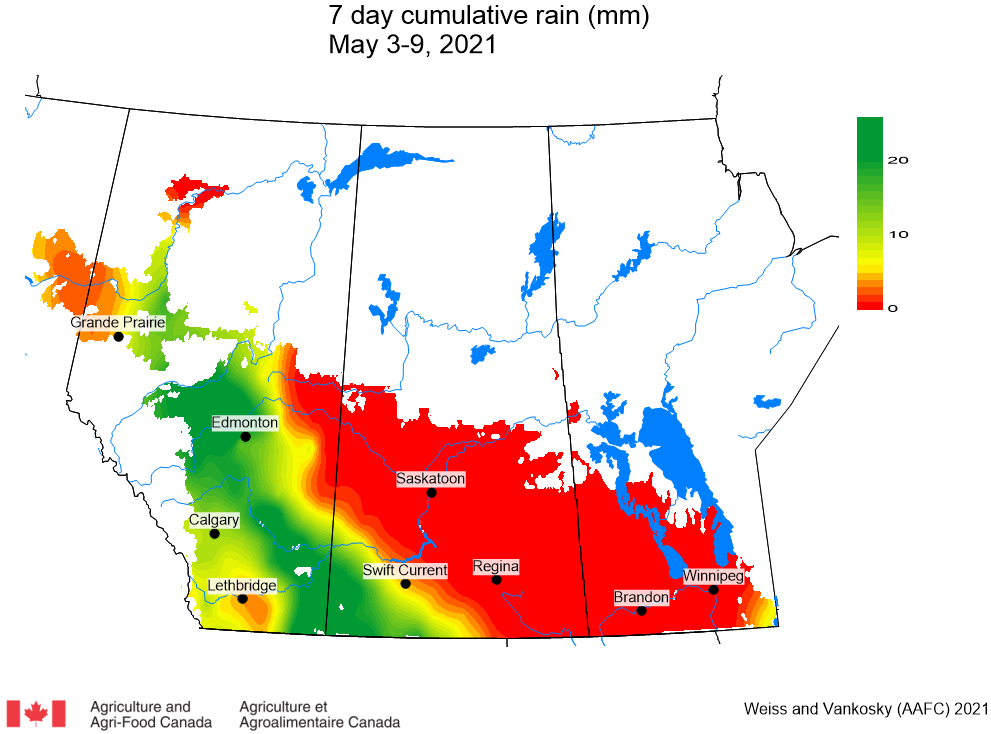
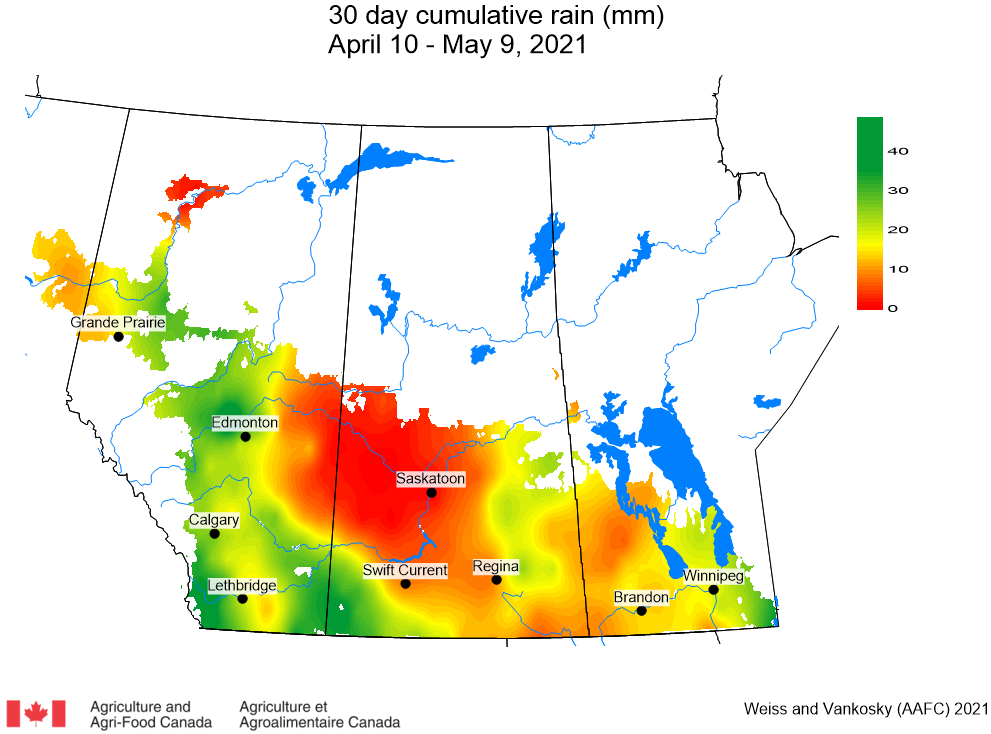
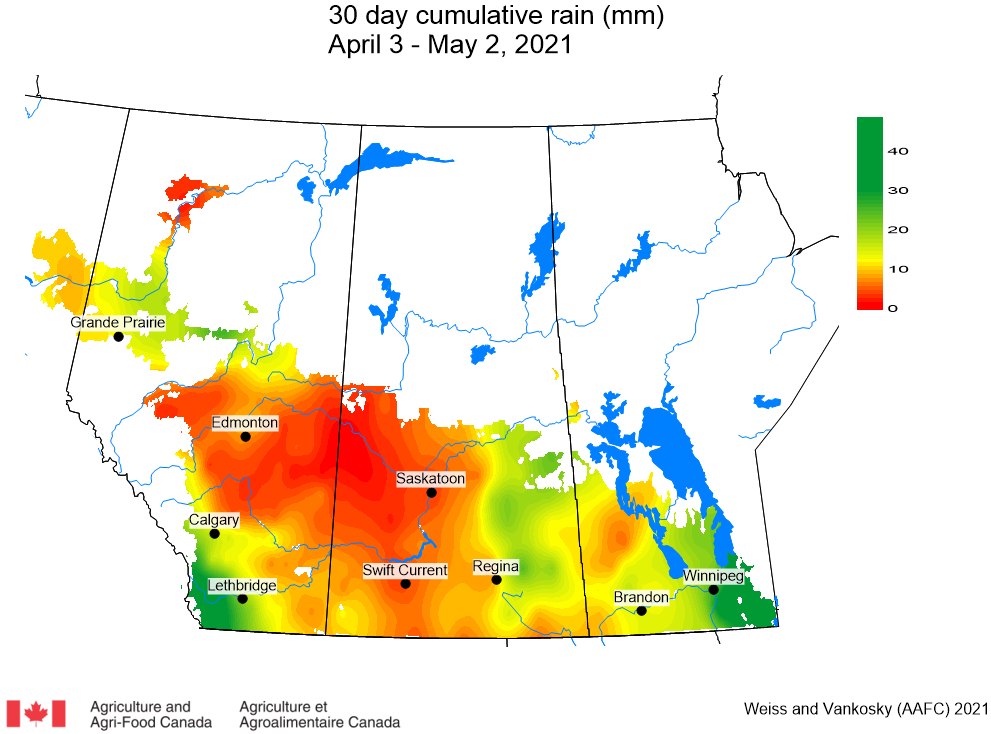
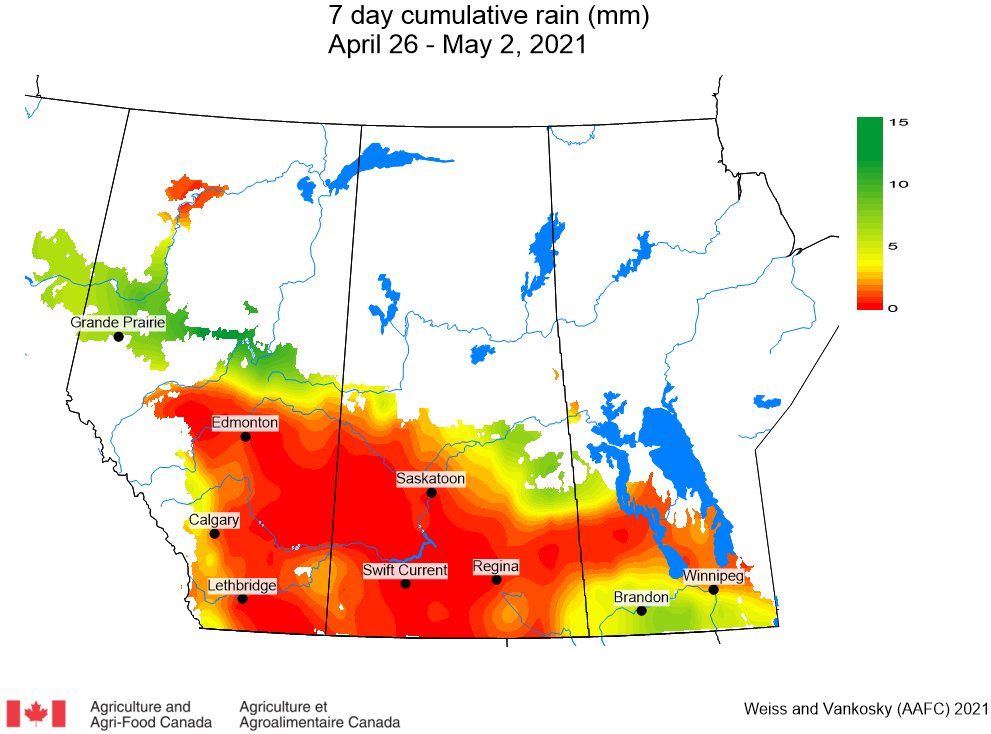
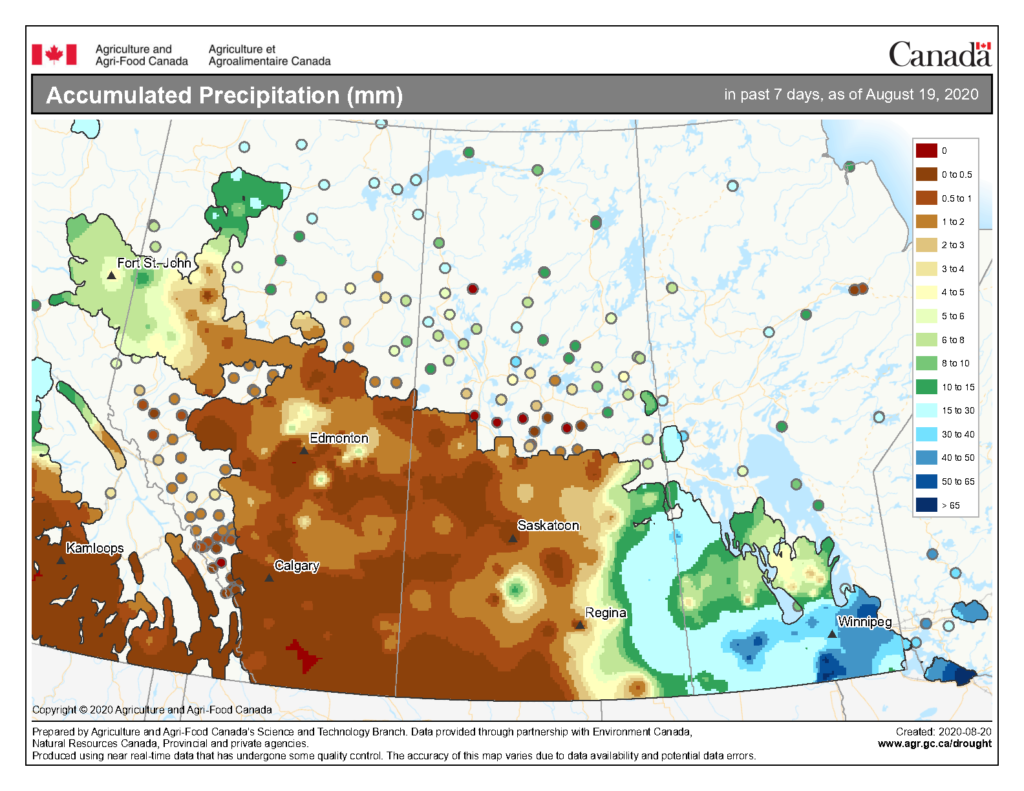
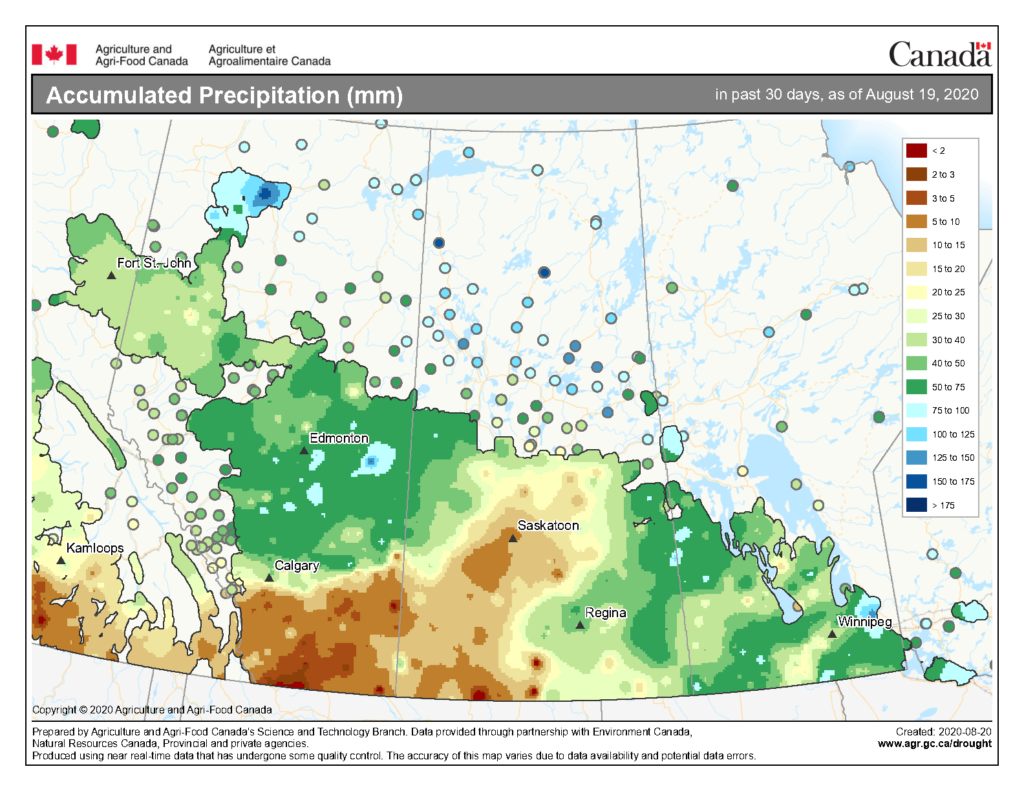
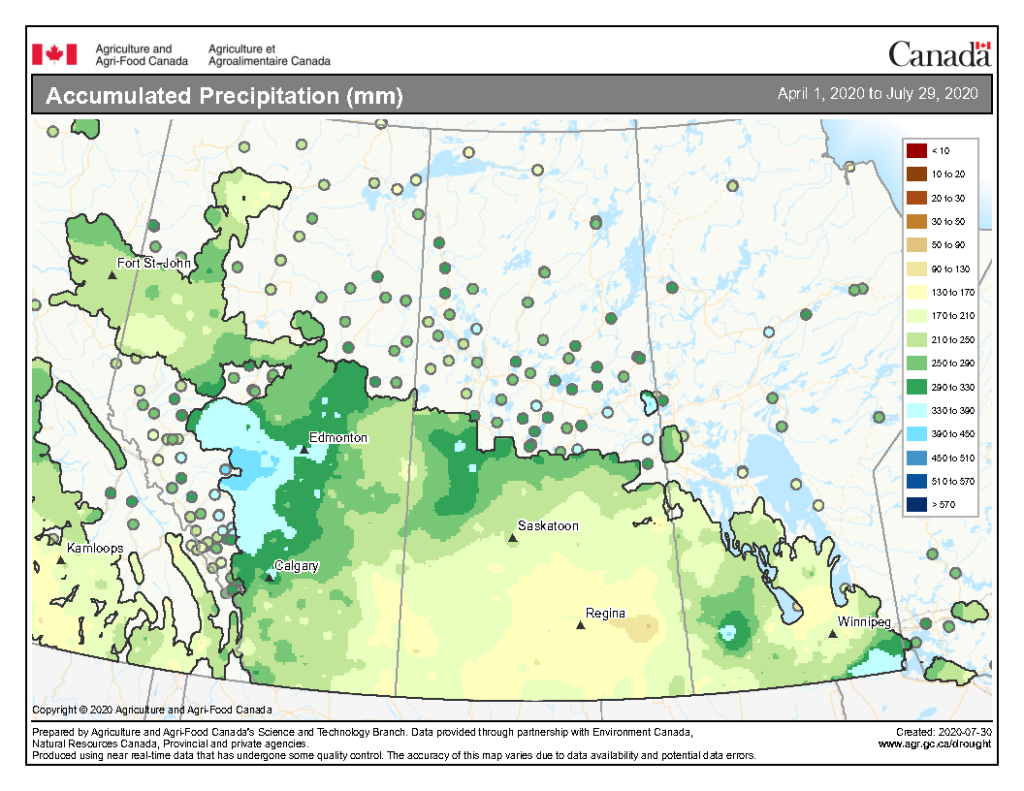
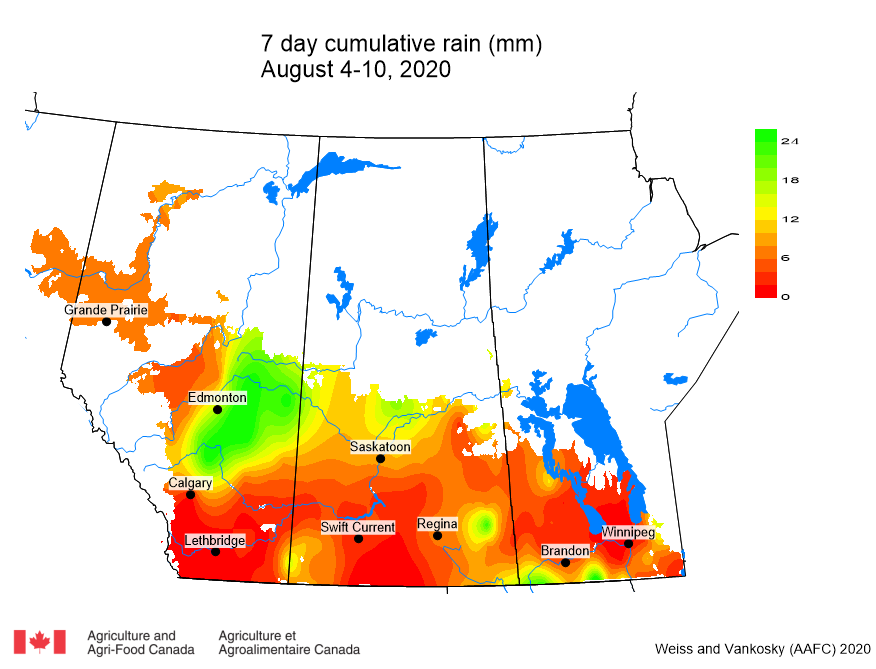
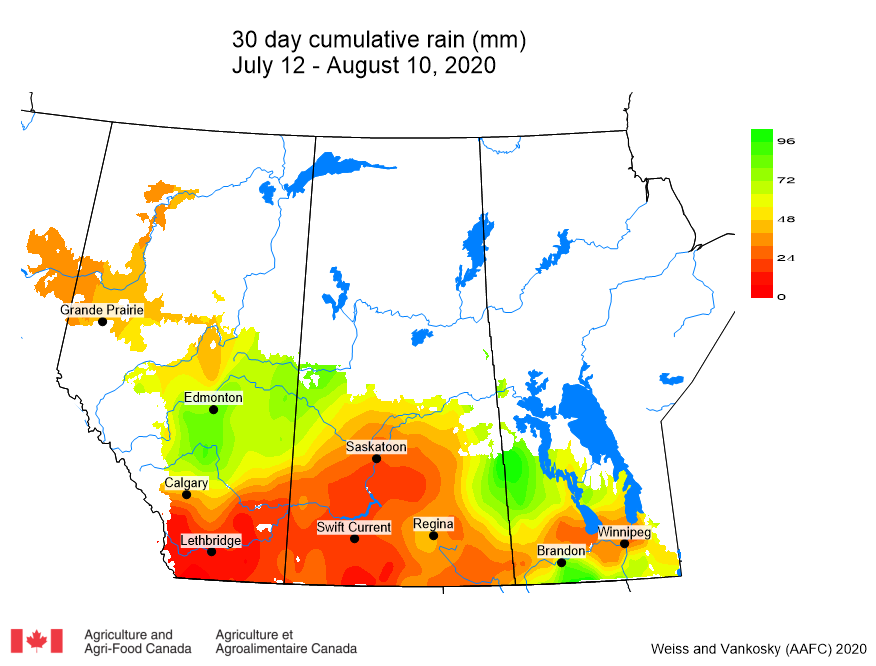
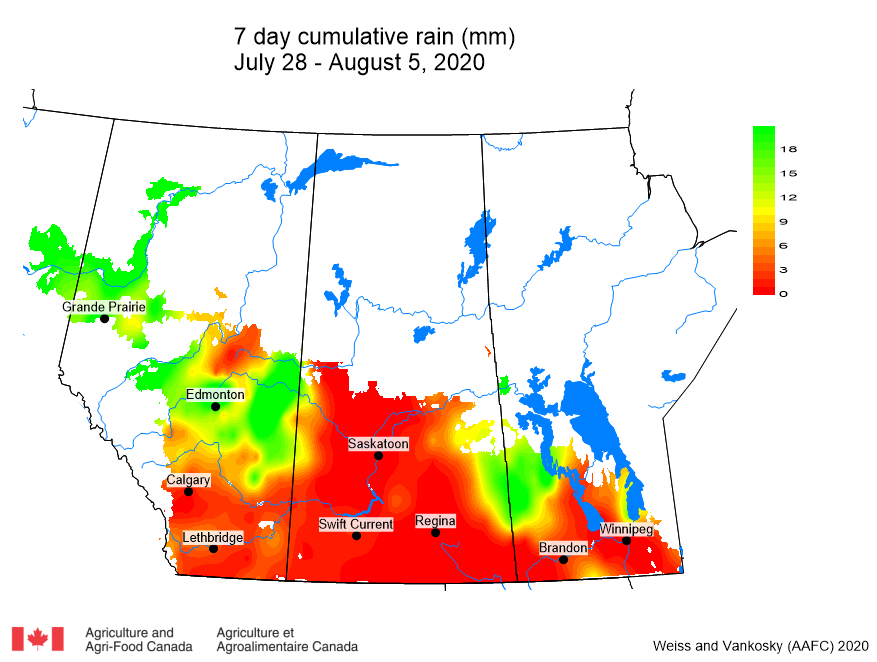
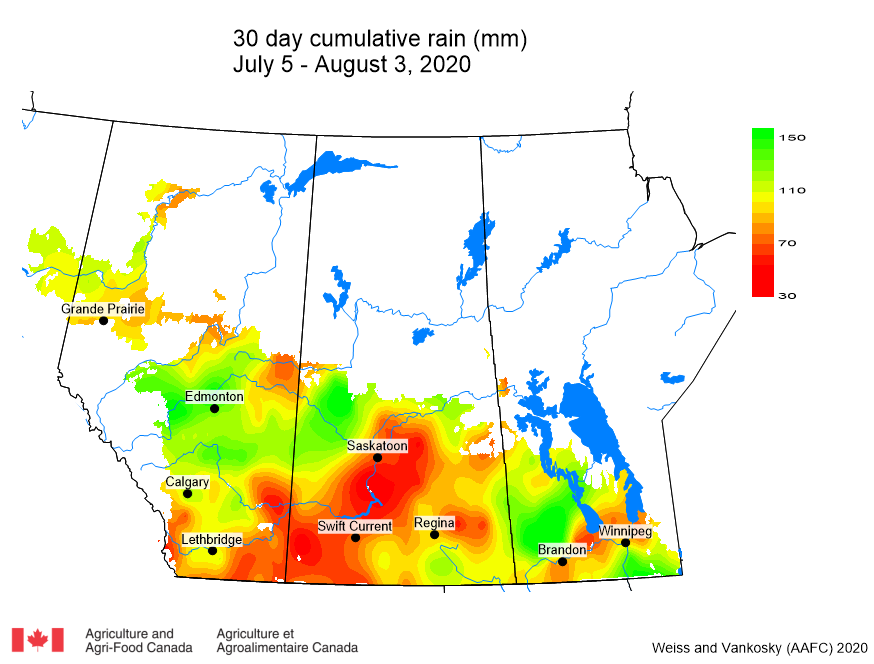
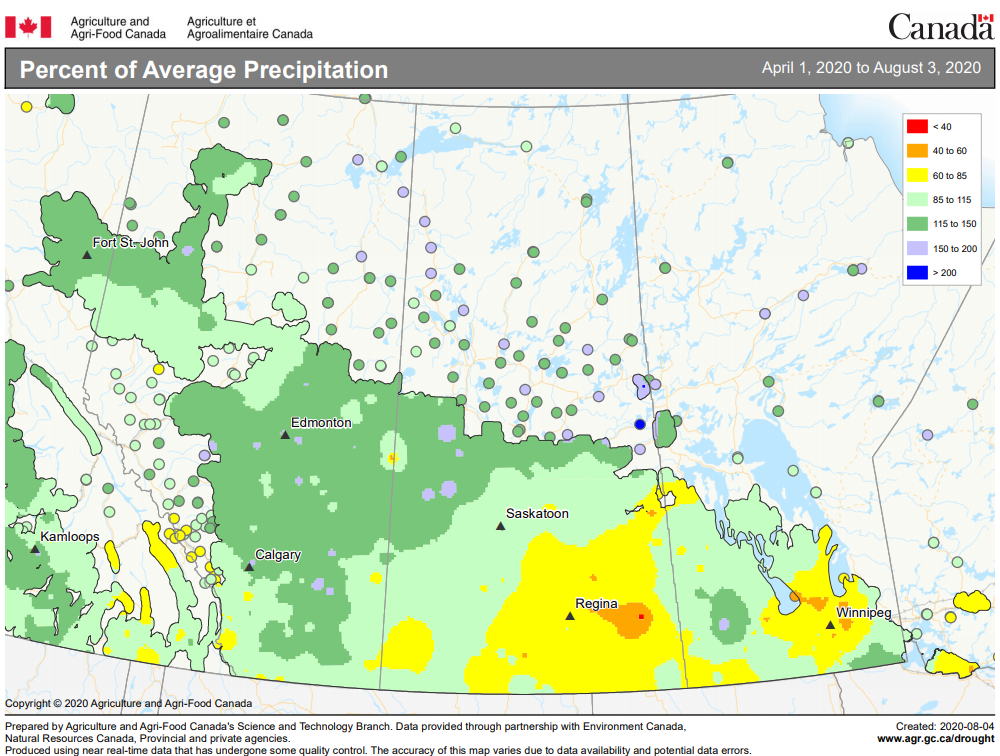
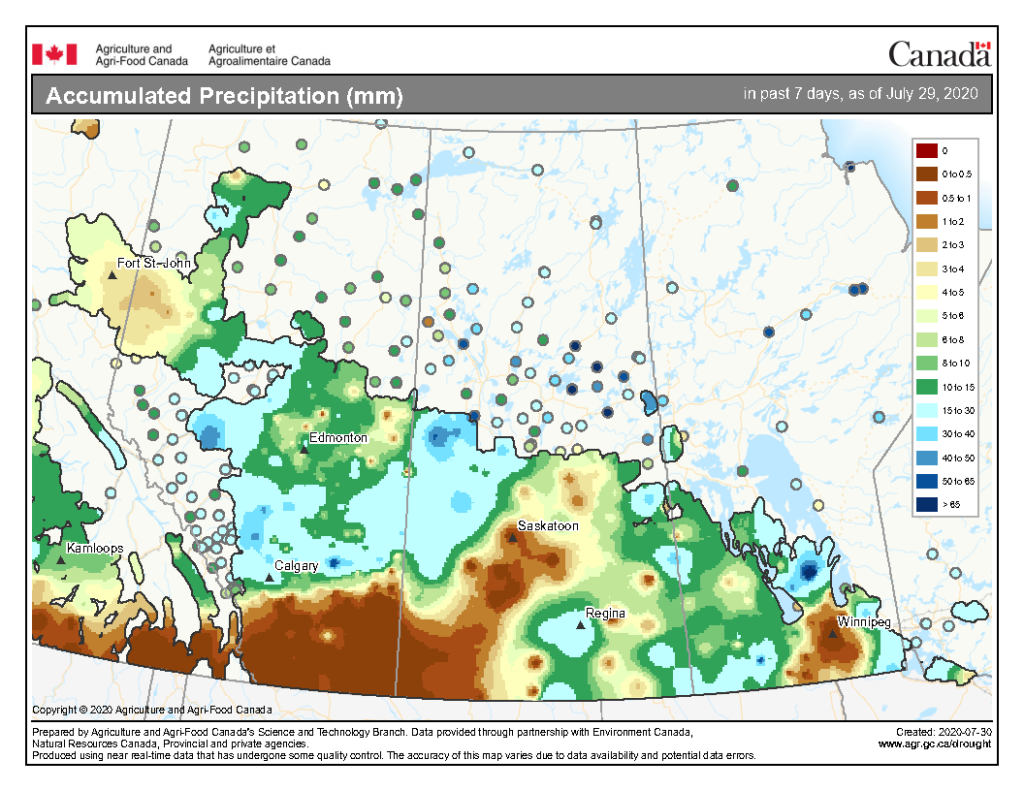
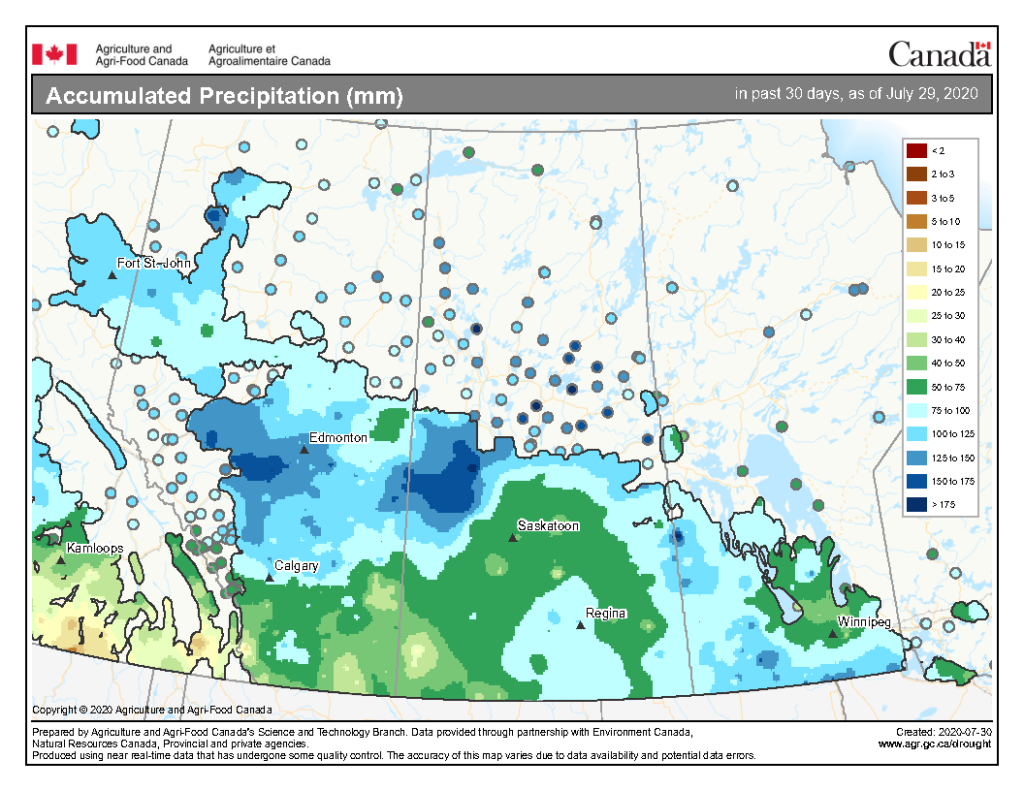
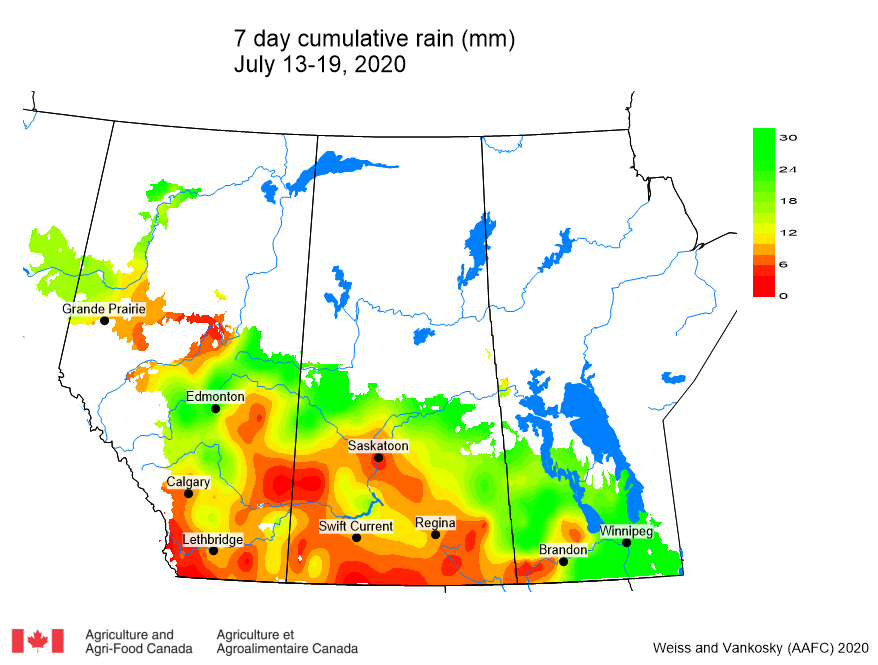
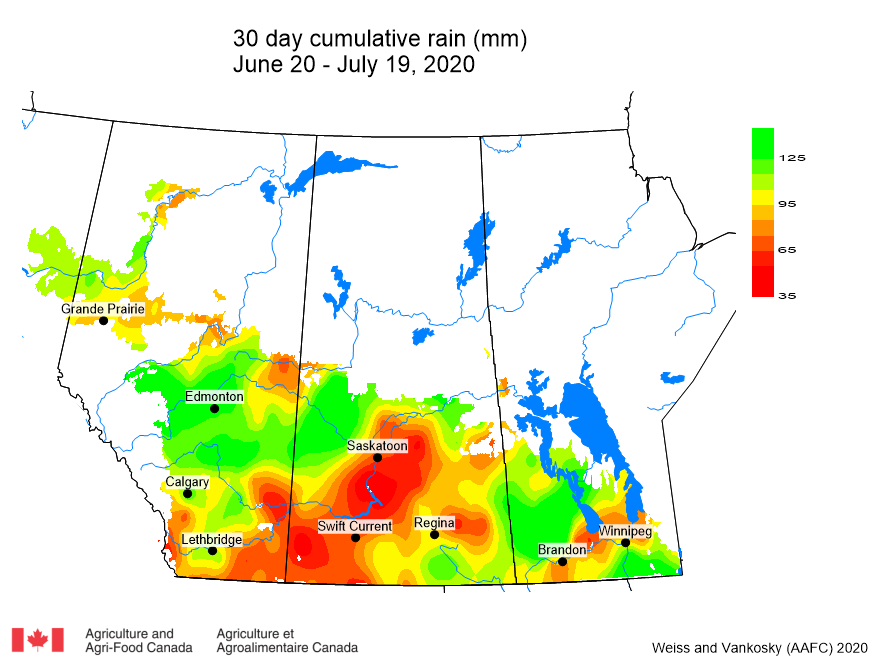
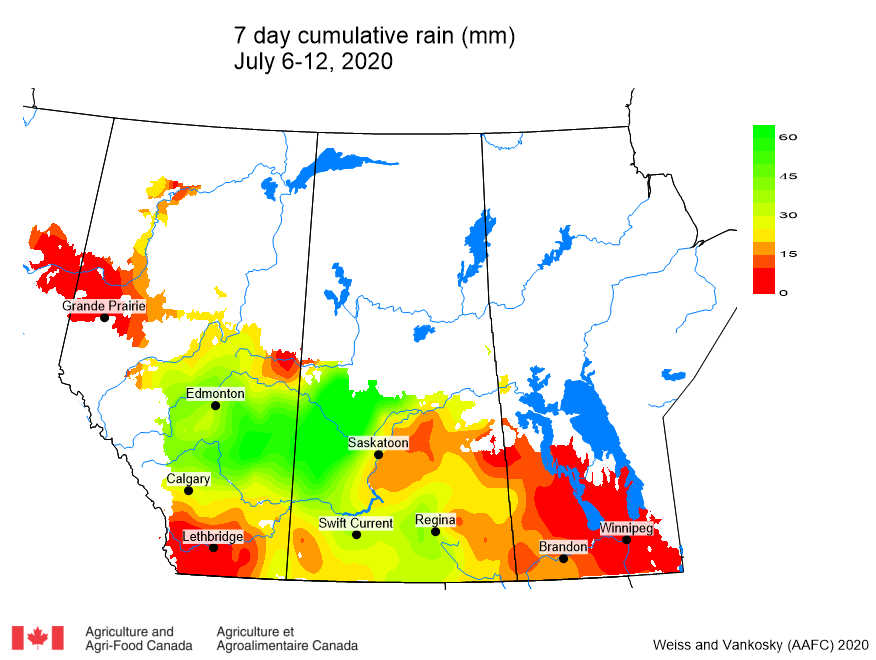
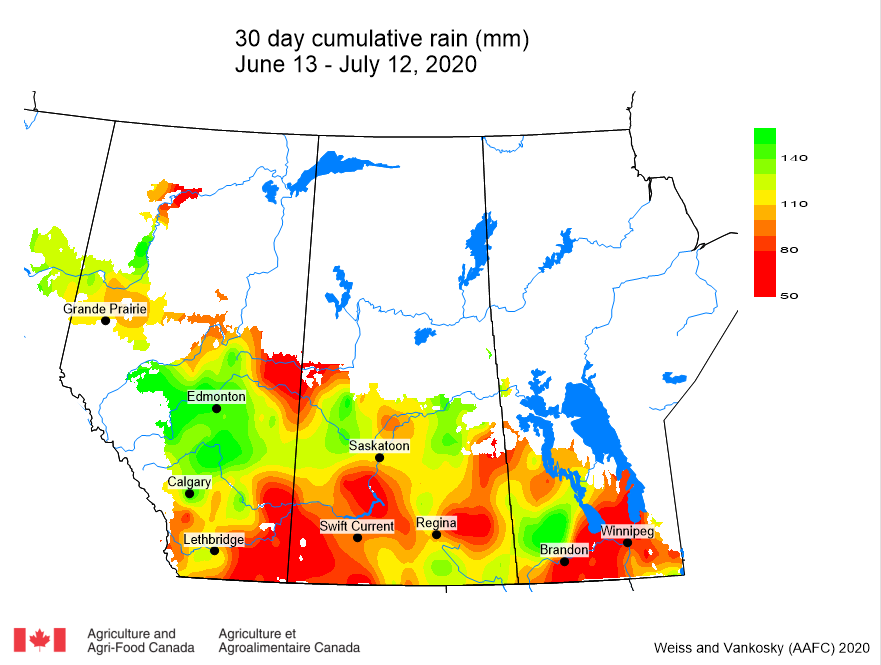
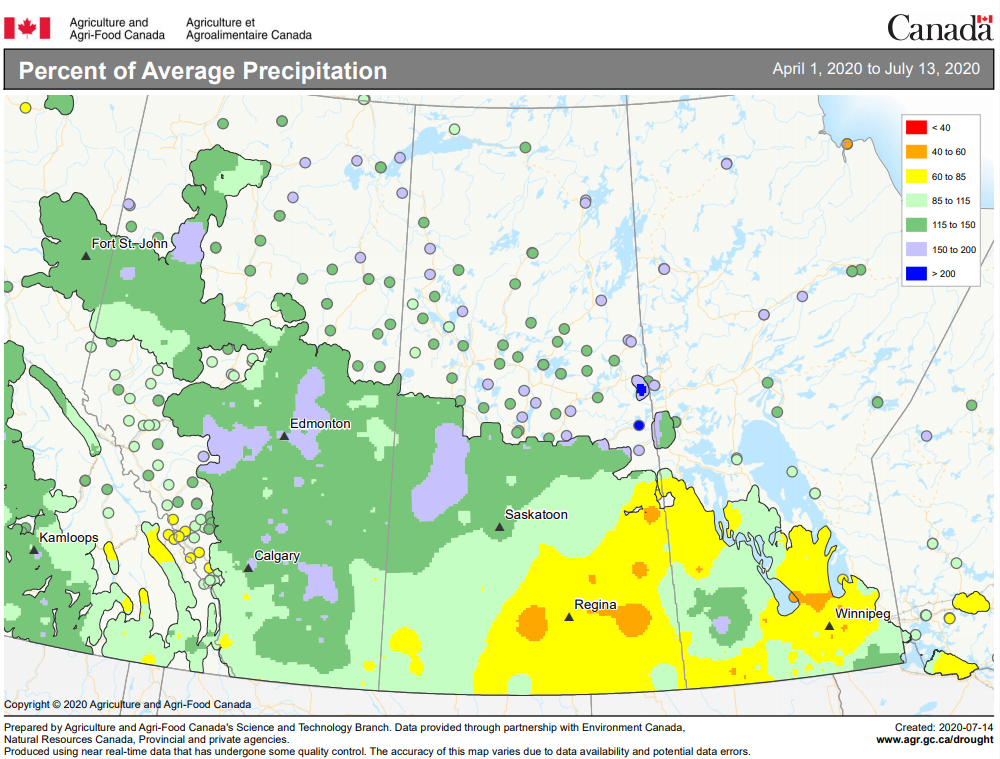
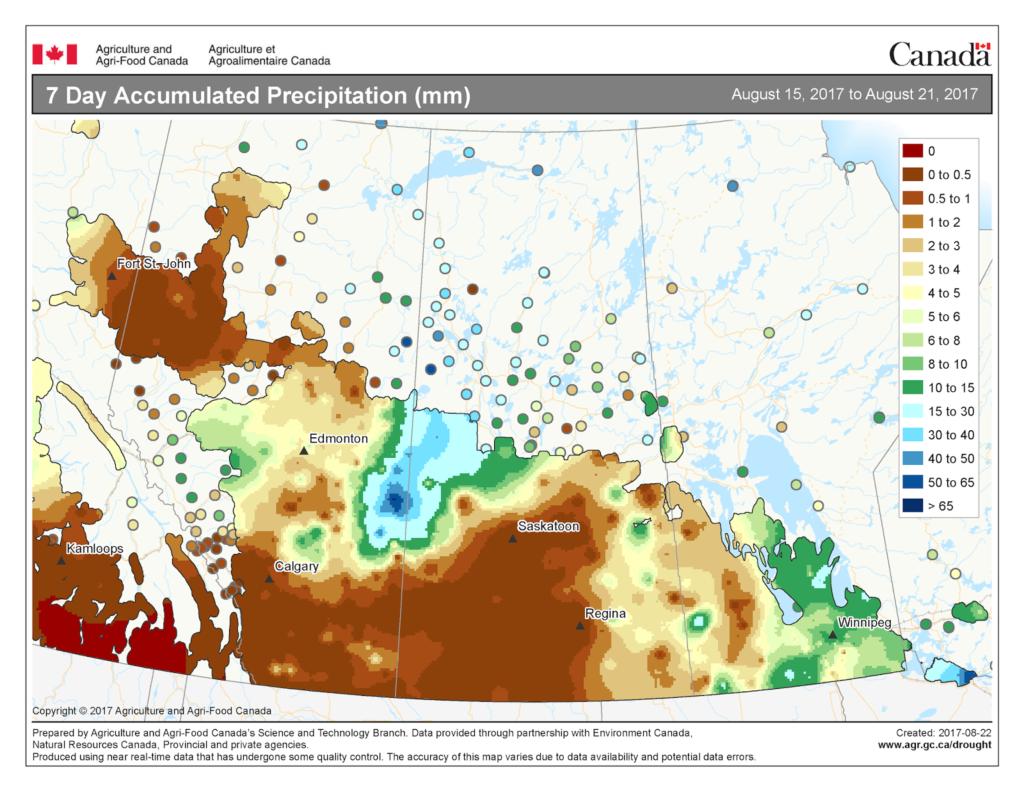
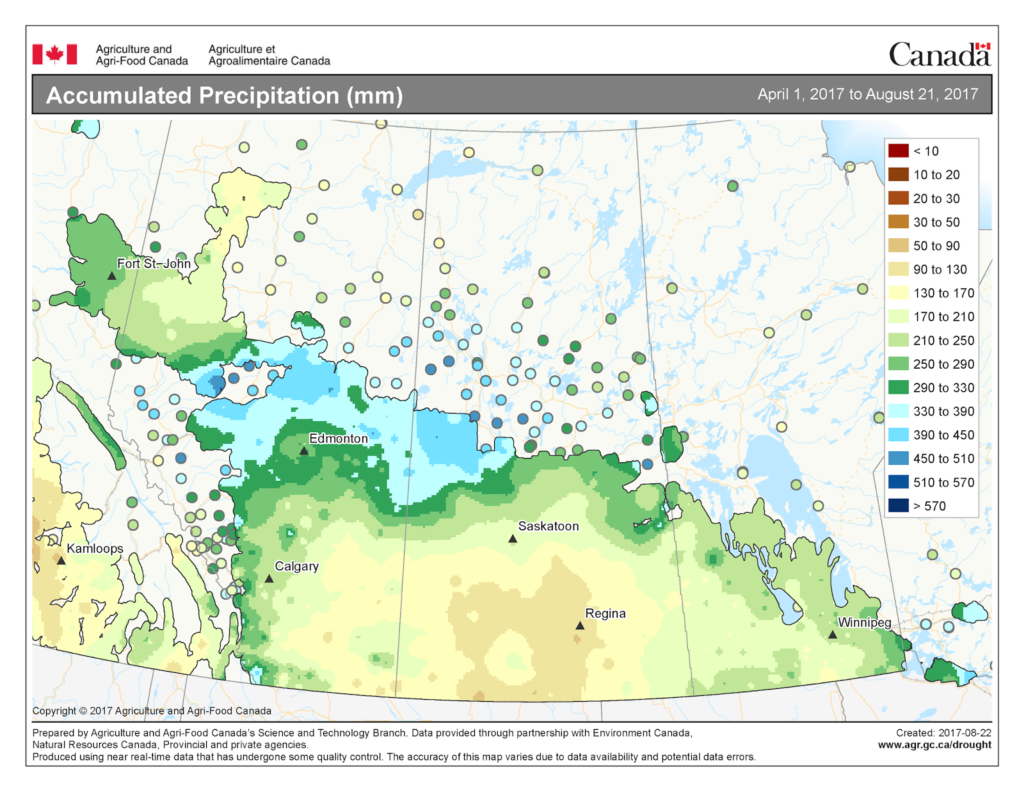
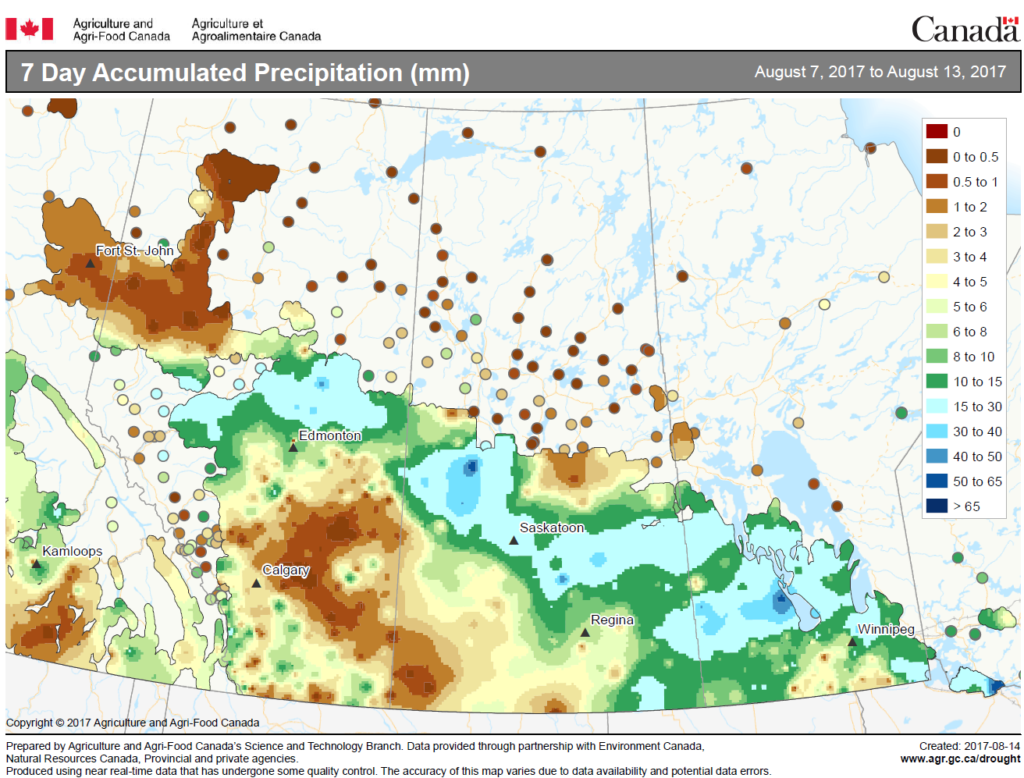
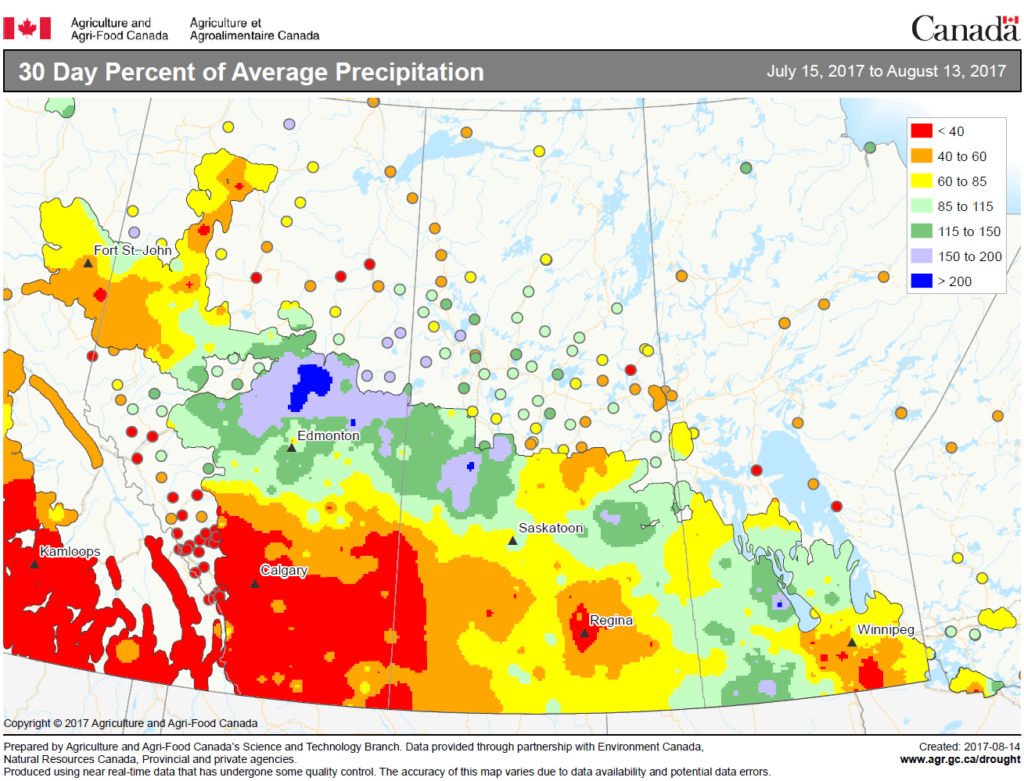
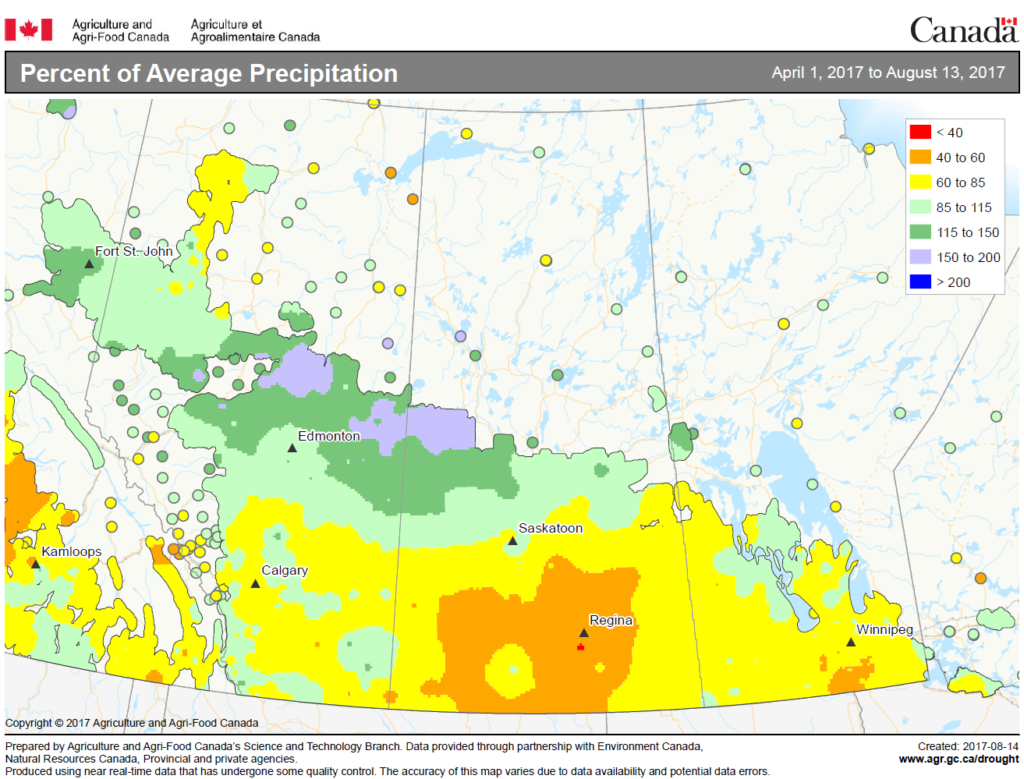
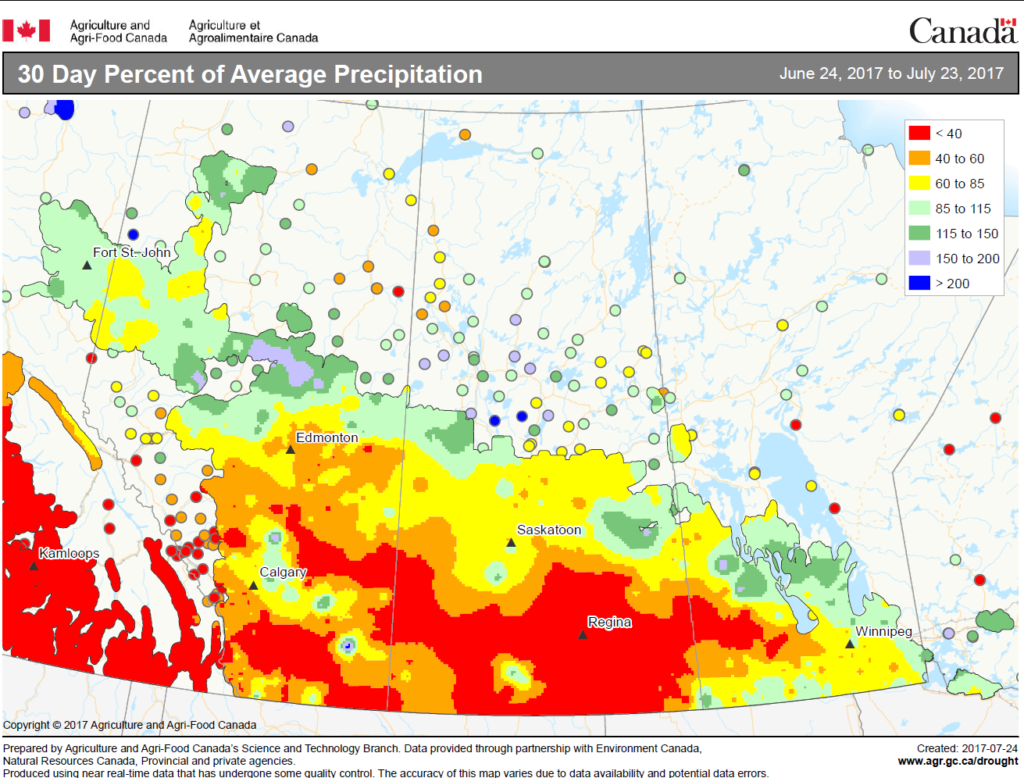
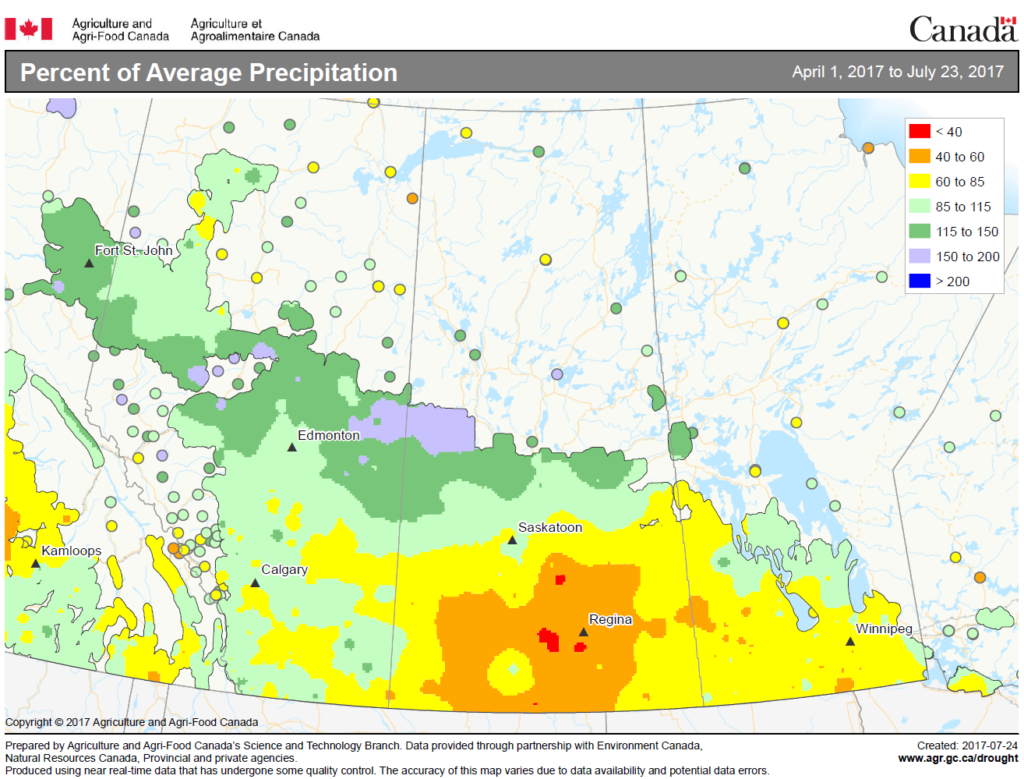
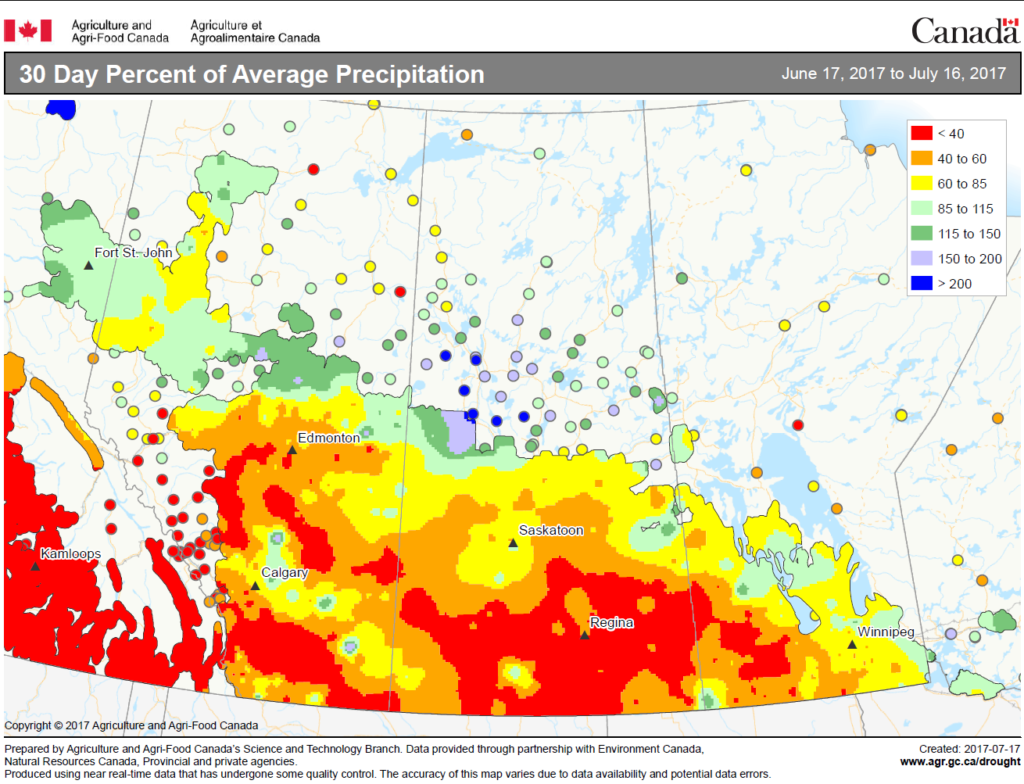
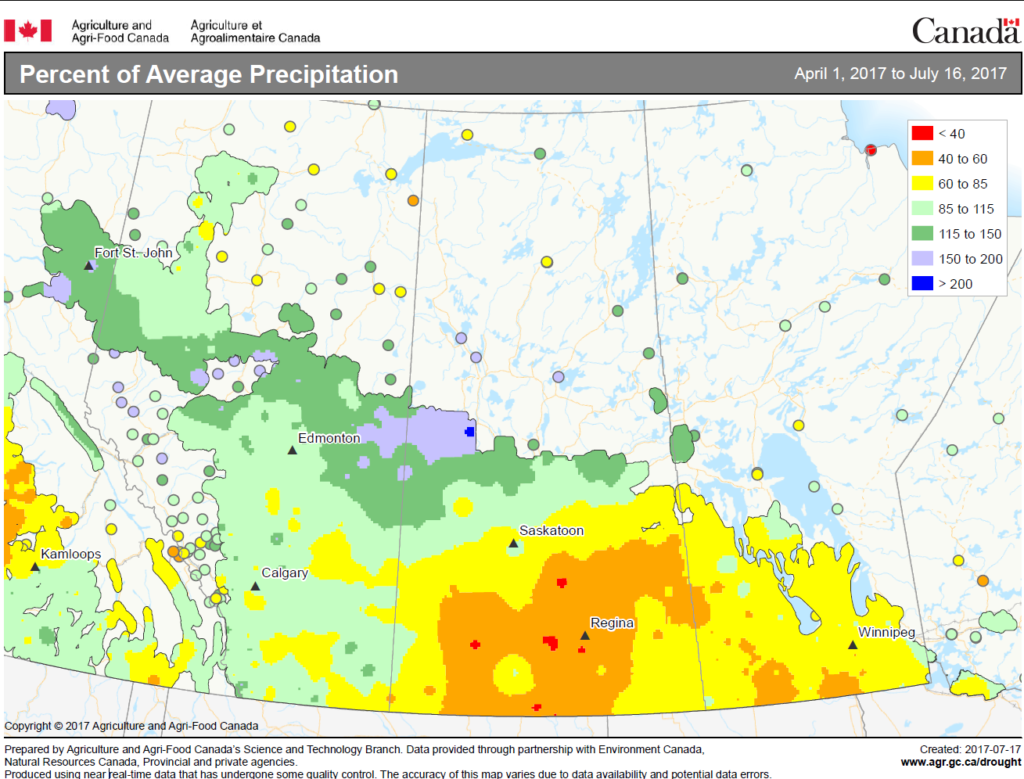
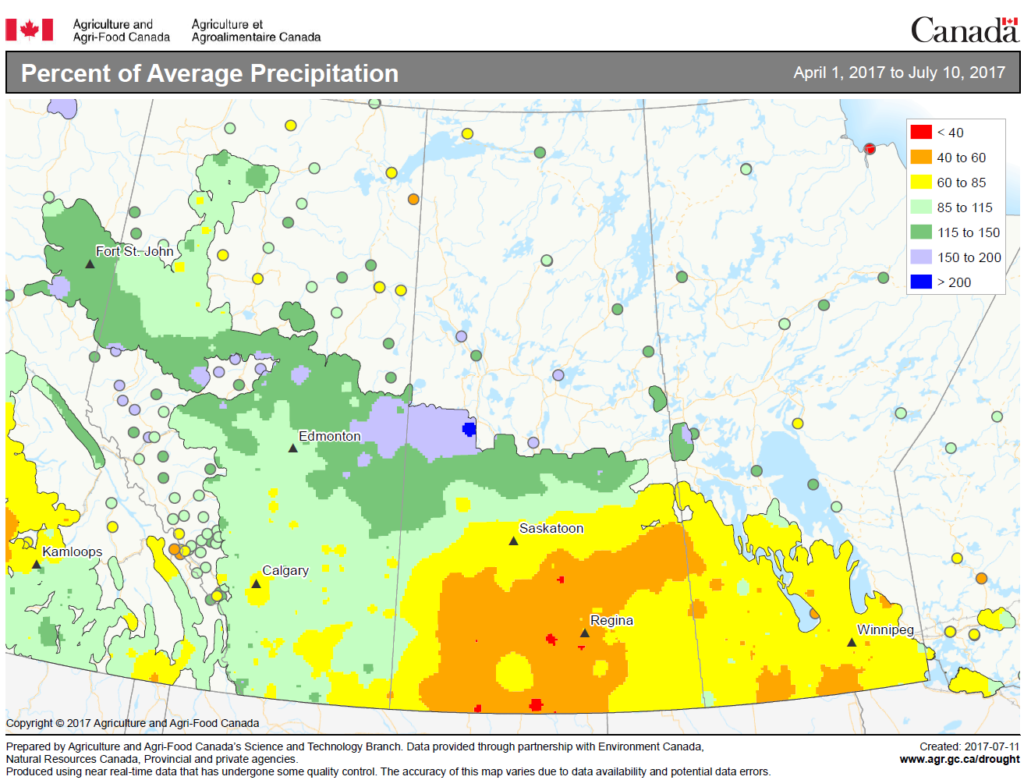
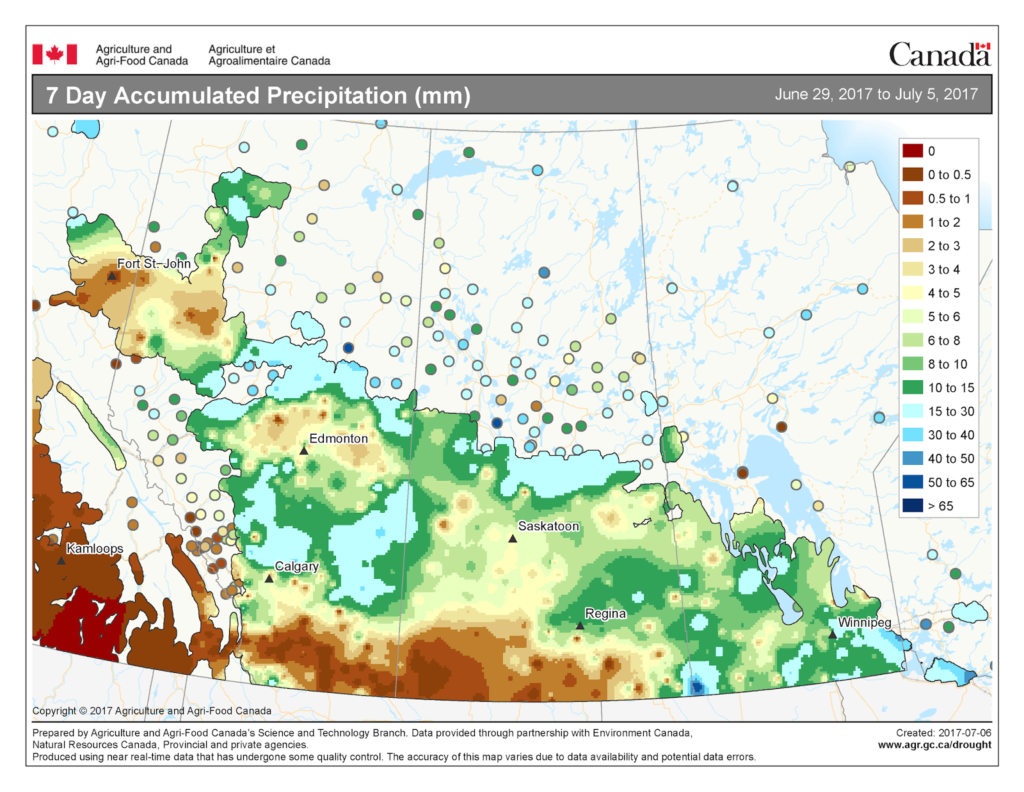
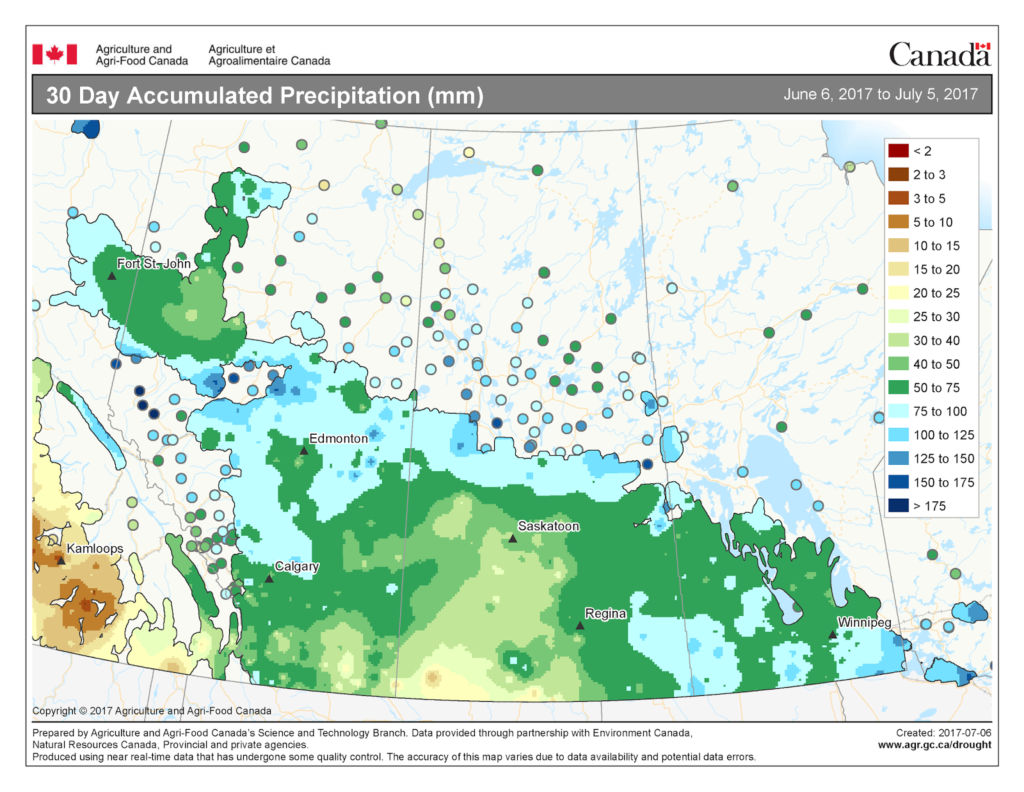
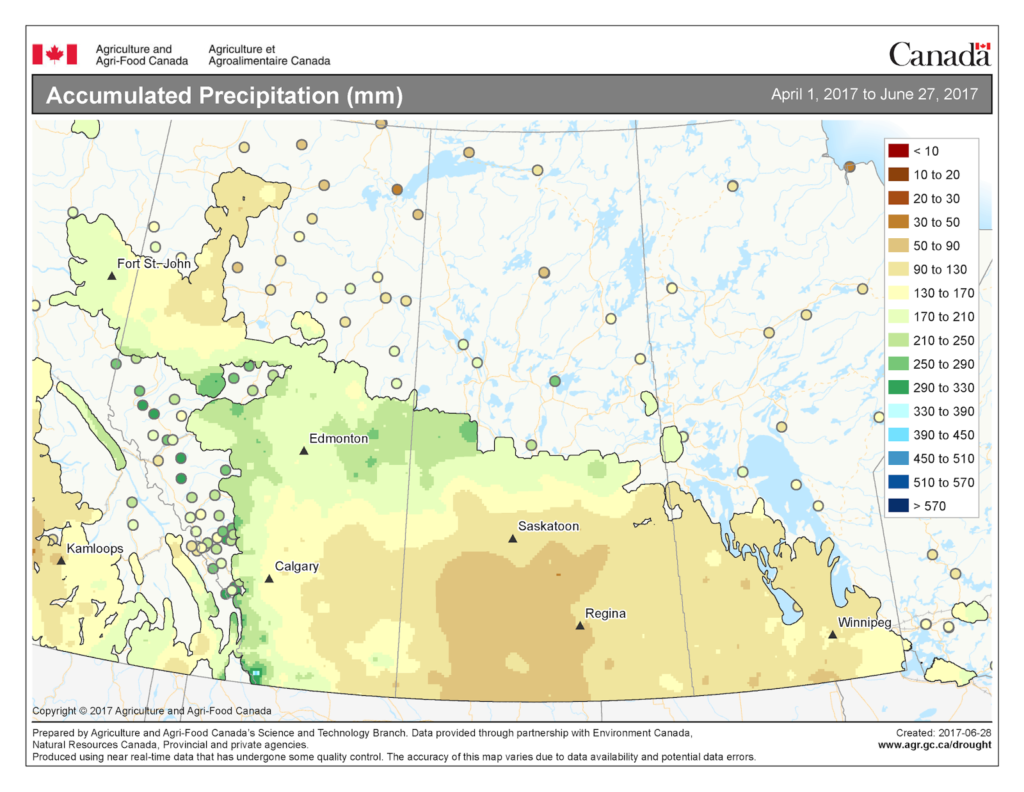
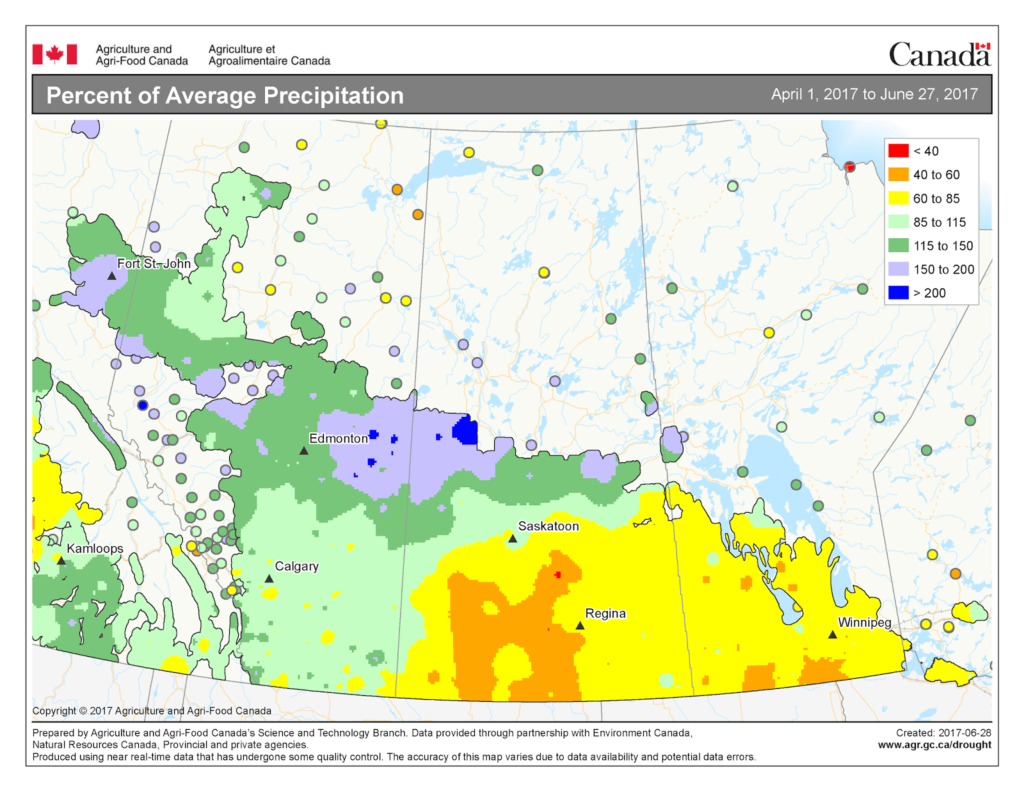
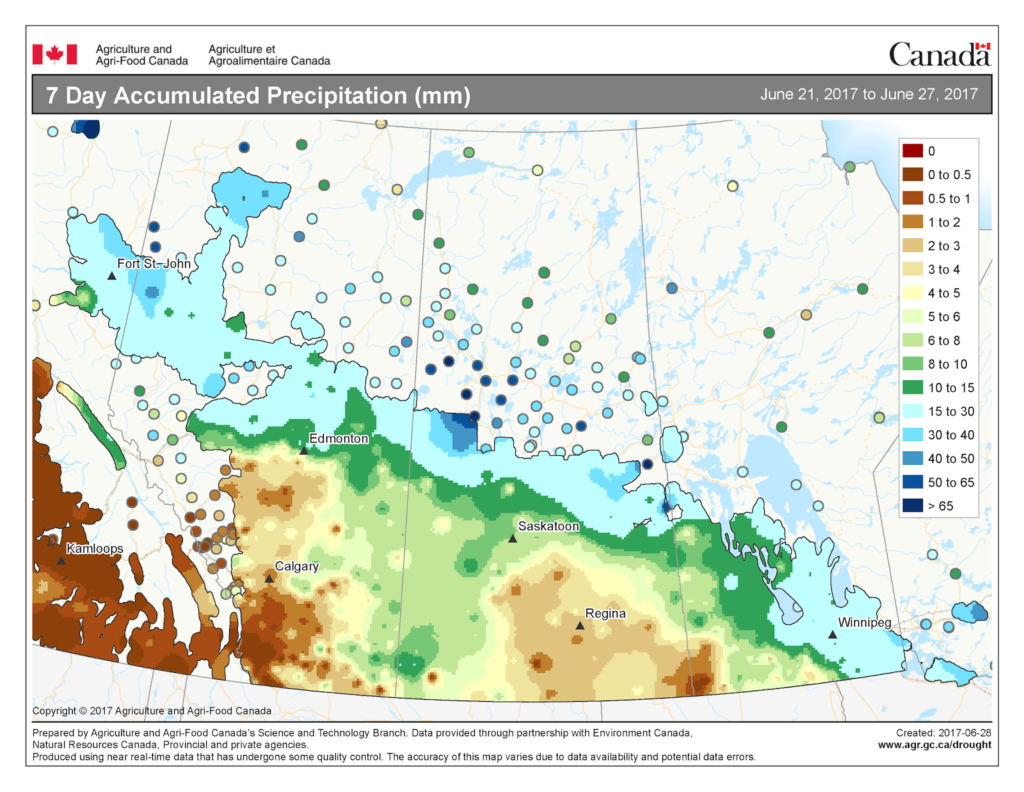
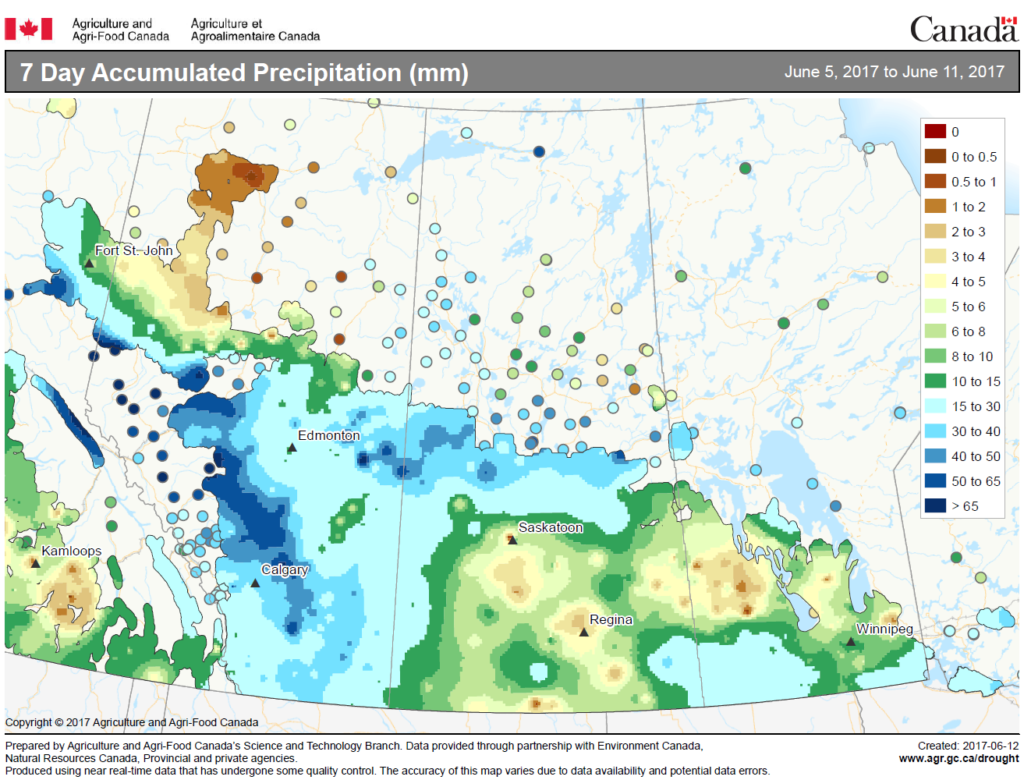
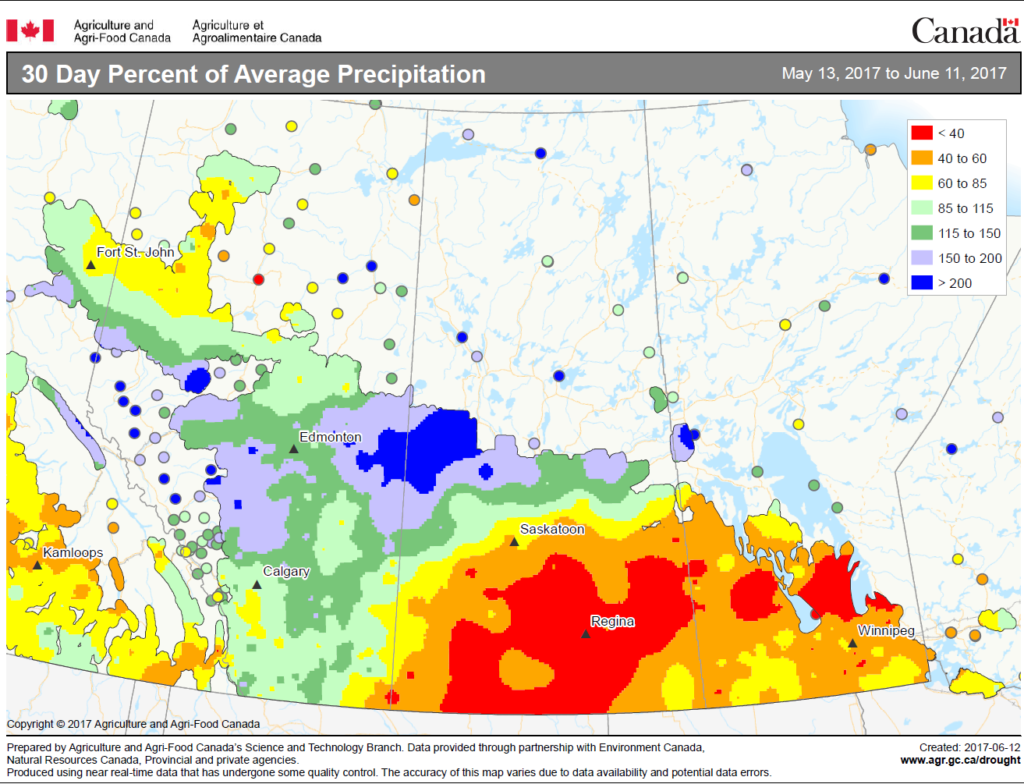
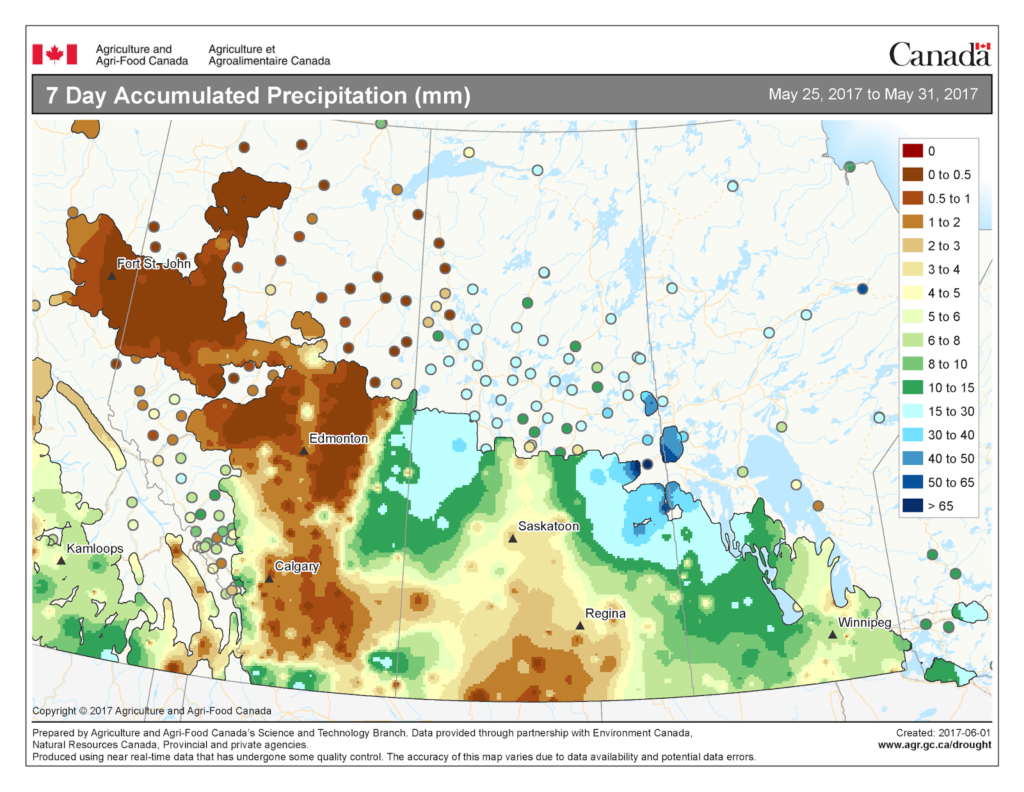
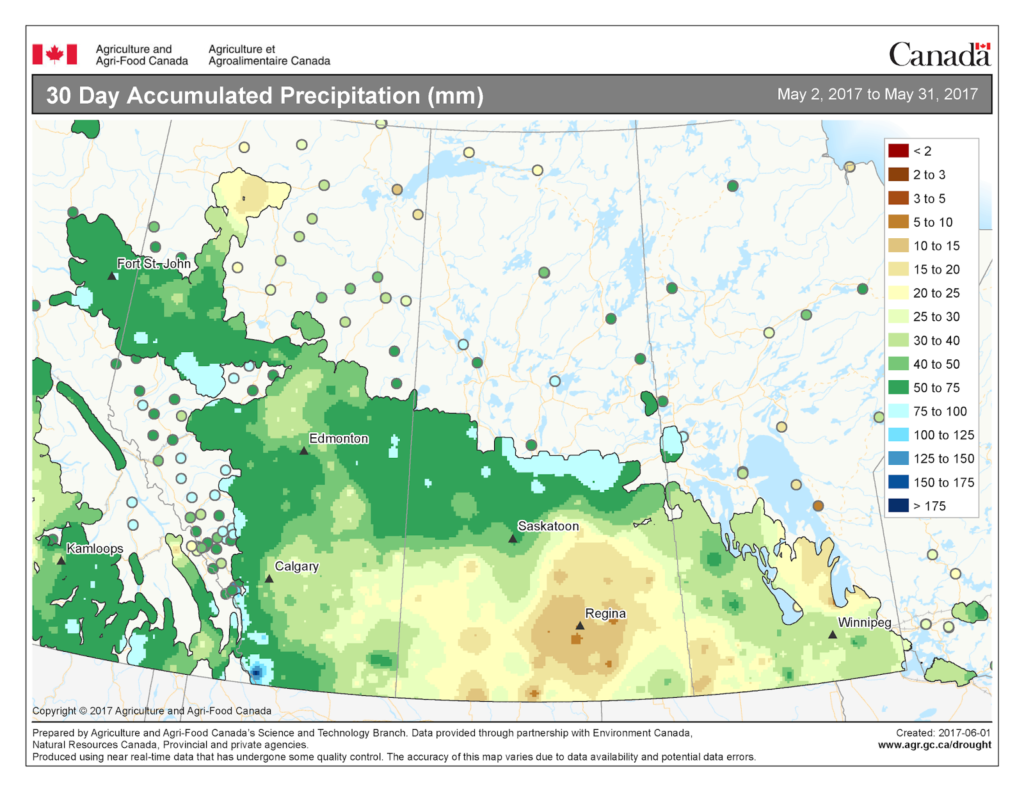
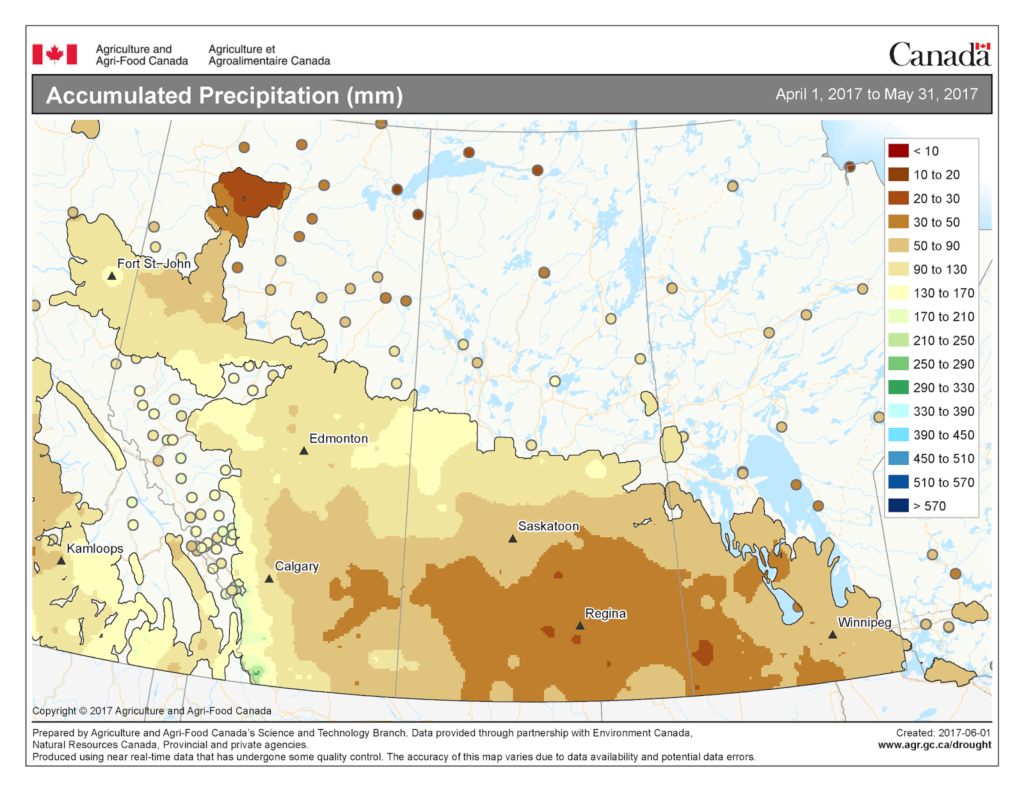
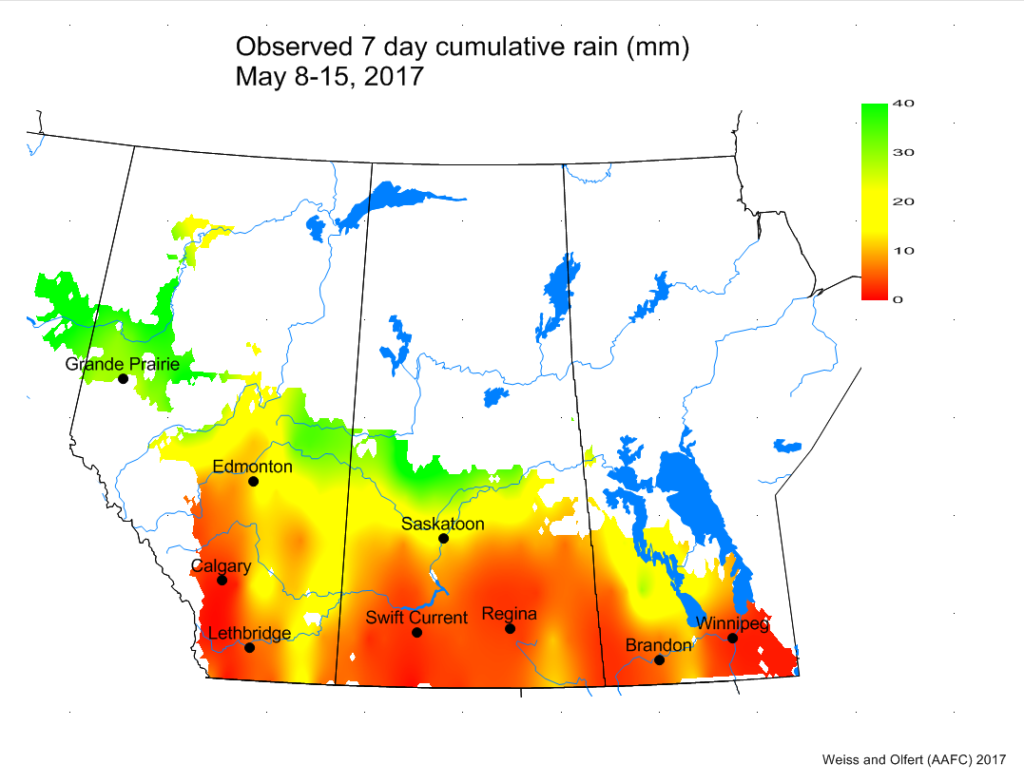
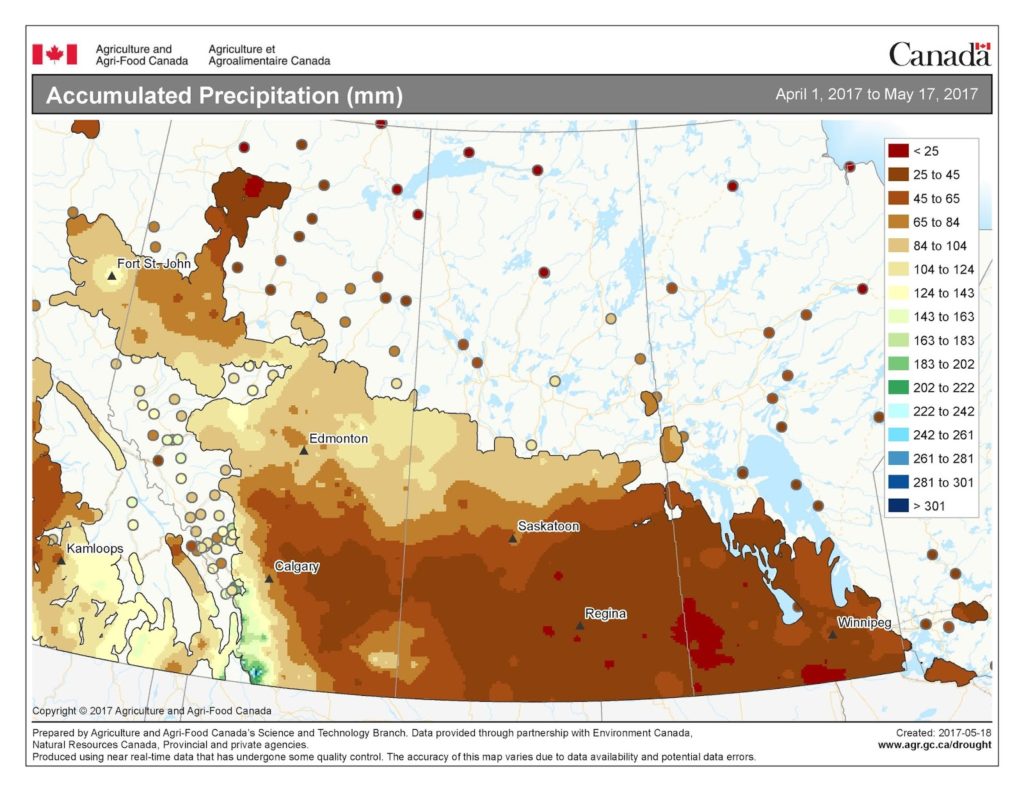
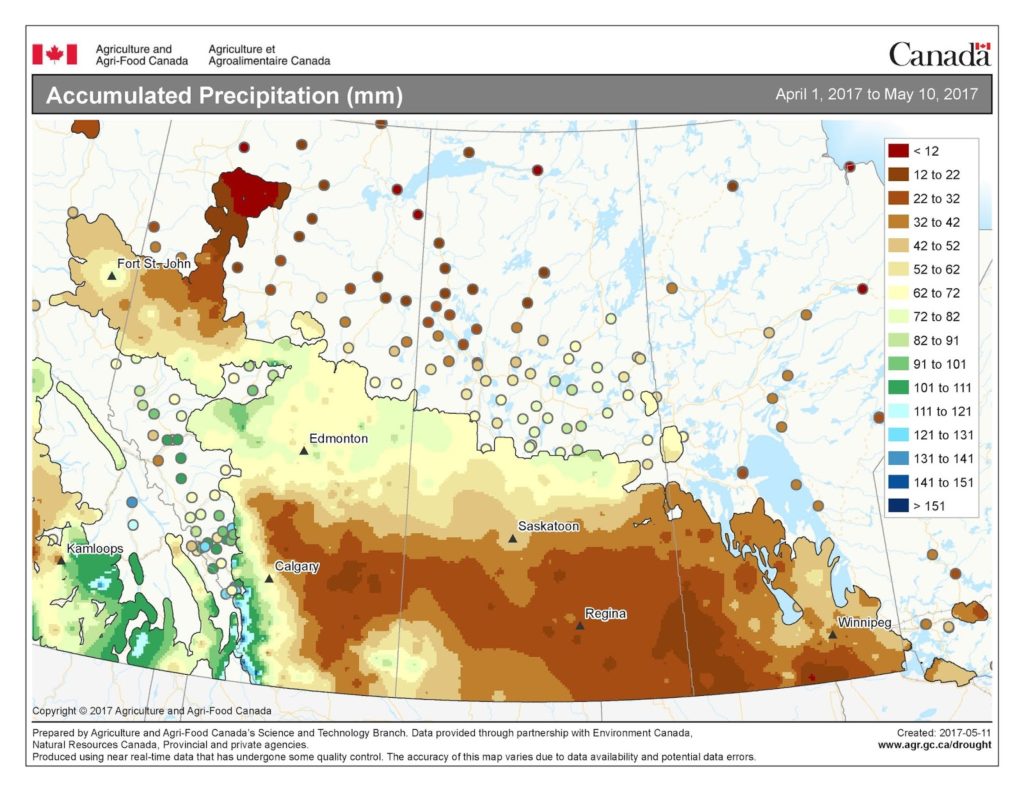
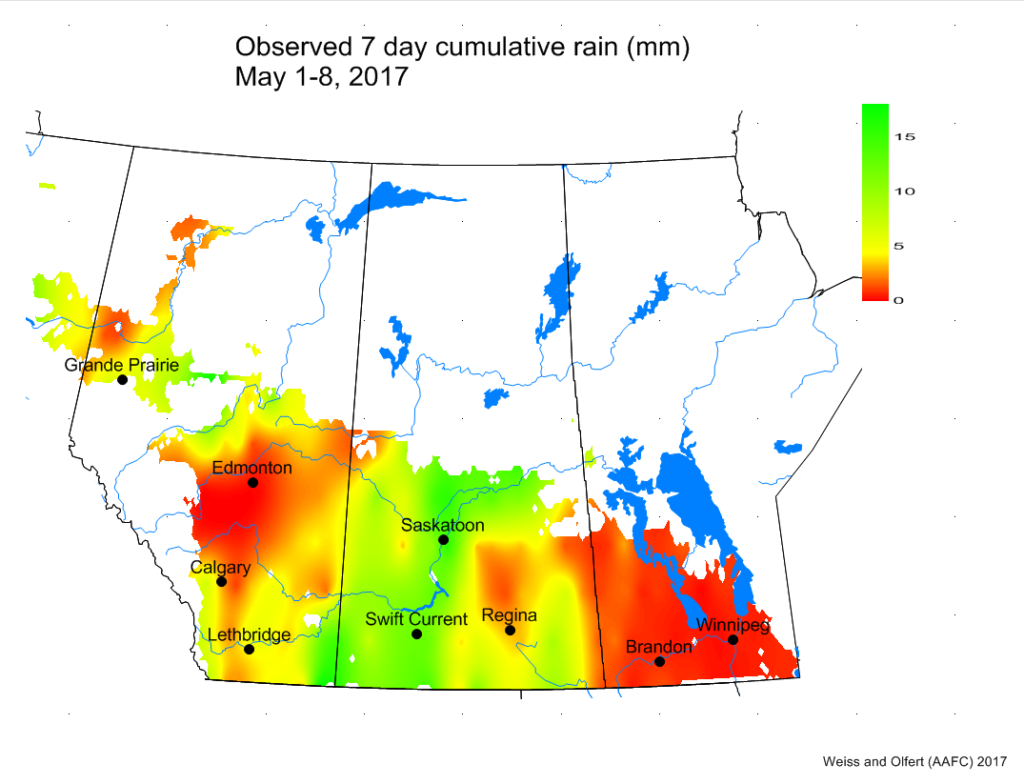
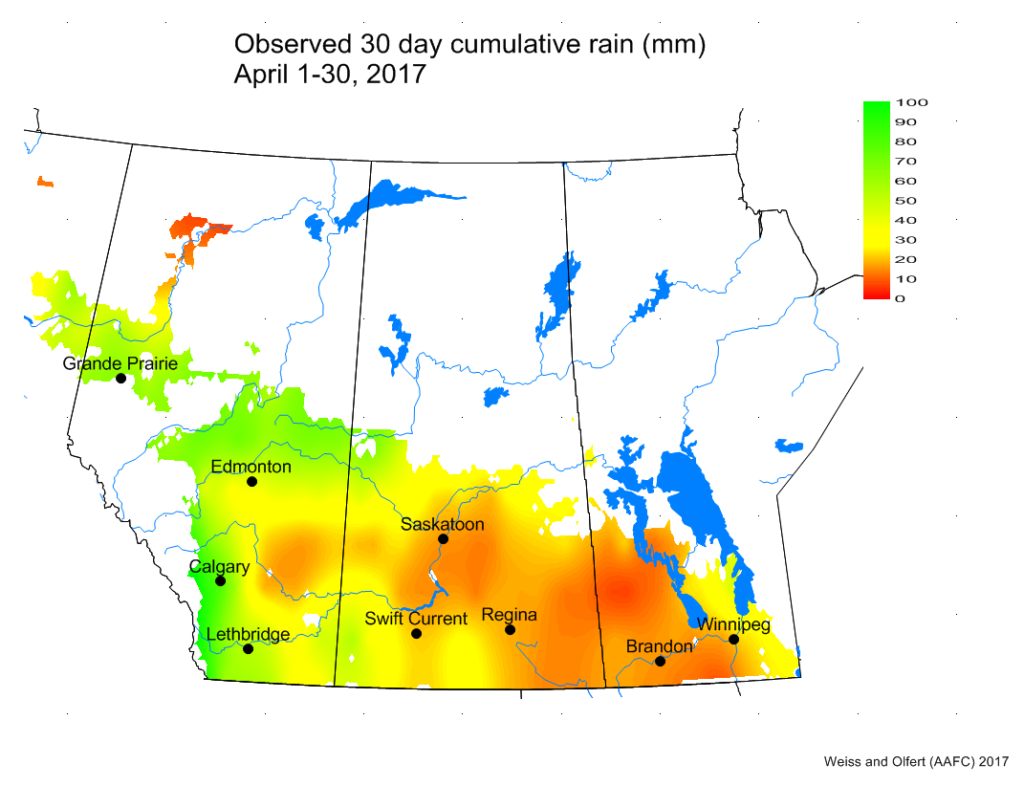
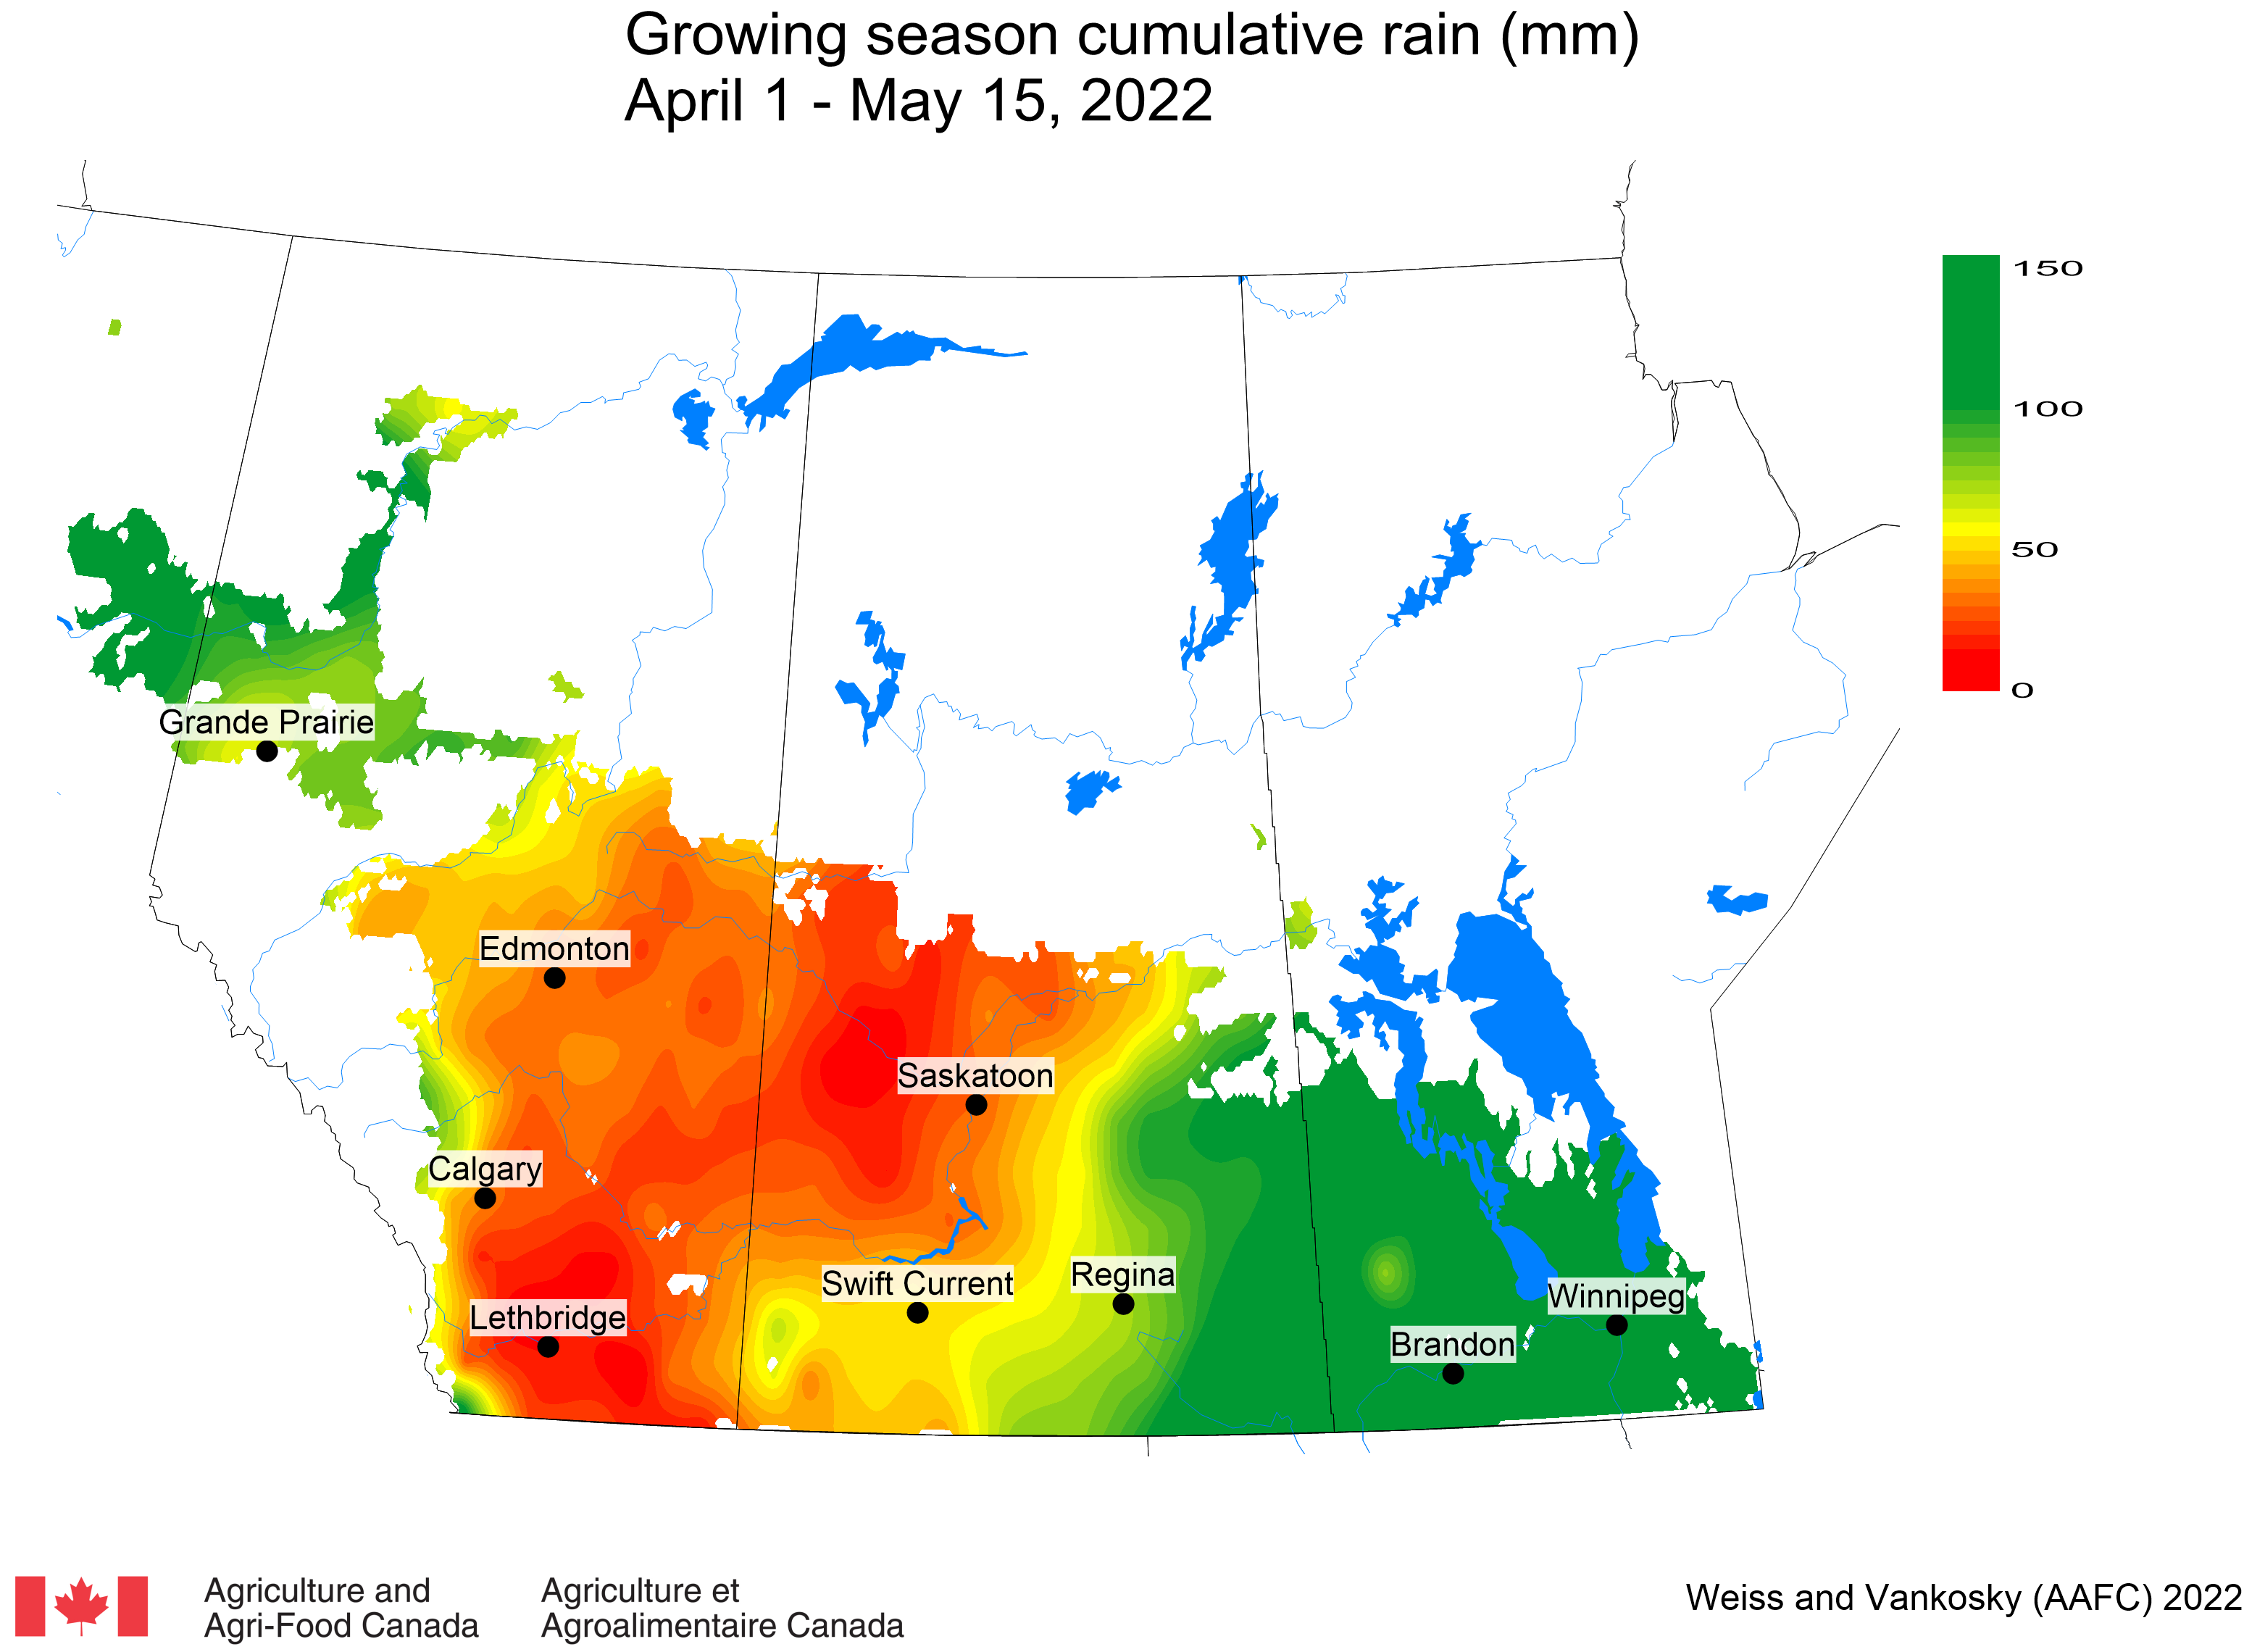
The average cumulative rainfall amounts over the last seven days across the Canadian prairies was 25 mm (Fig. 4; June 16 – June 22). Locally, higher rainfall was reported in areas surrounding Calgary and Lethbridge in Alberta plus Kindersley and Rosetown in Saskatchewan; between 70 – 100 mm of rain fell in those areas (Fig. 4). Outside of the areas receiving significant rainfall events in the last 7 days, the cumulative 30-day rainfall remains less than 70 mm for most of western Canada (Fig. 5). Over the growing season (April 1-June 22, 2025), areas surrounding Lethbridge and Calgary AB have received >200 mm of cumulative rainfall, whereas much of Saskatchewan, Manitoba, and the Peace River region have received <100 mm (Fig. 6).
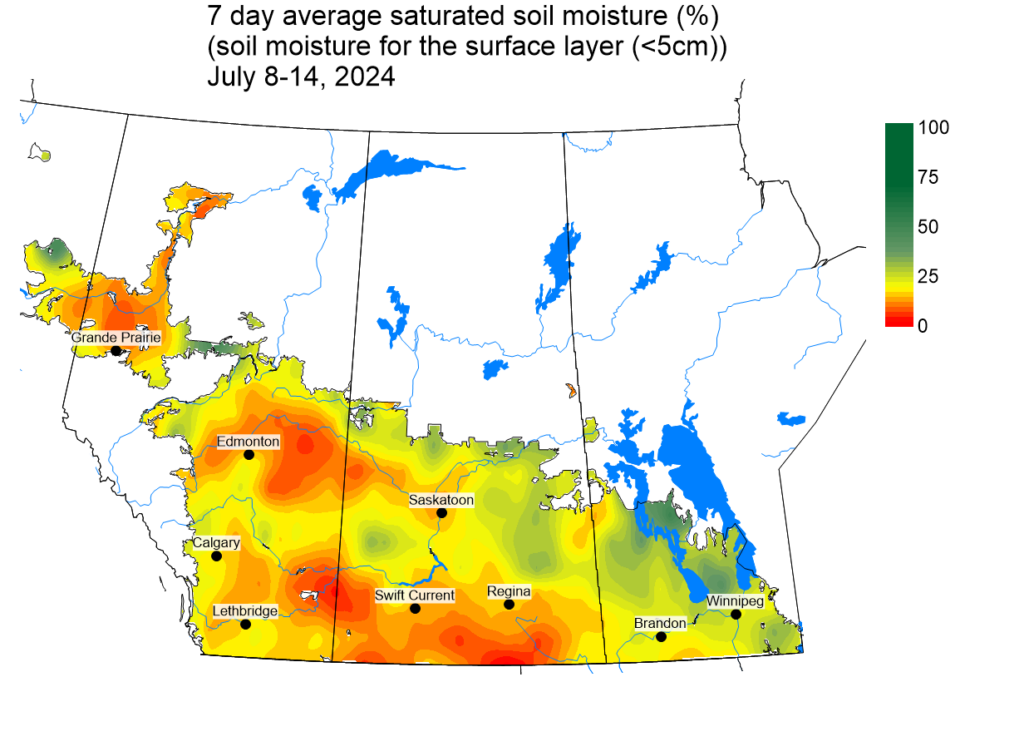
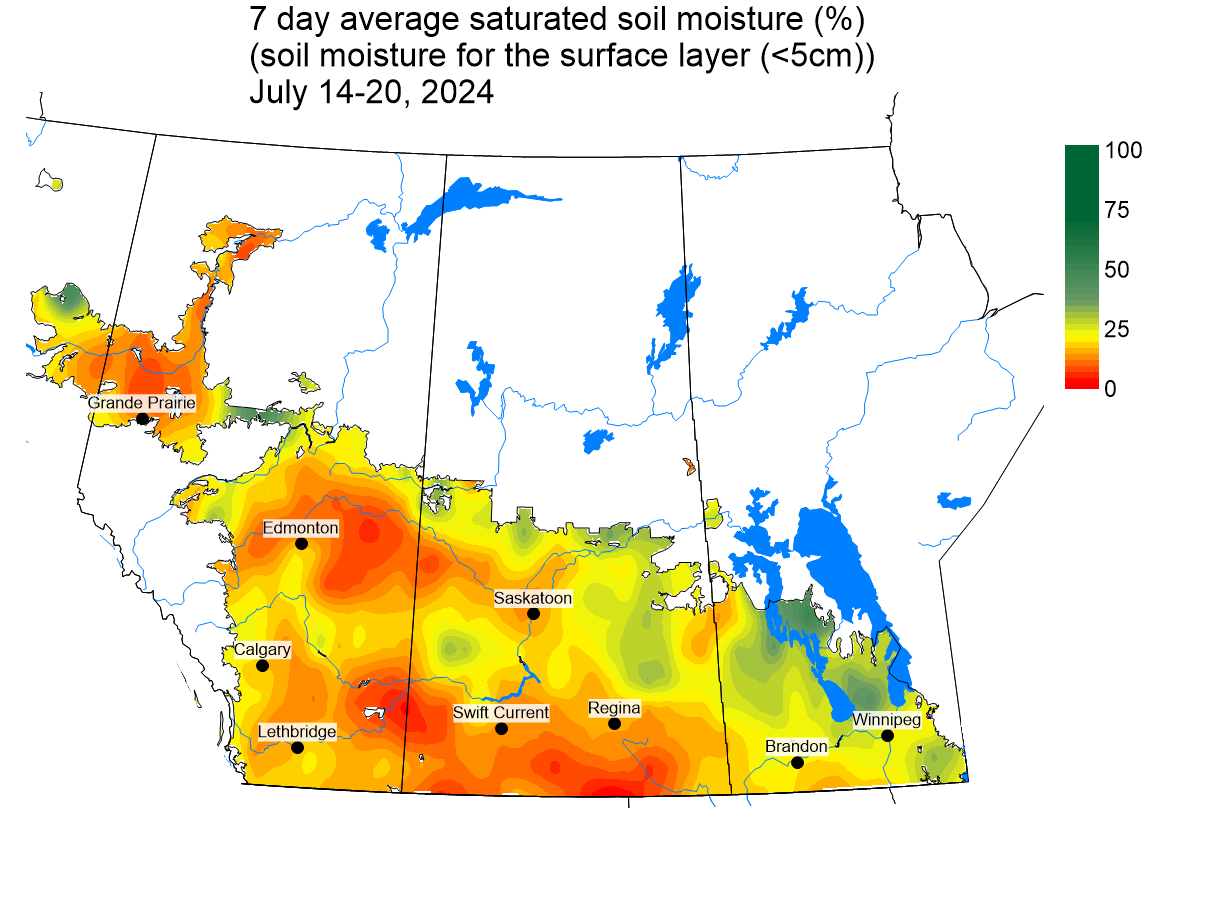
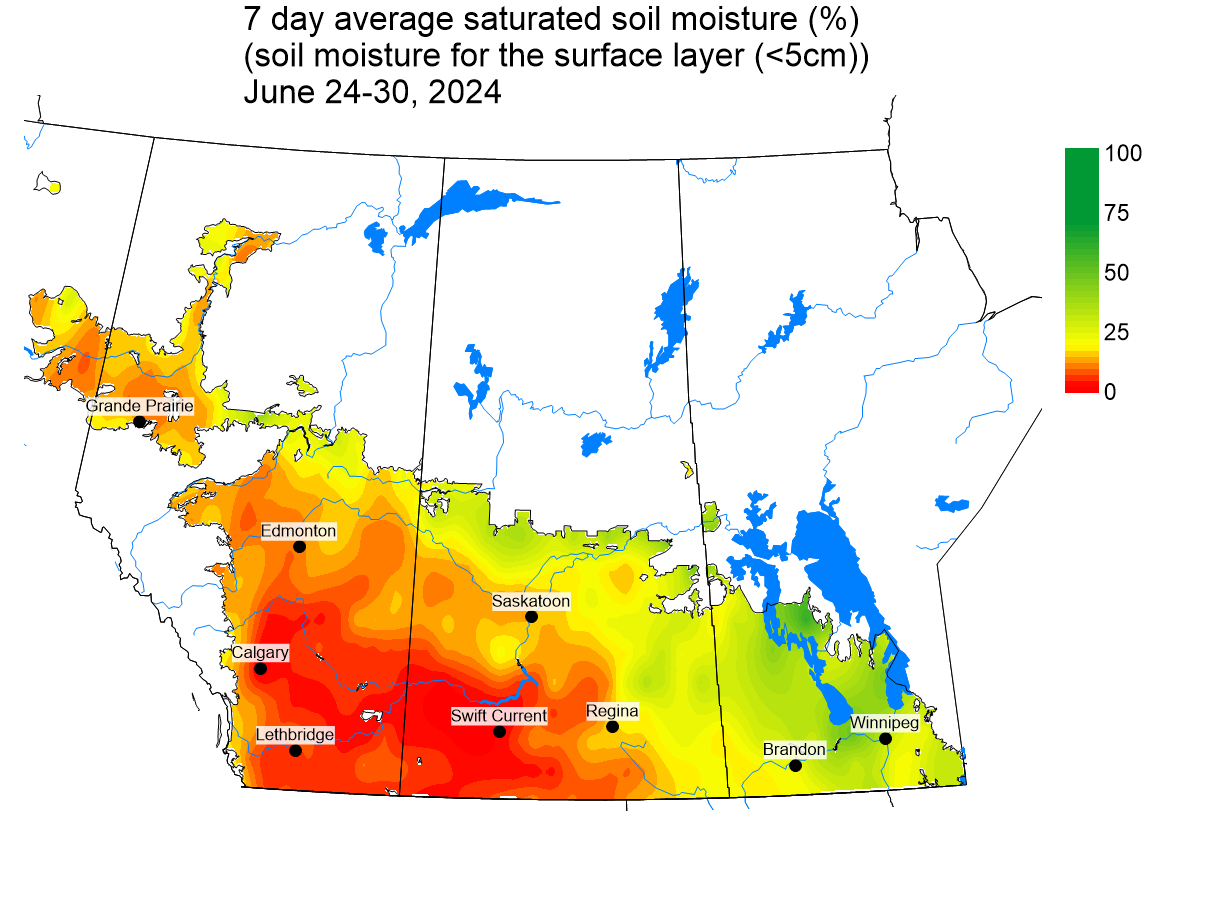
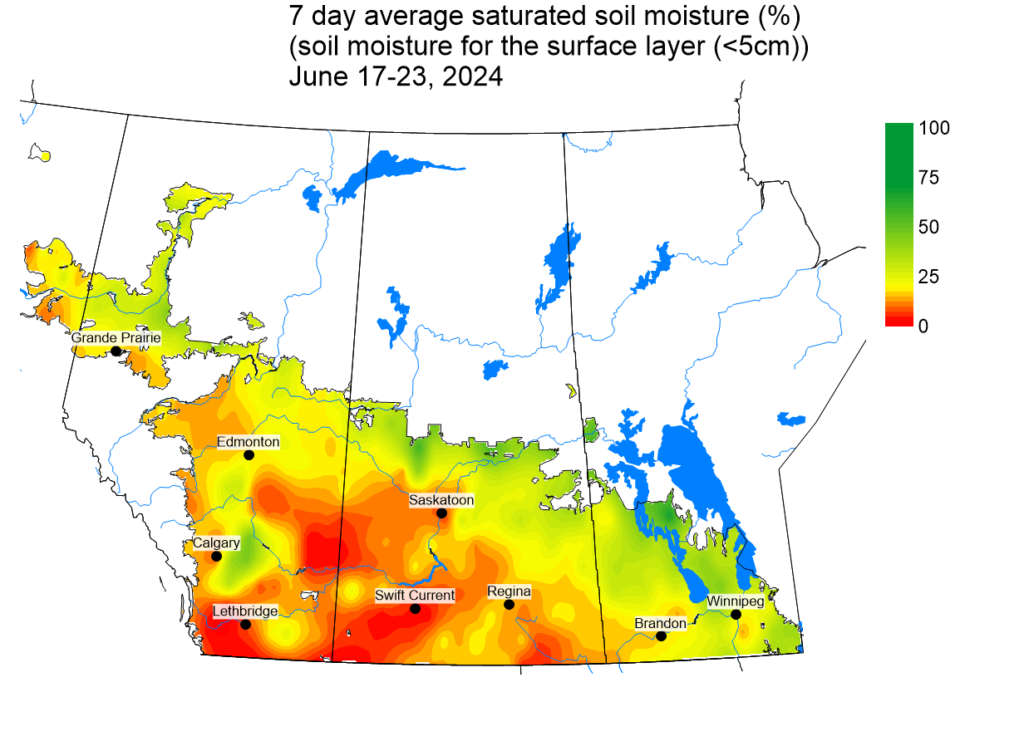
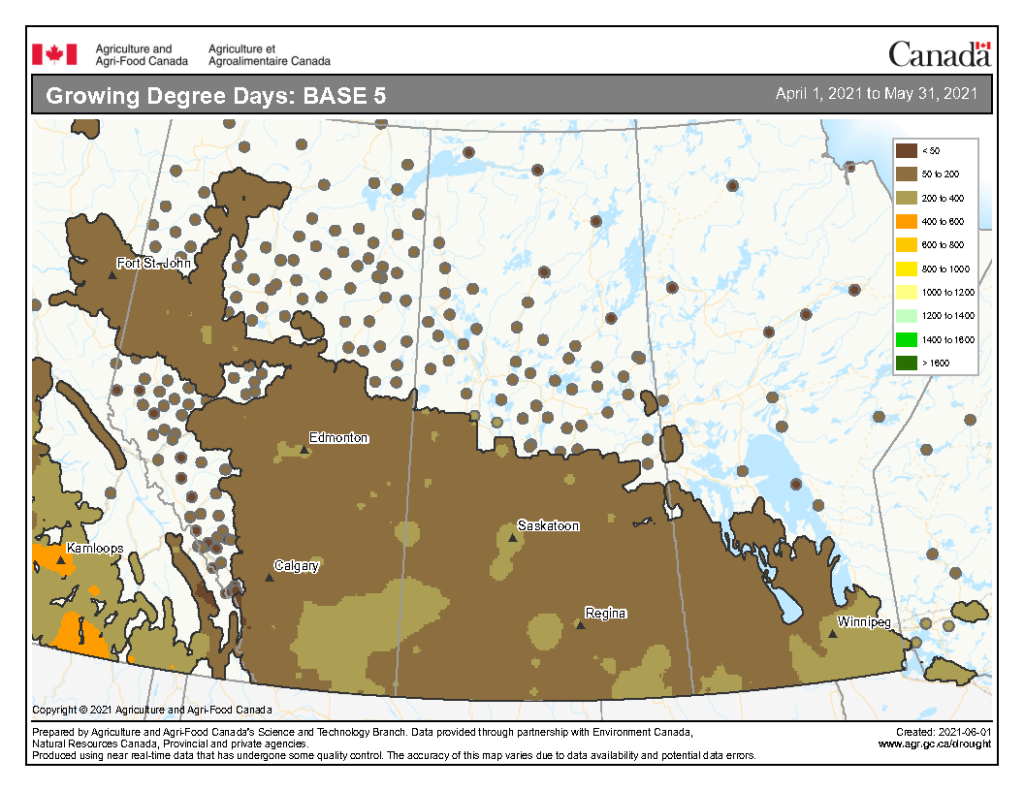
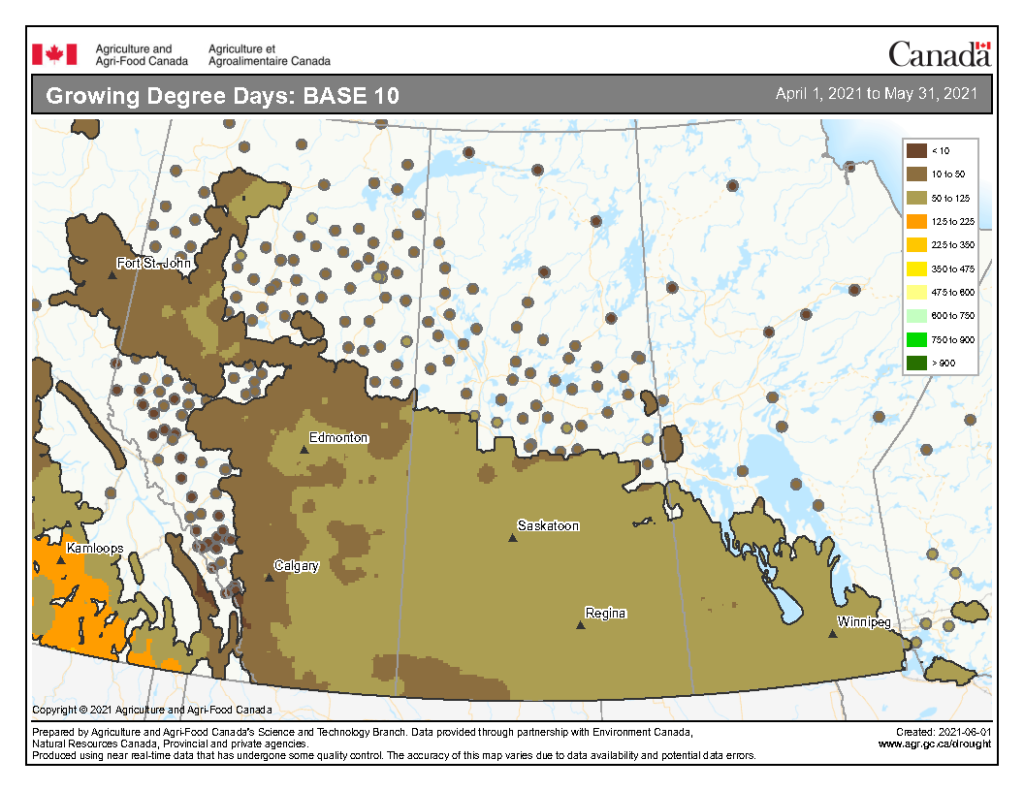
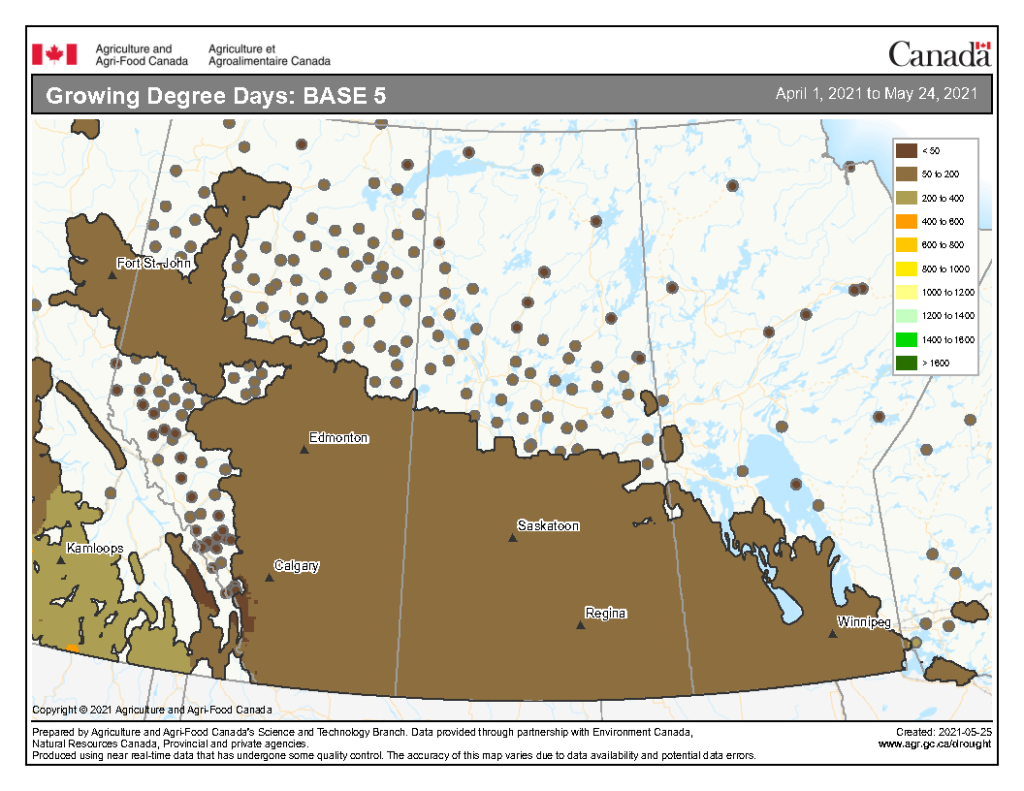
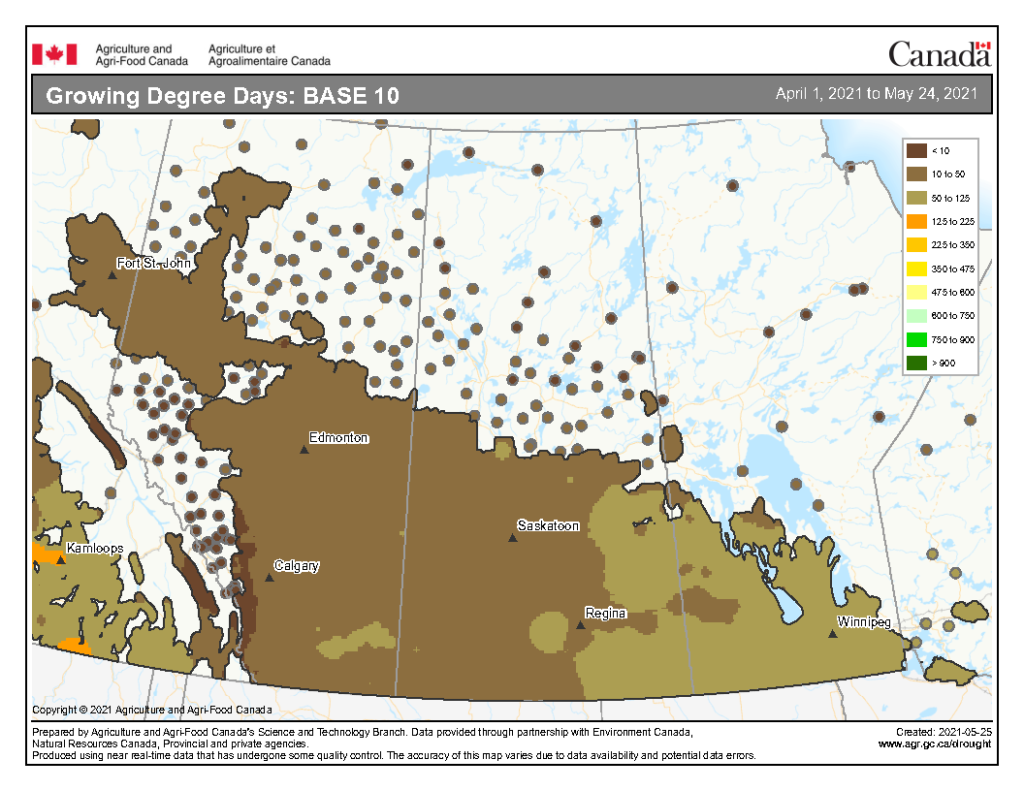
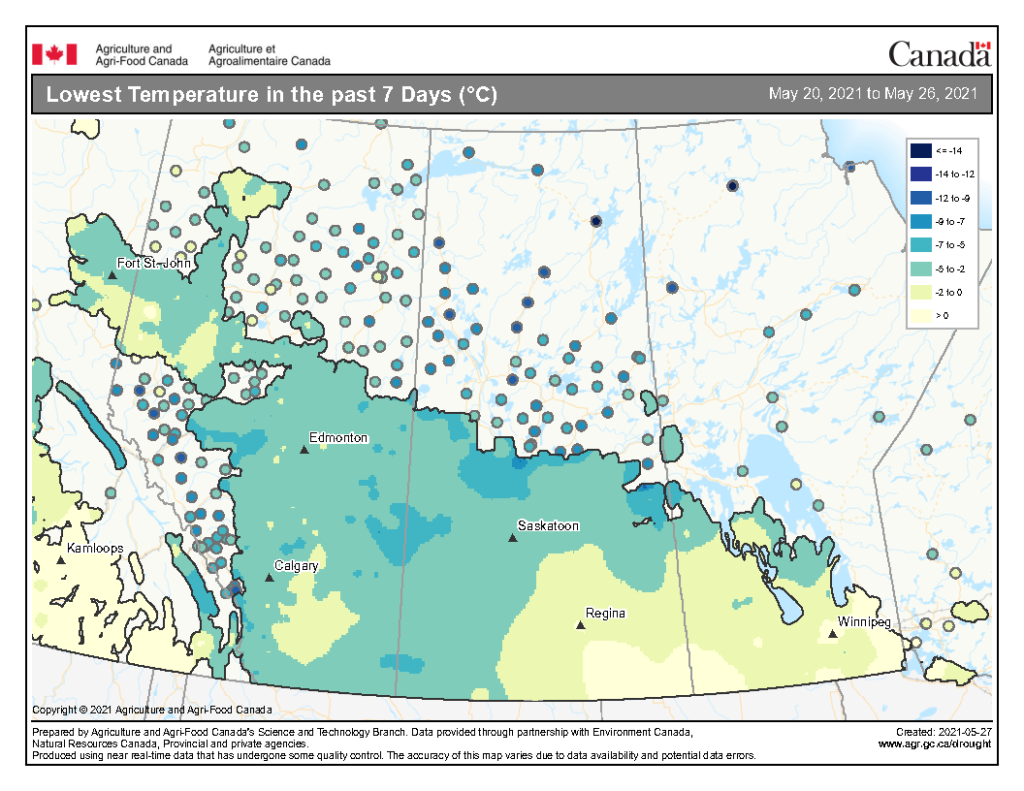
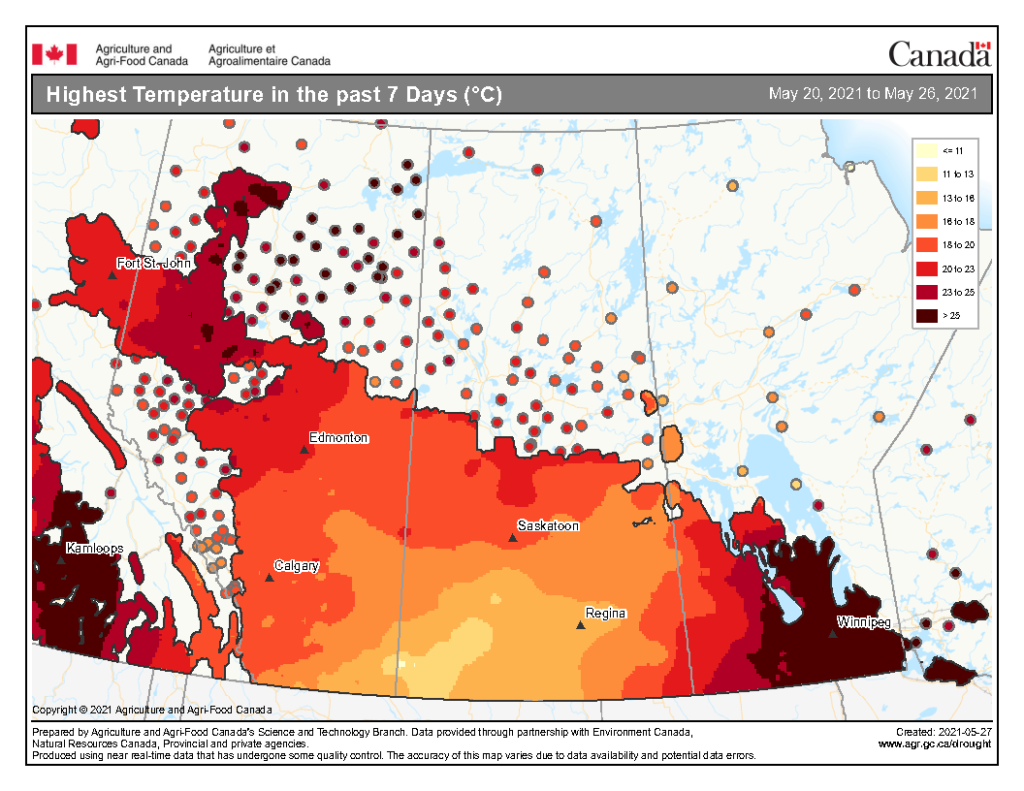
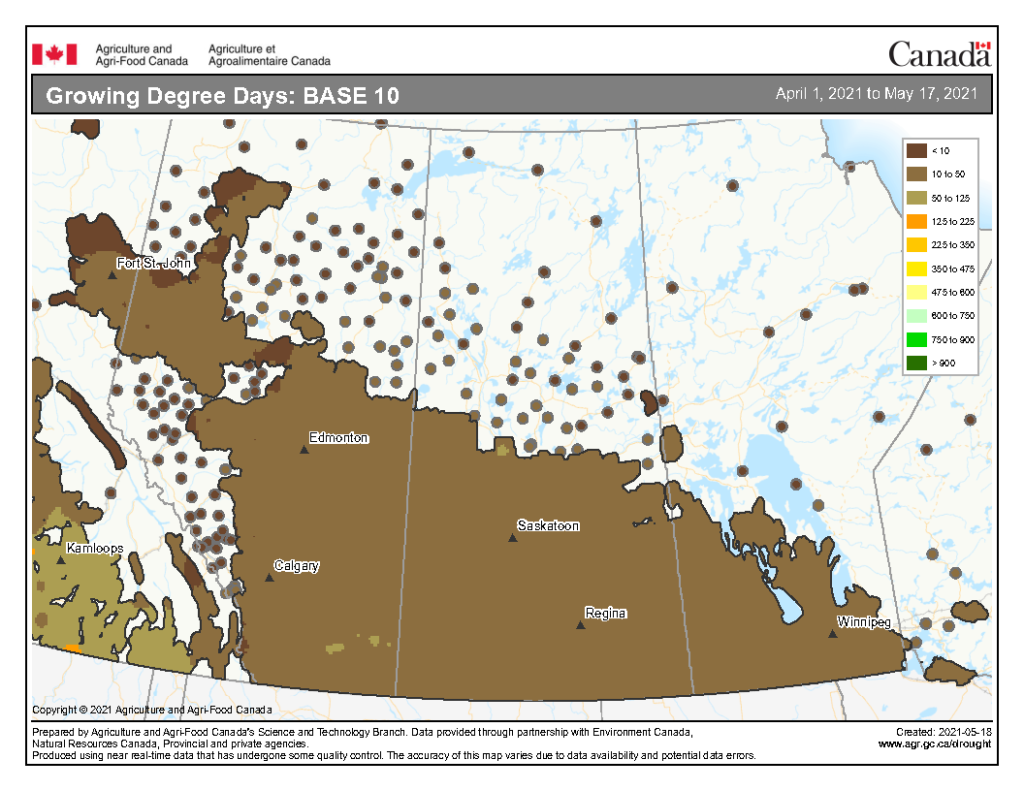
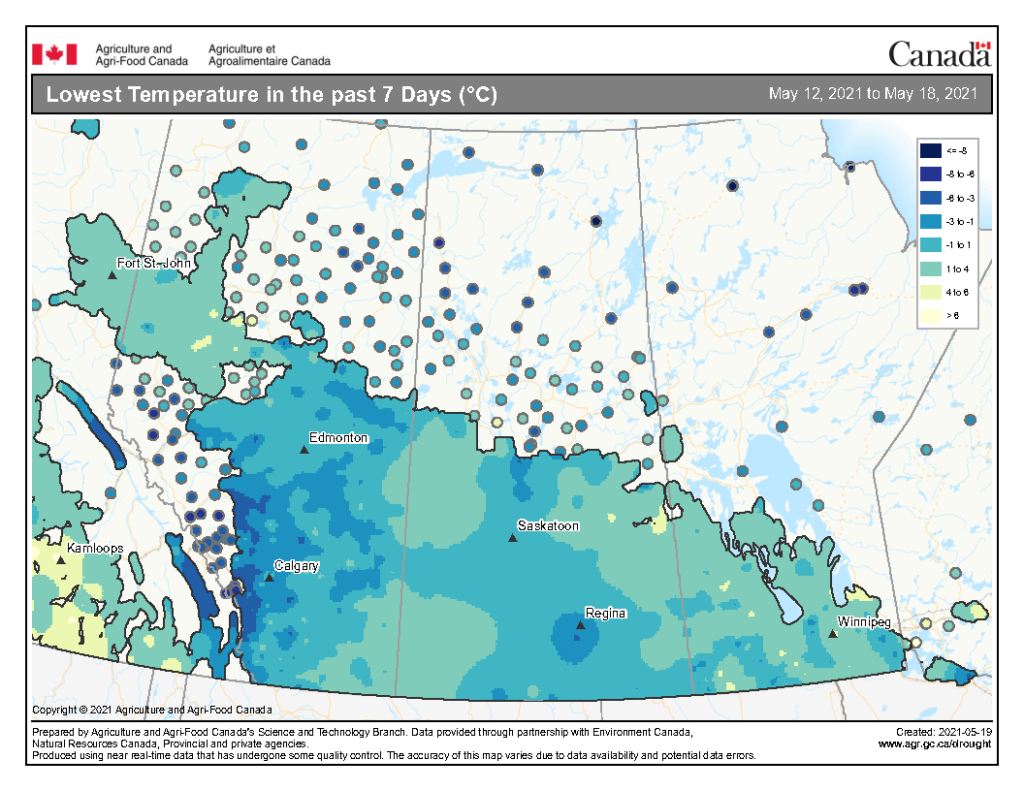
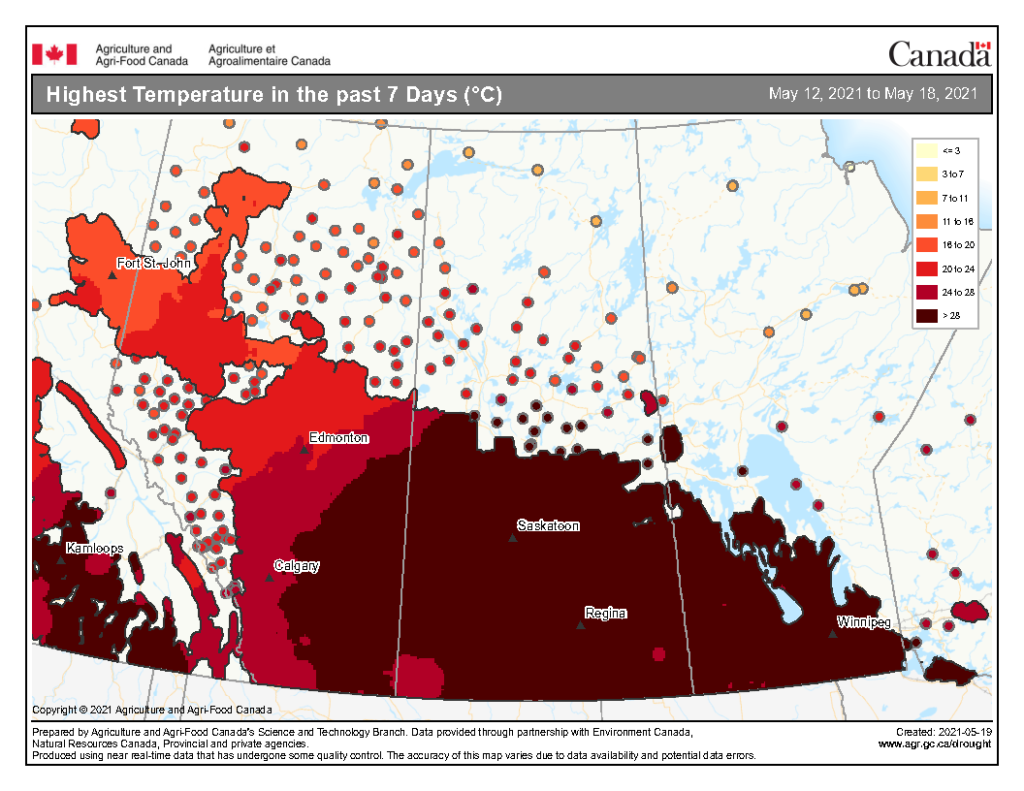
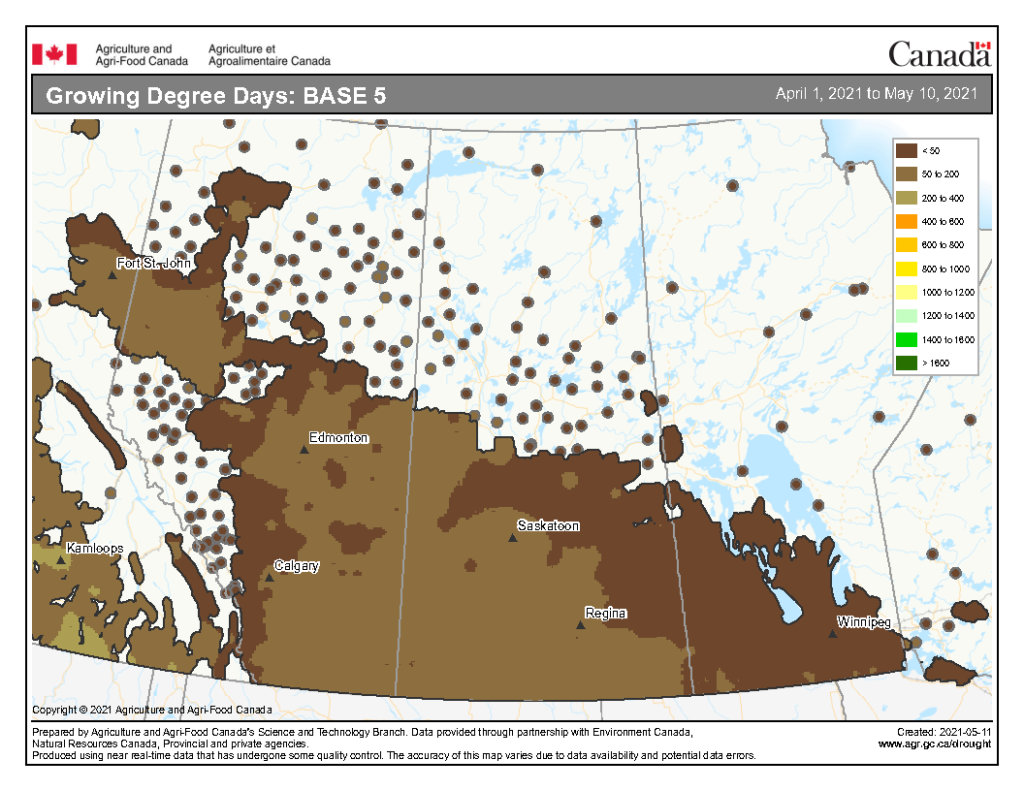
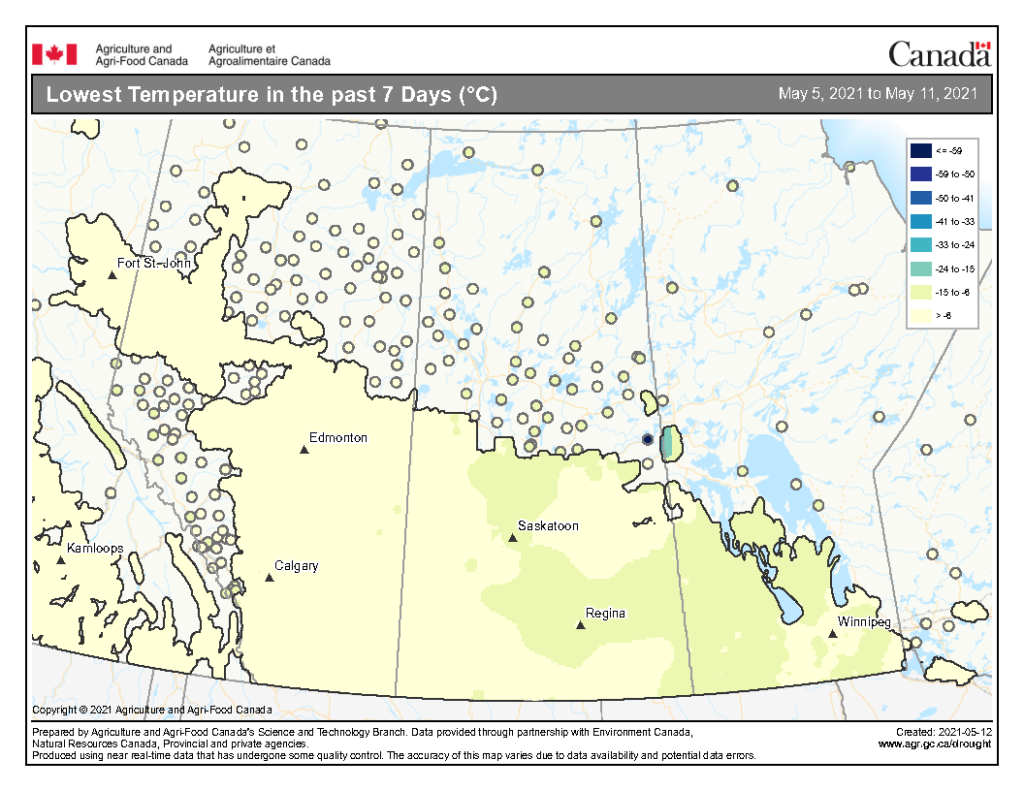
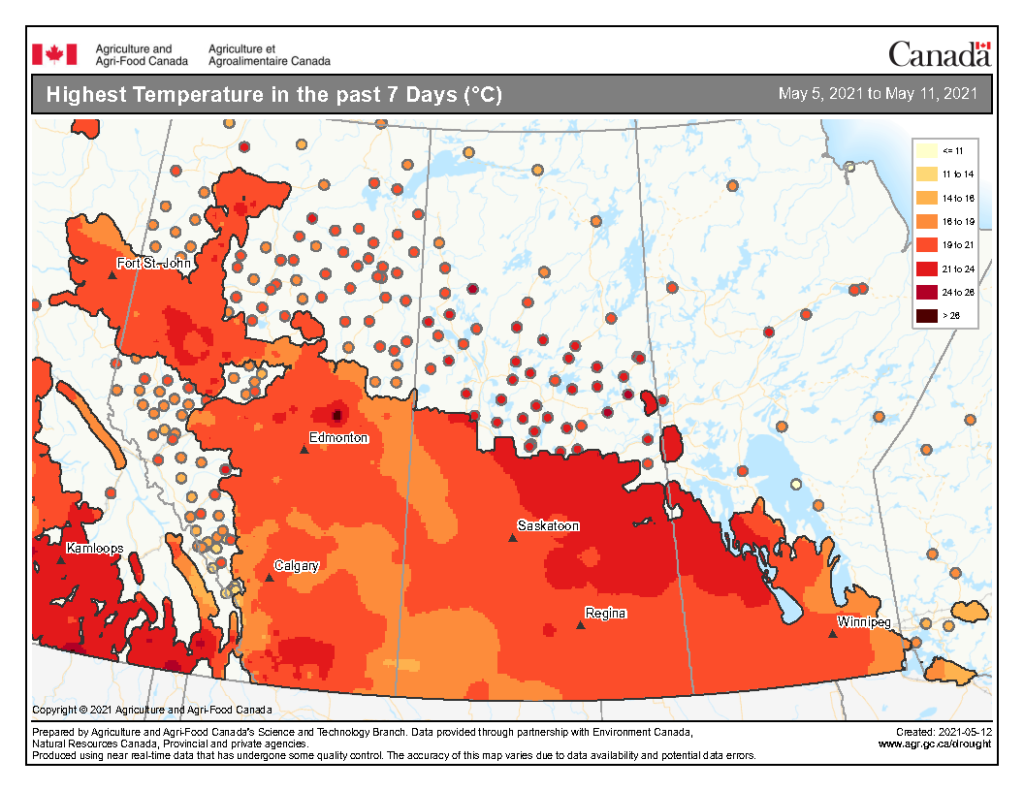
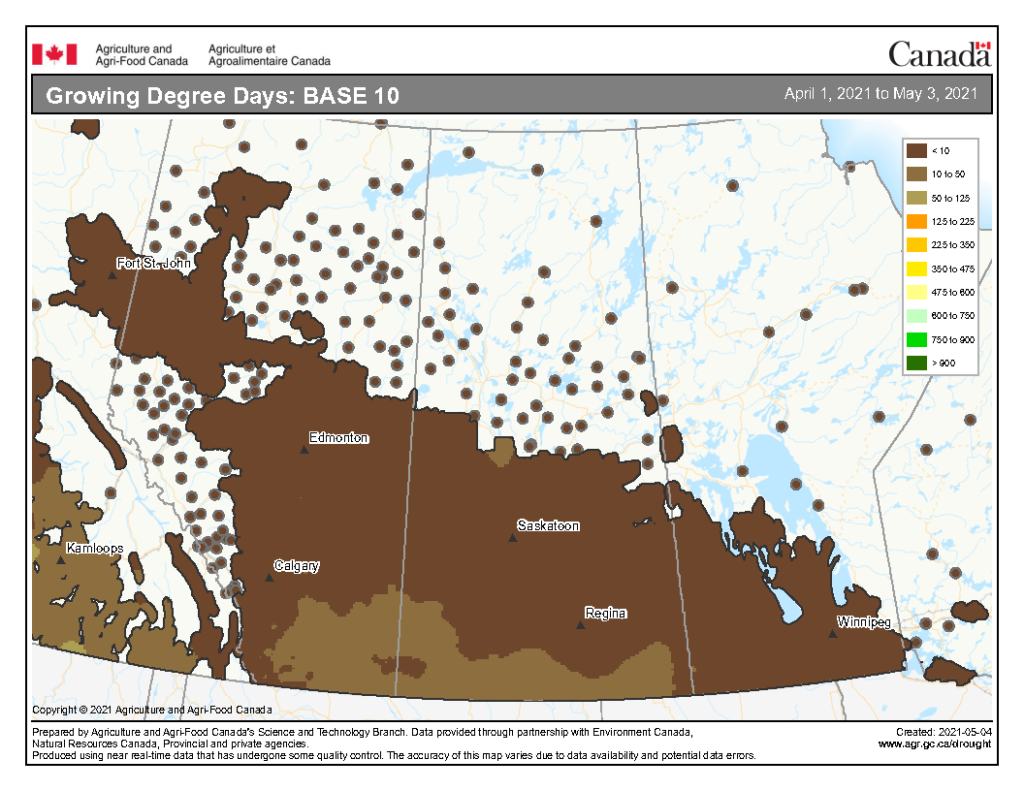
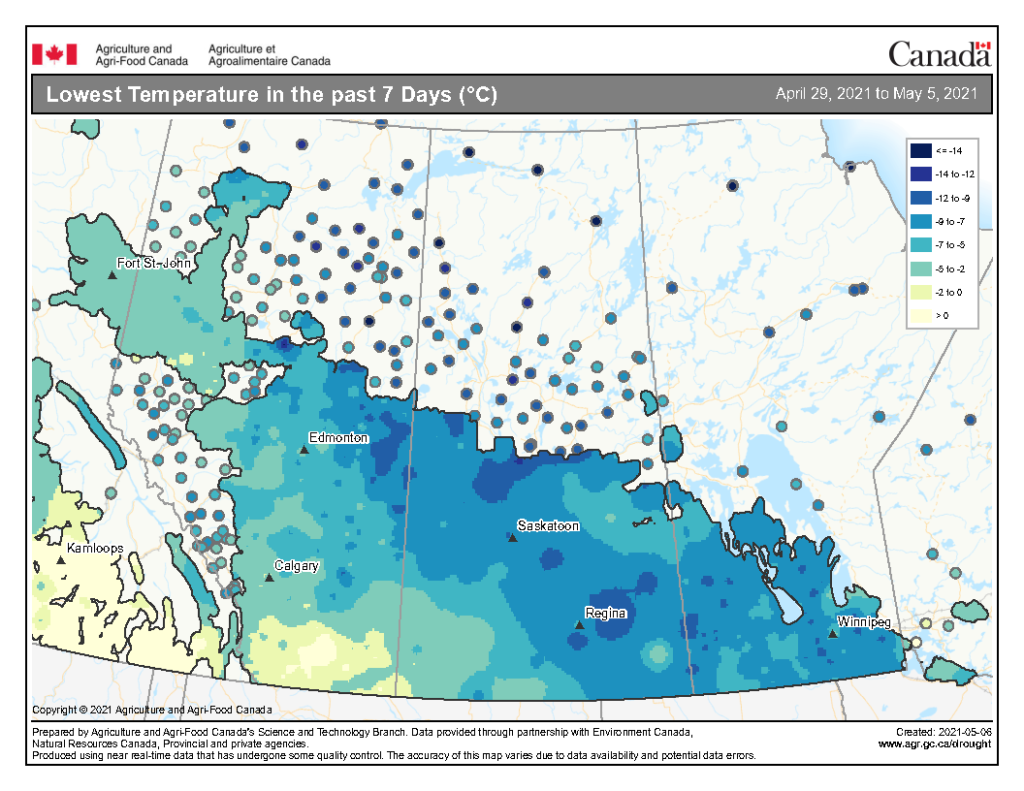
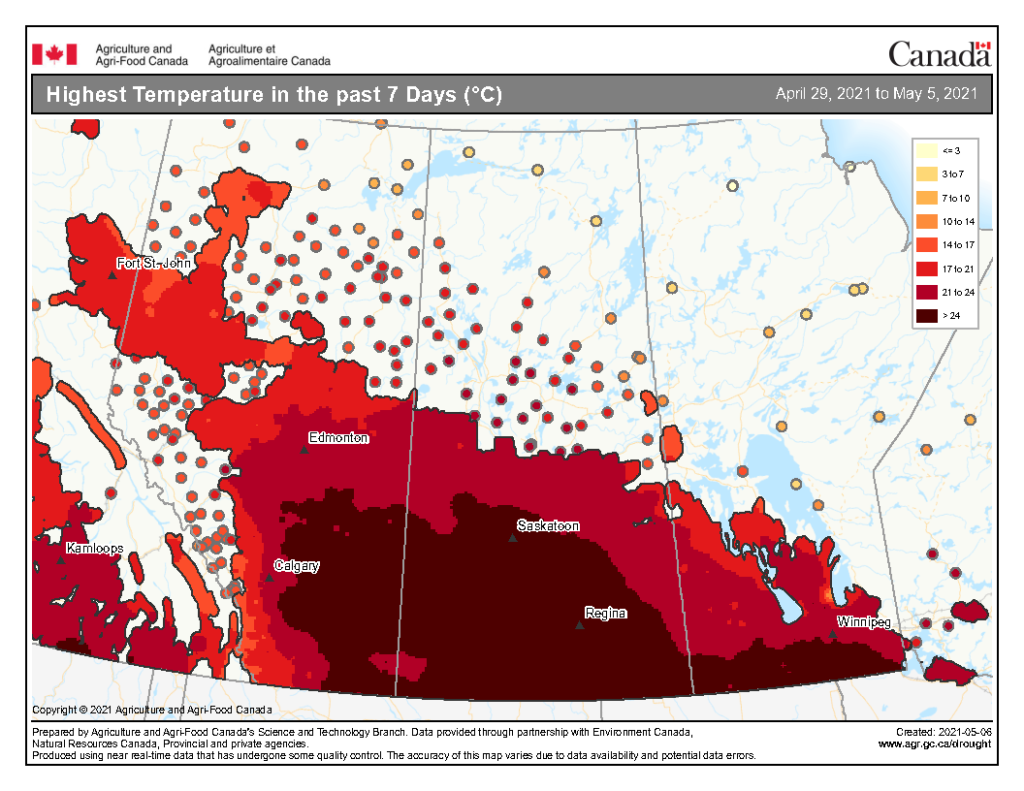
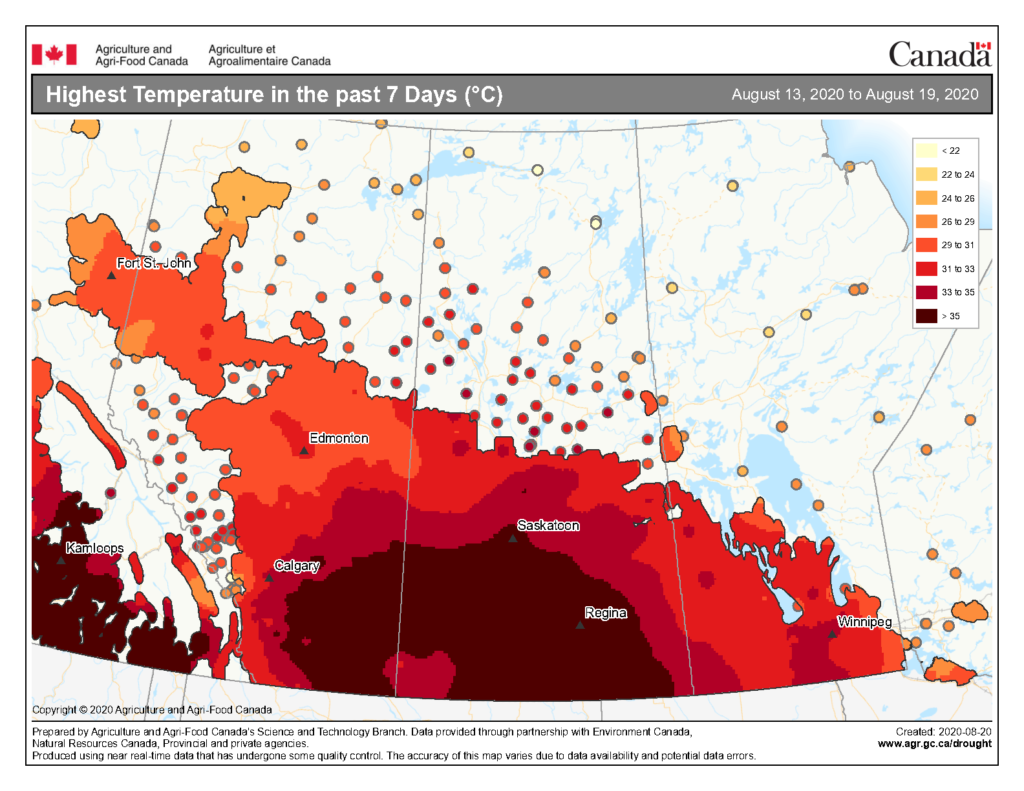
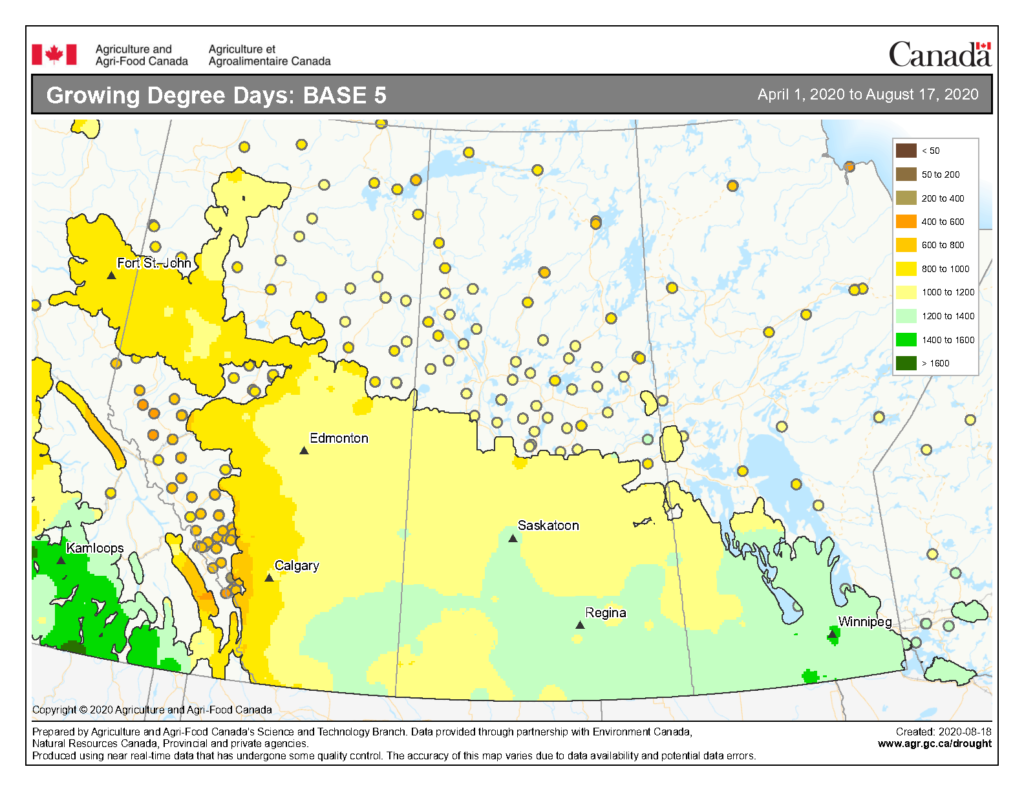
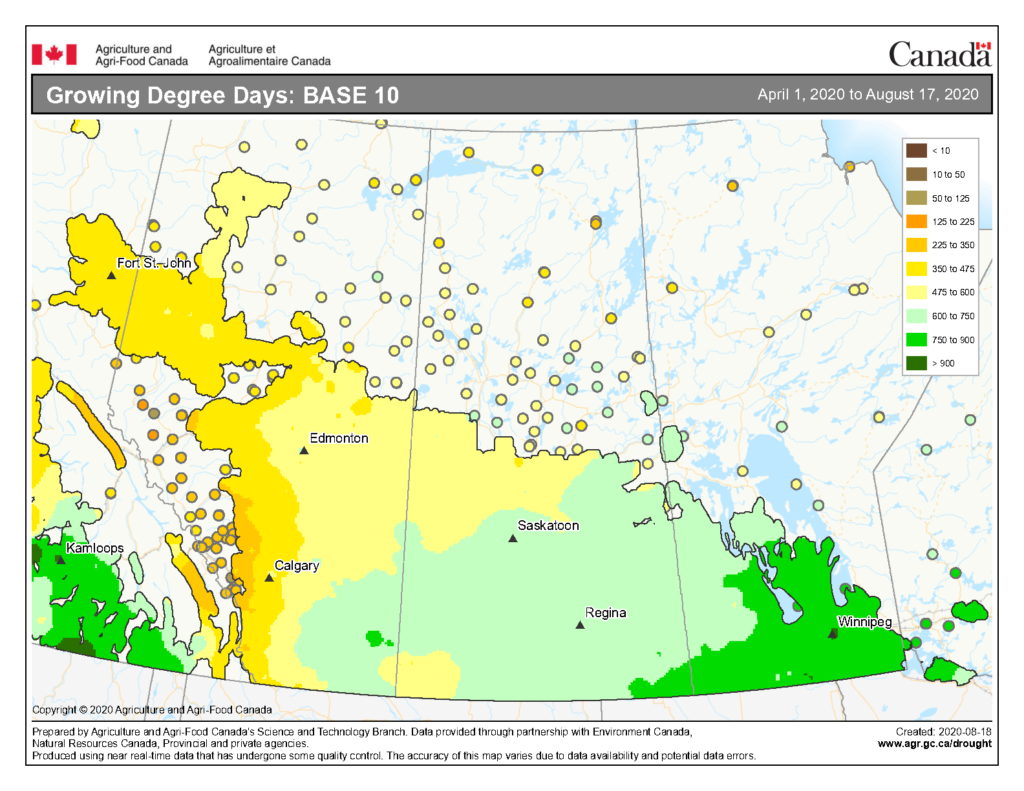
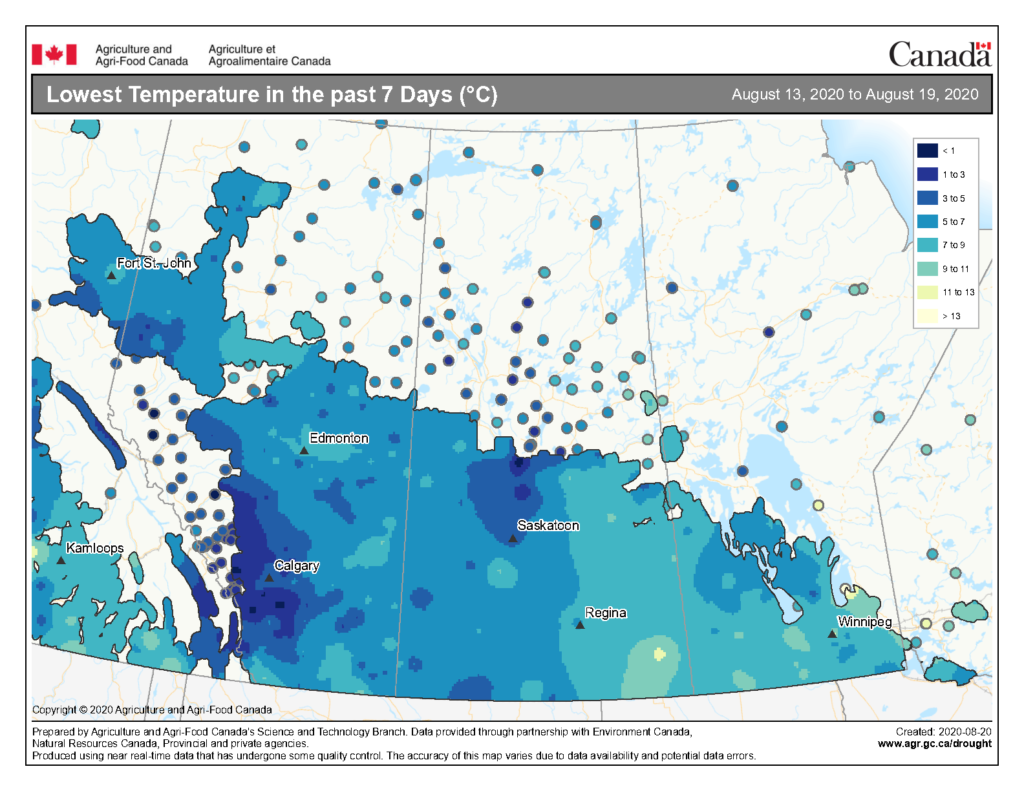
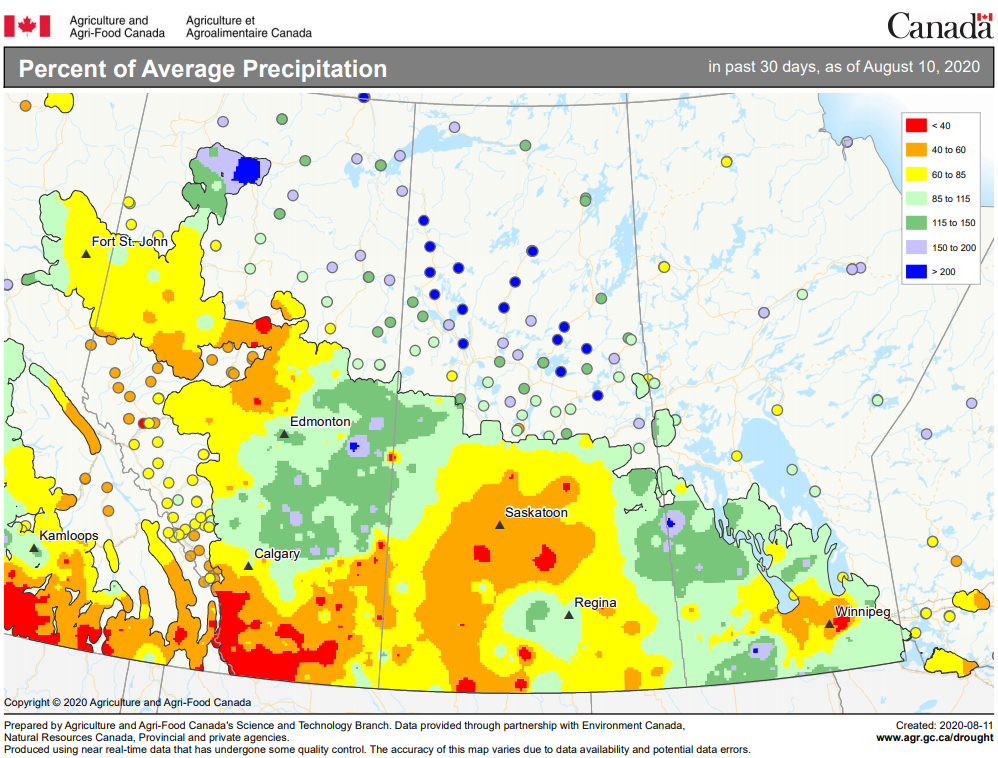
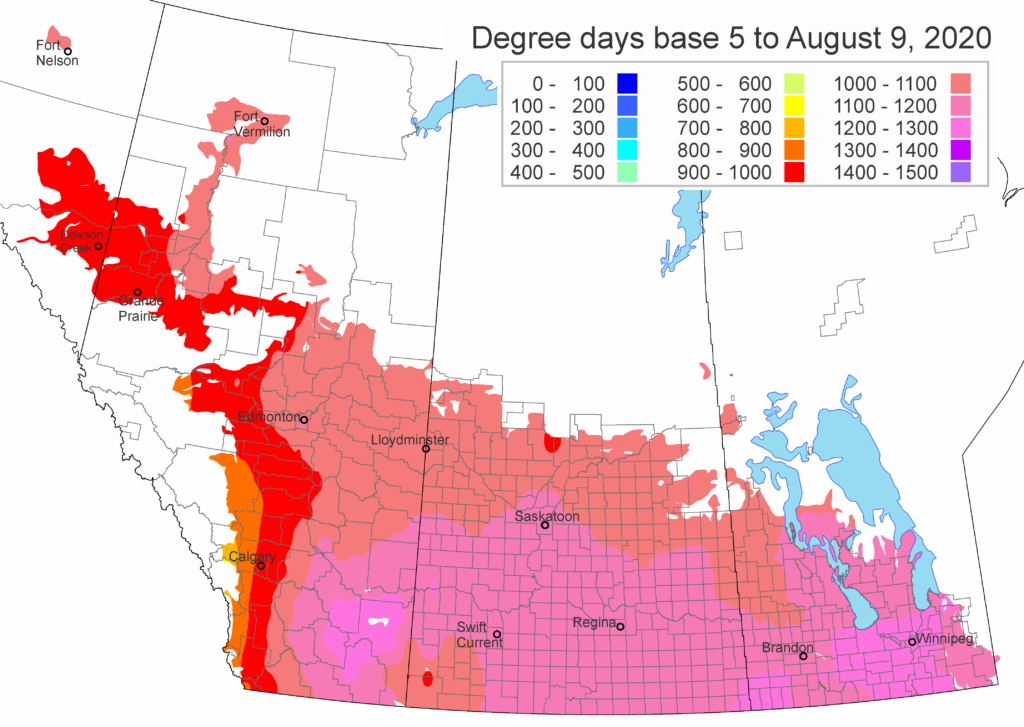
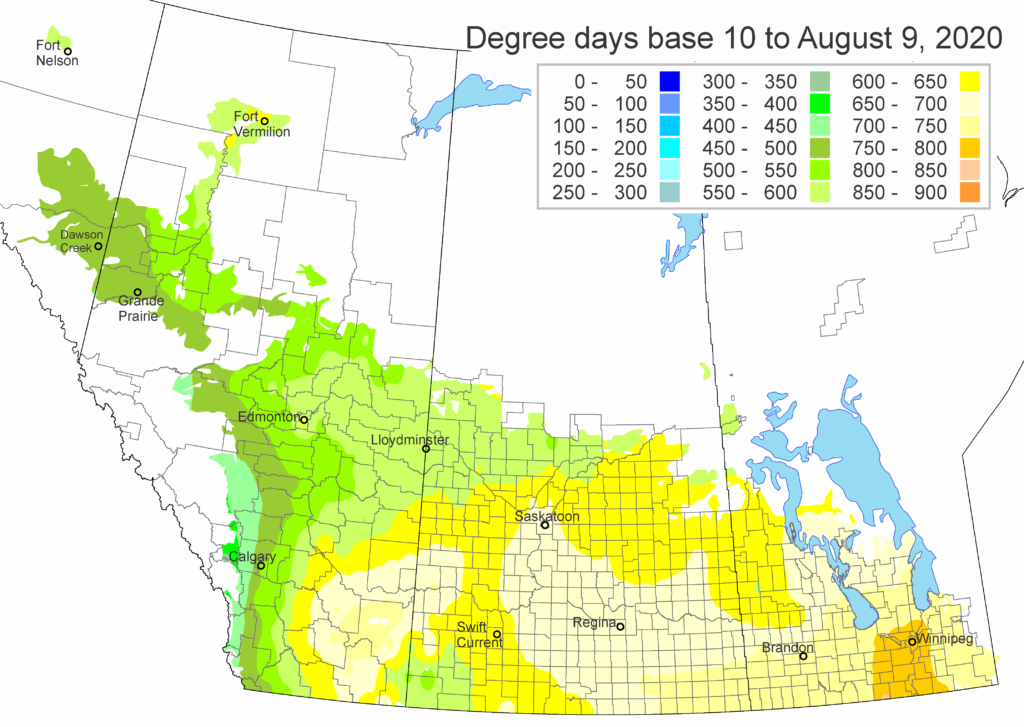
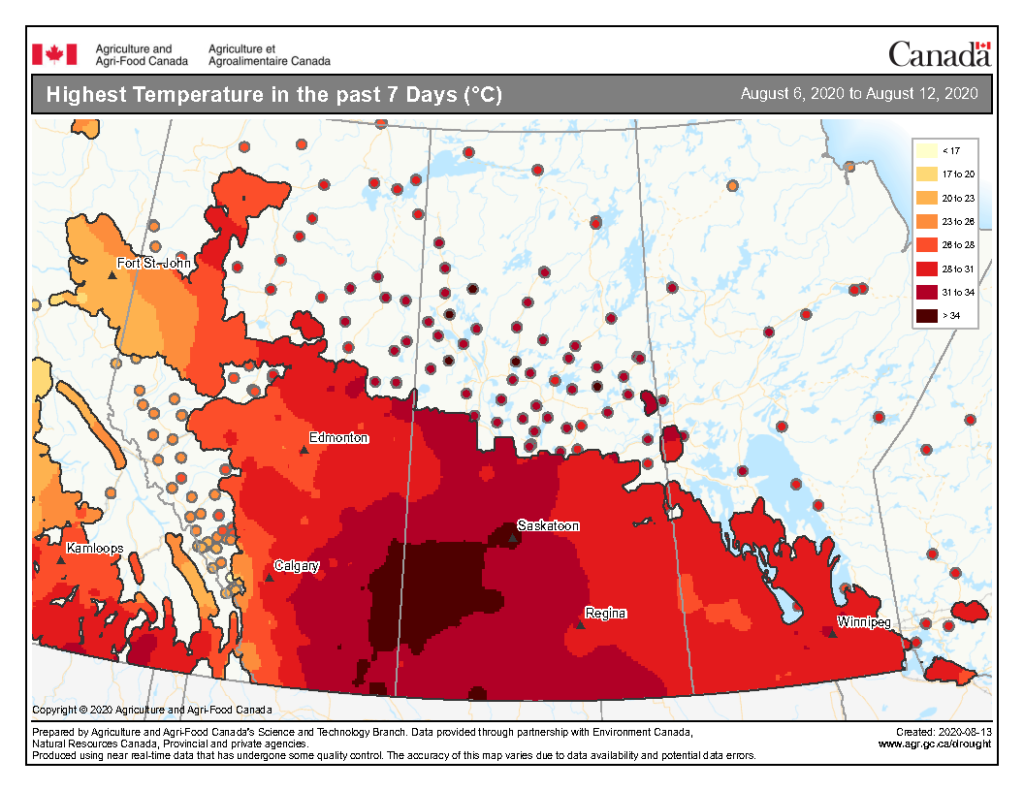
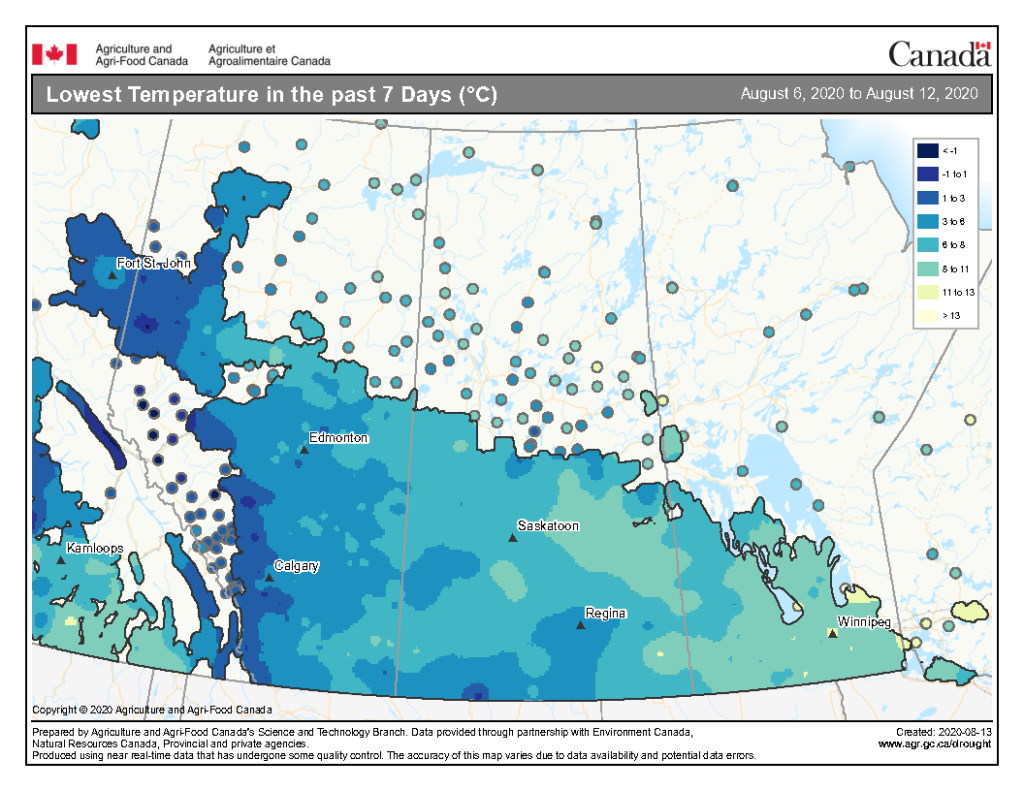
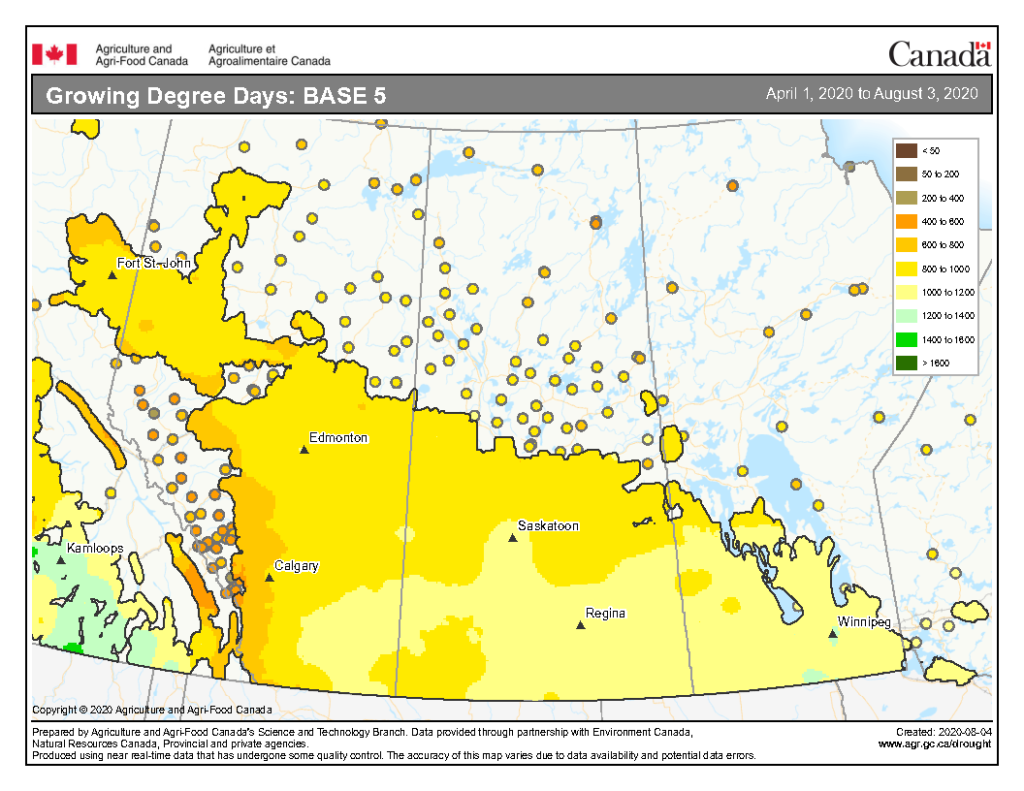
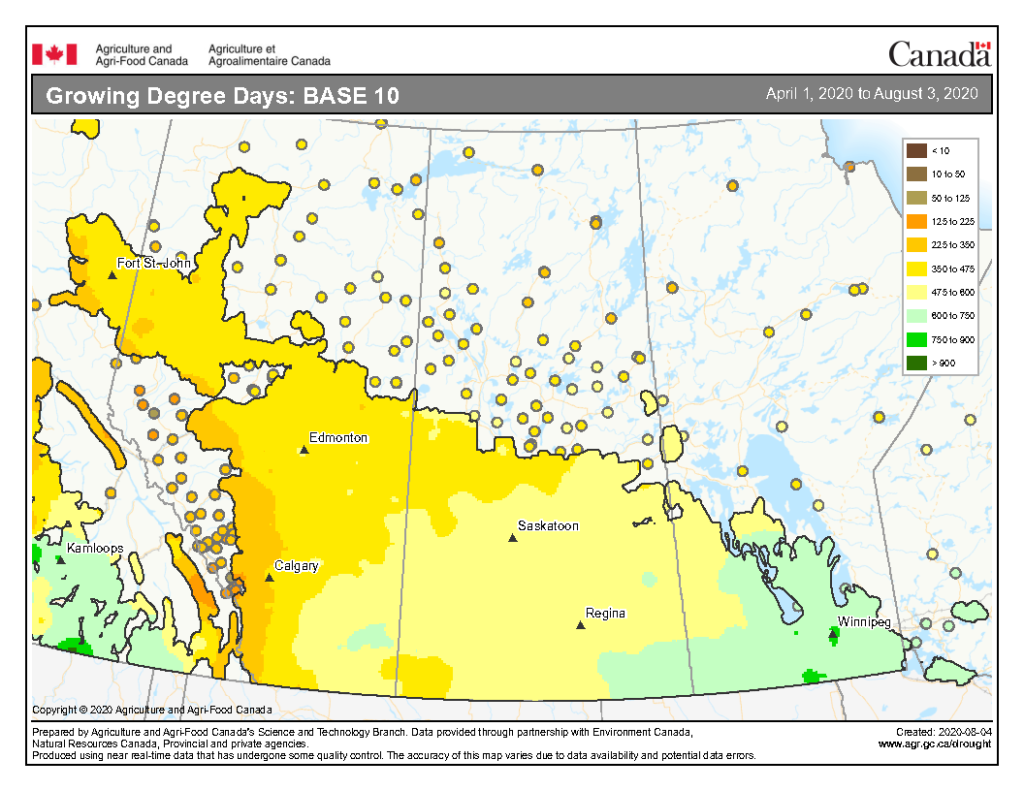
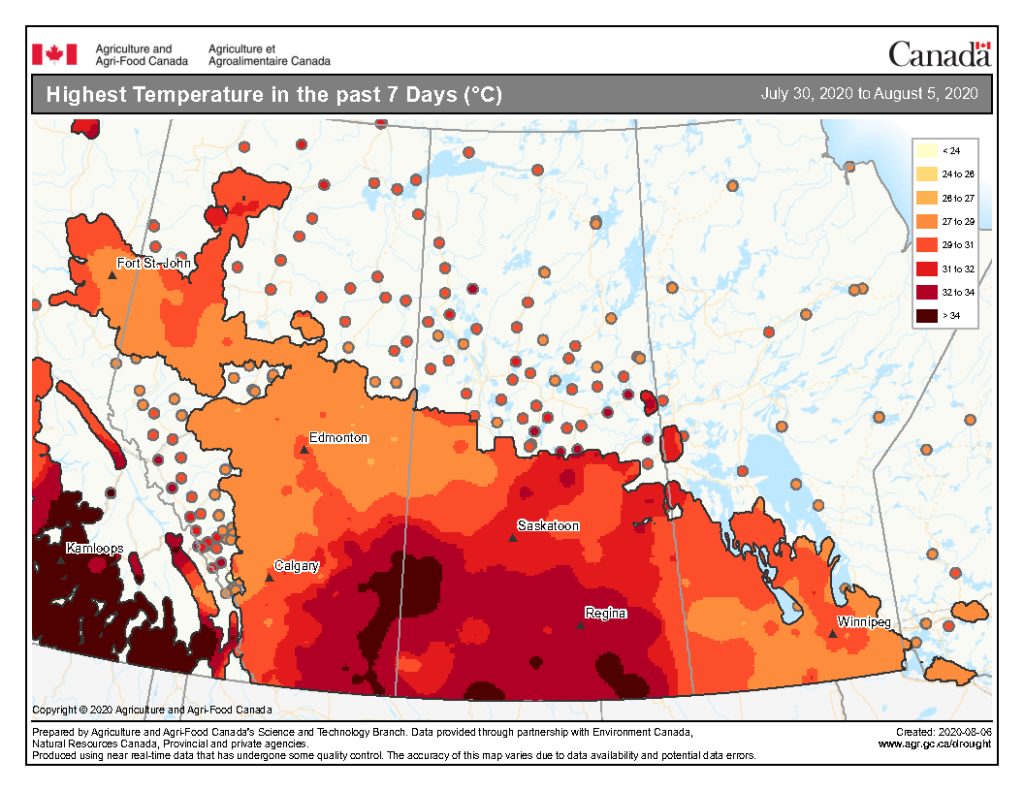
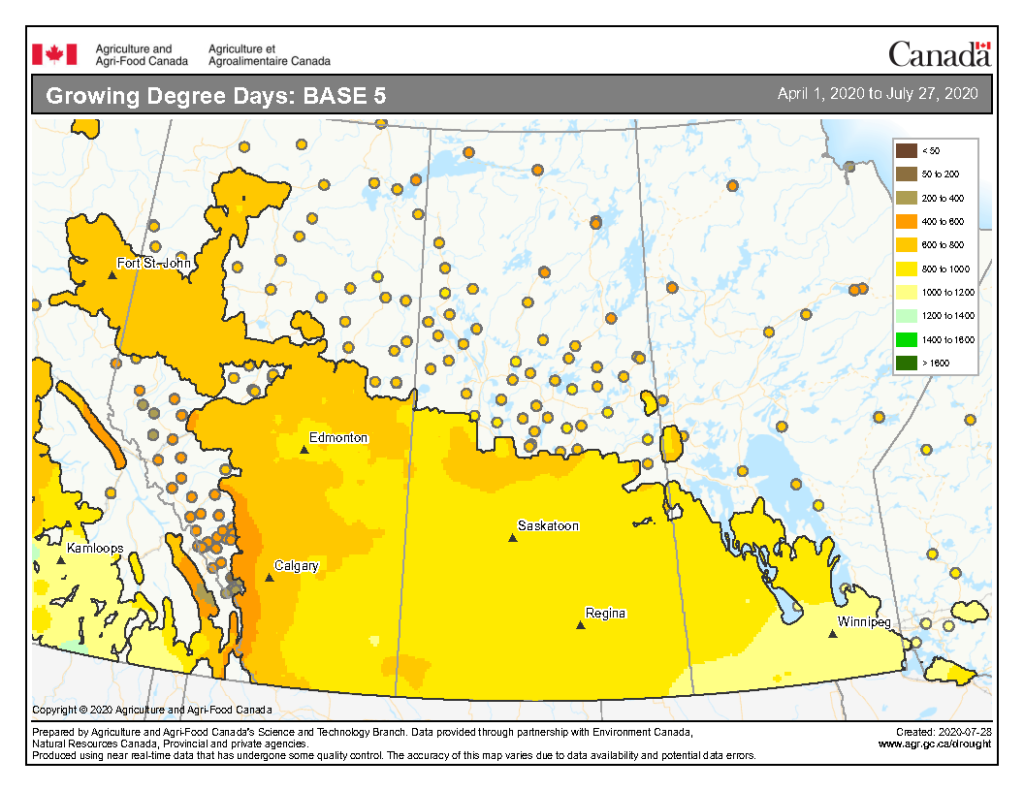
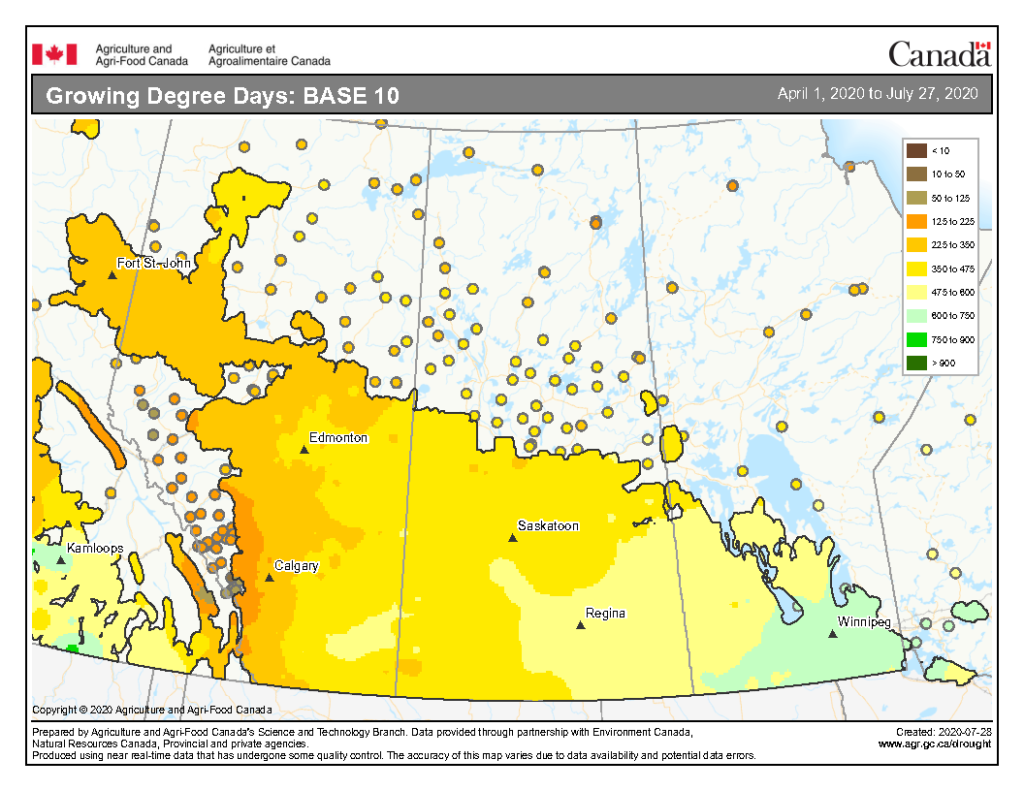
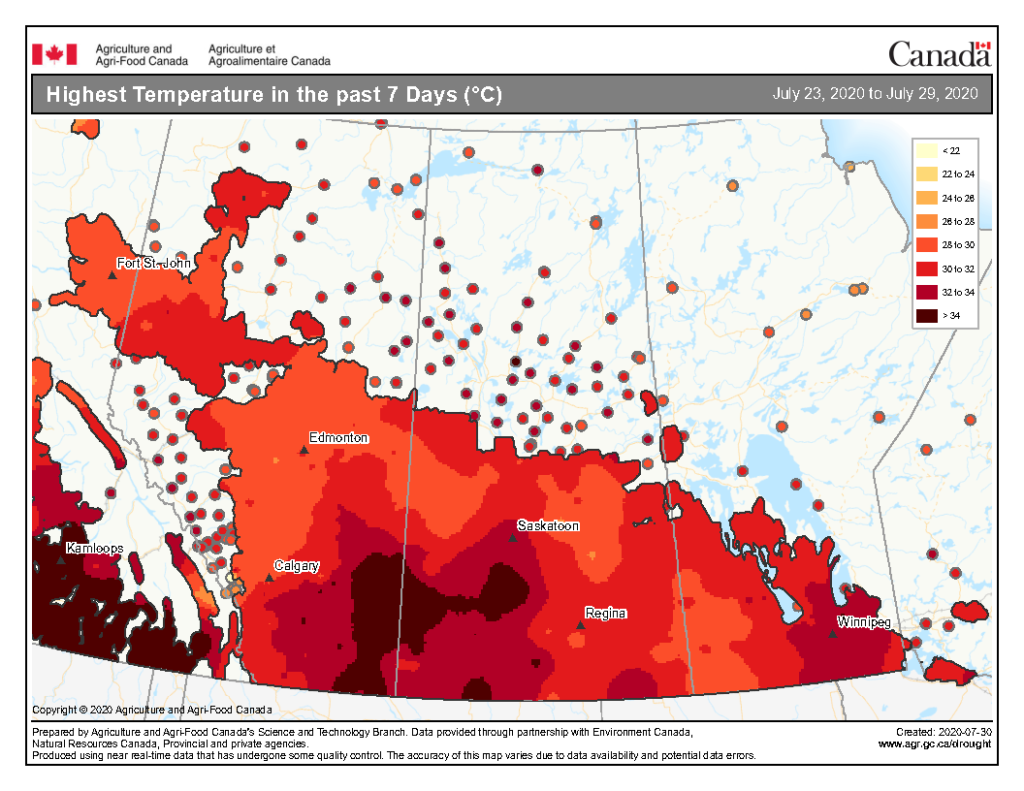
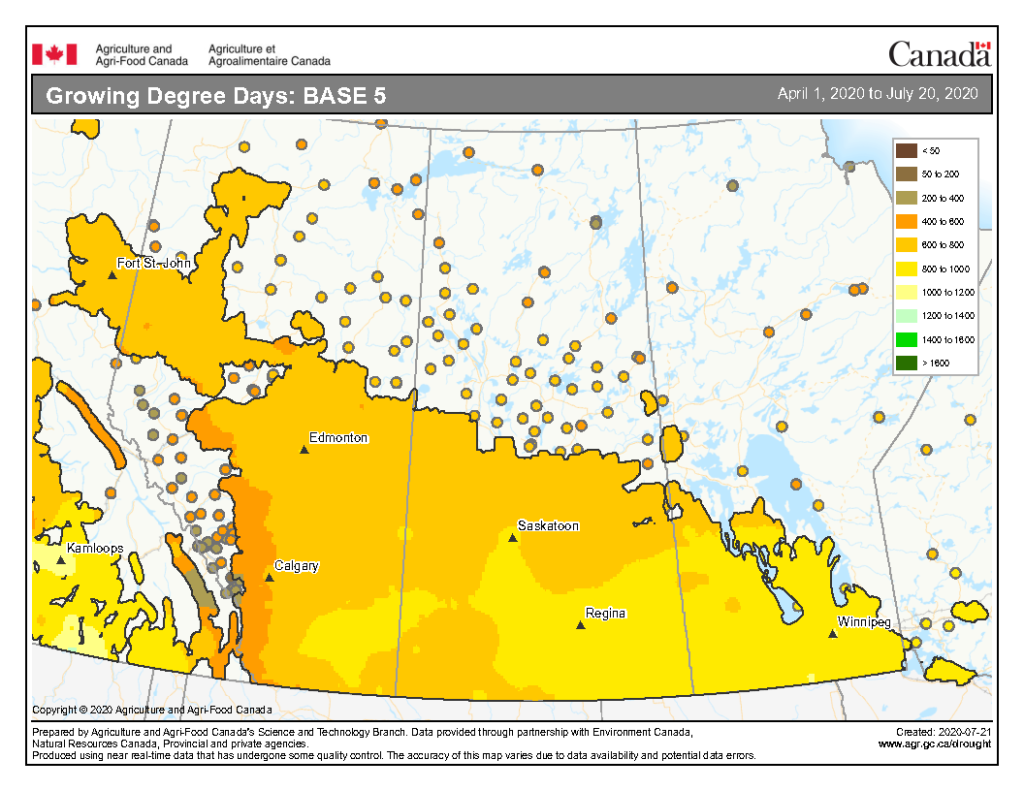
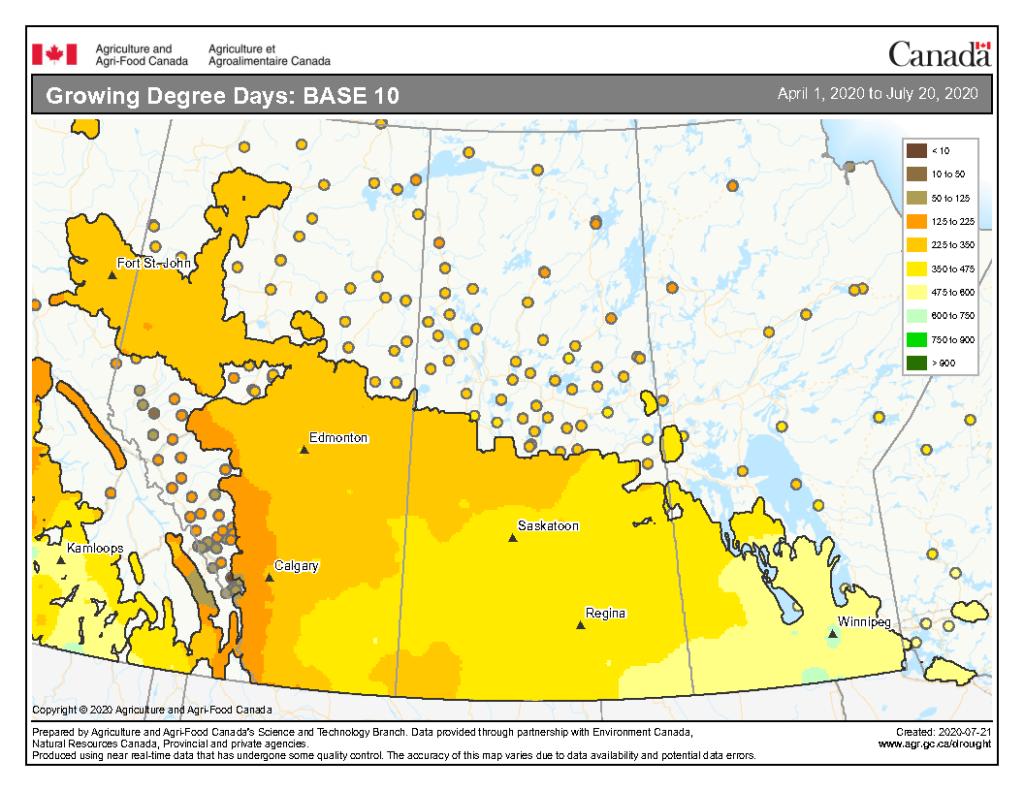
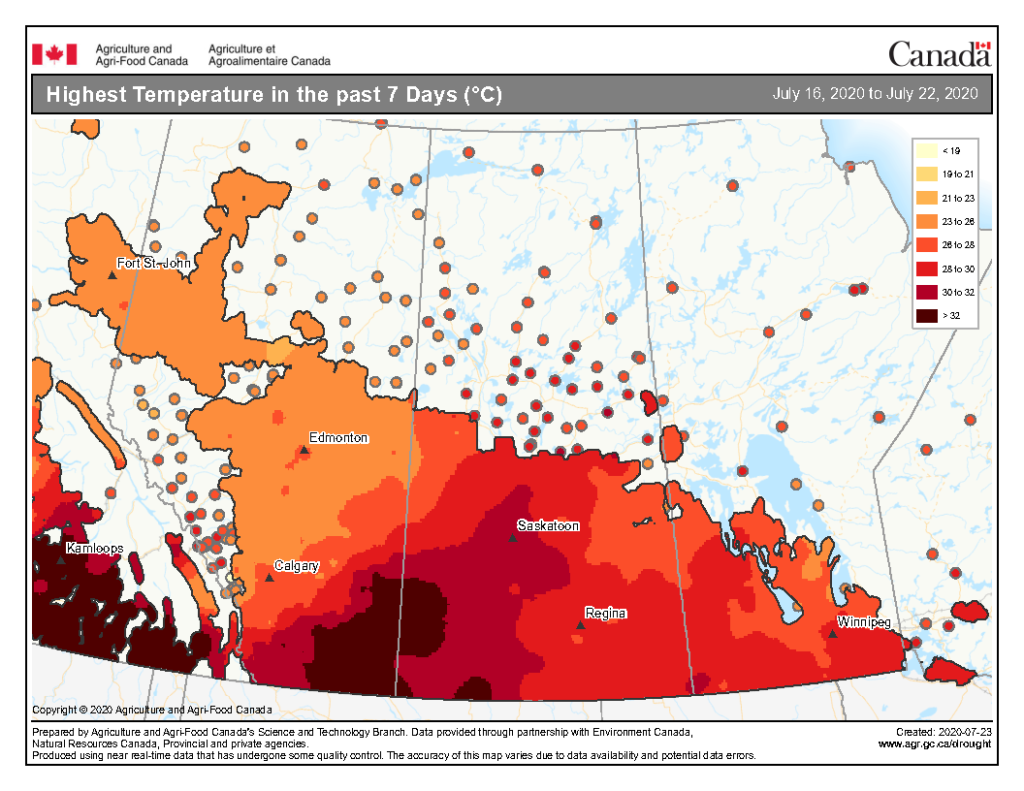
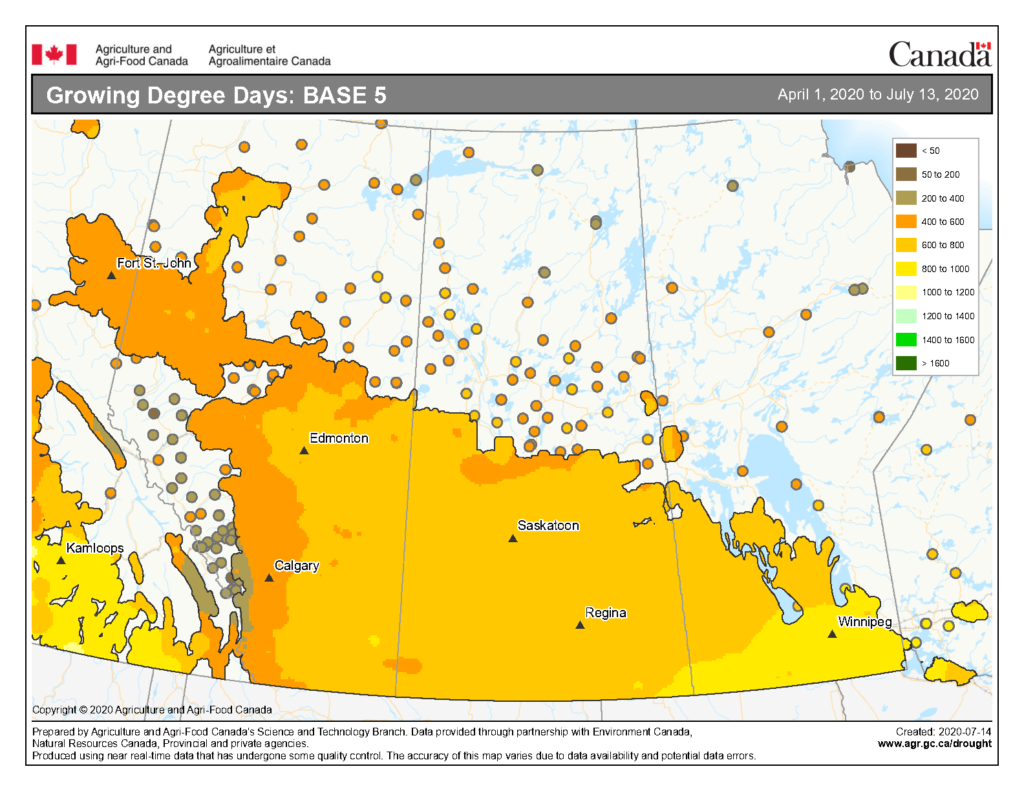
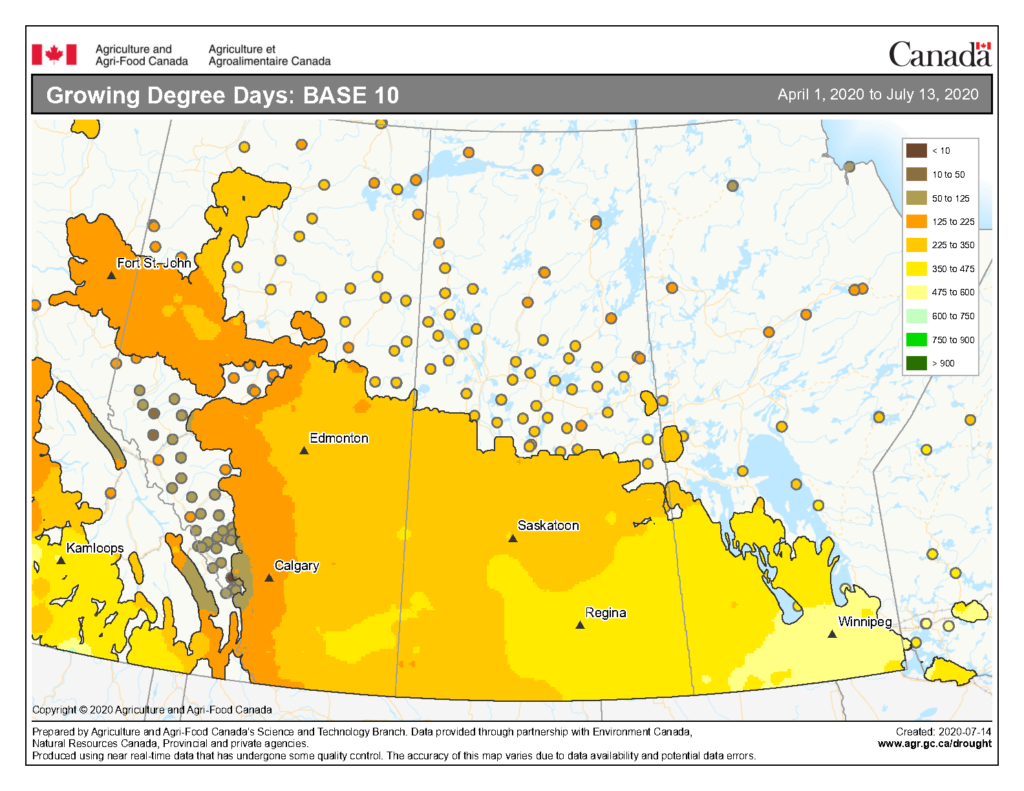
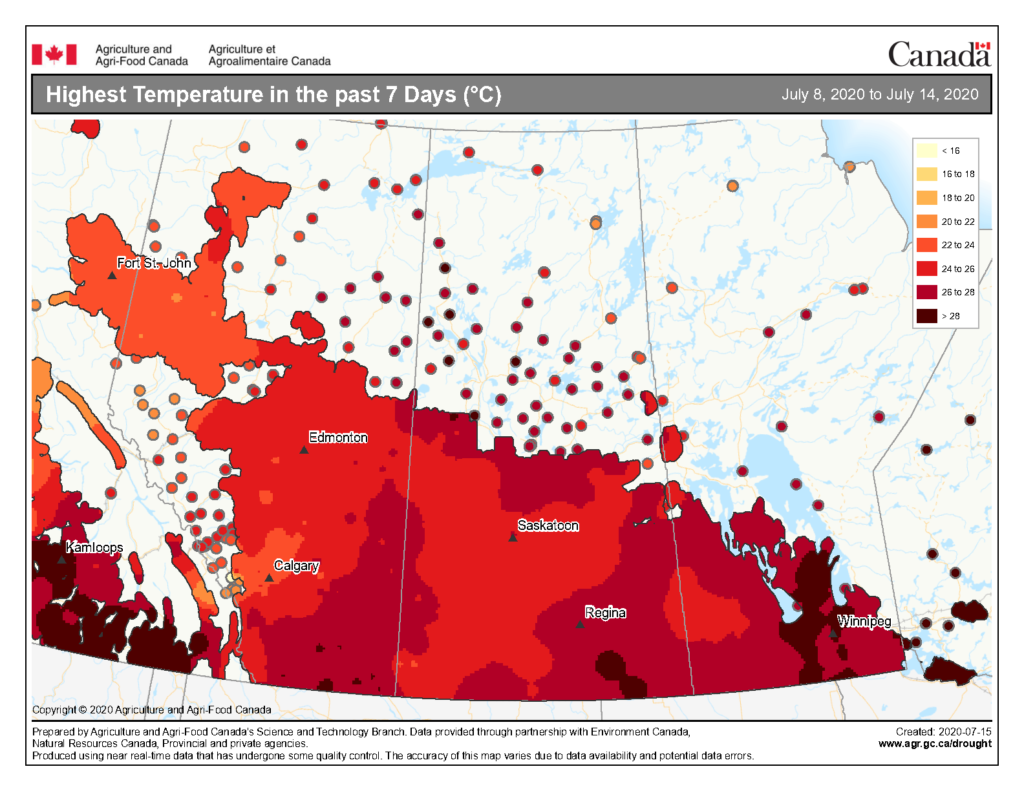
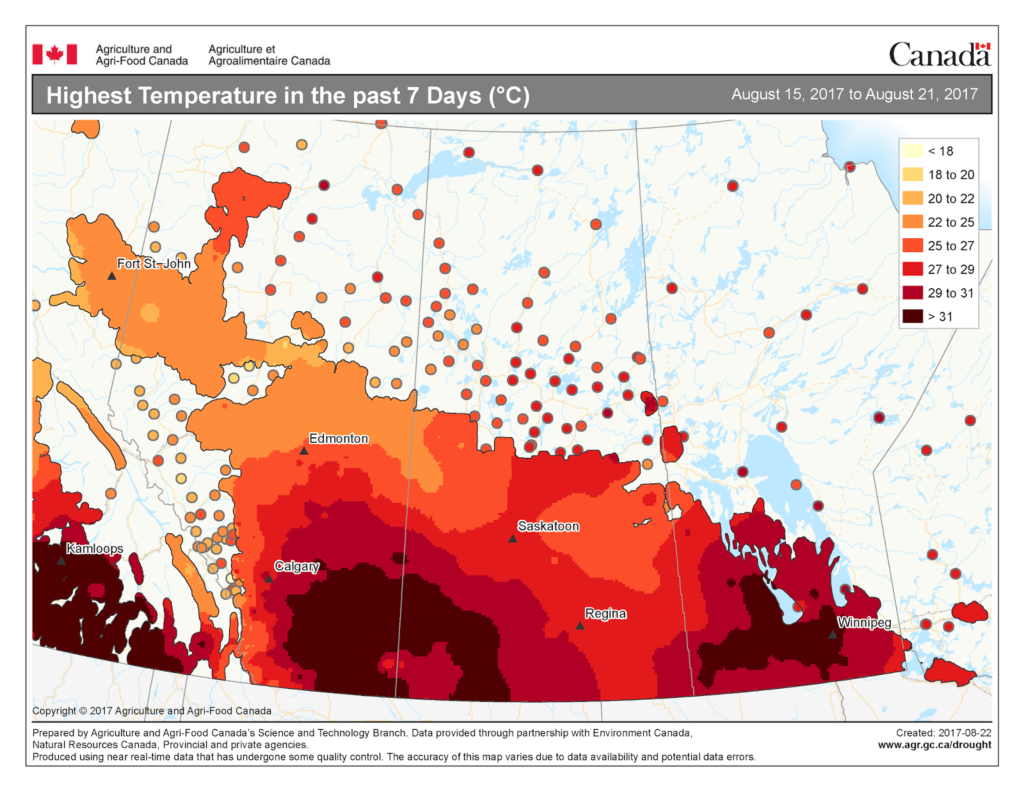
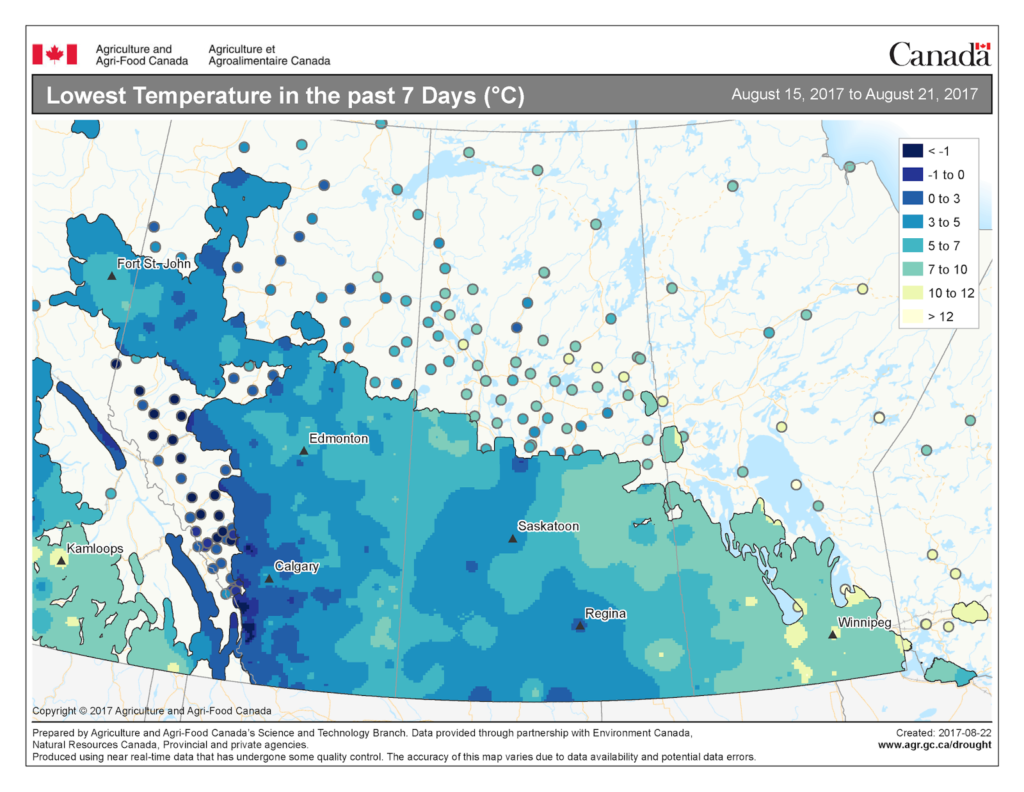
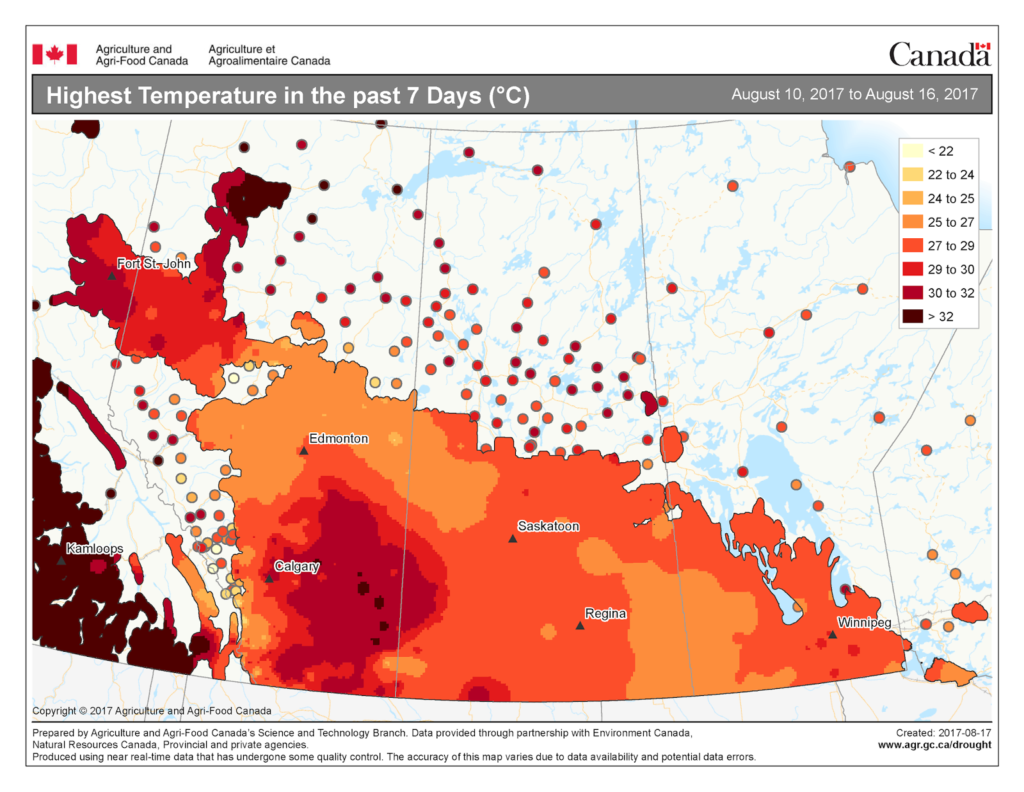
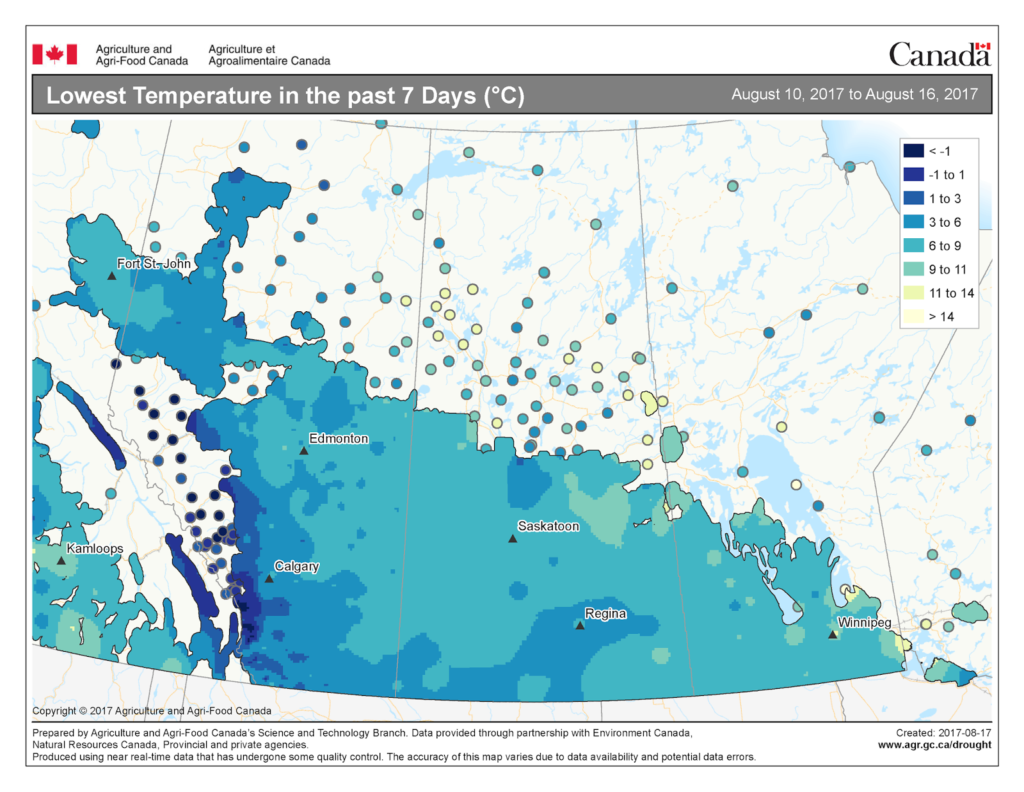
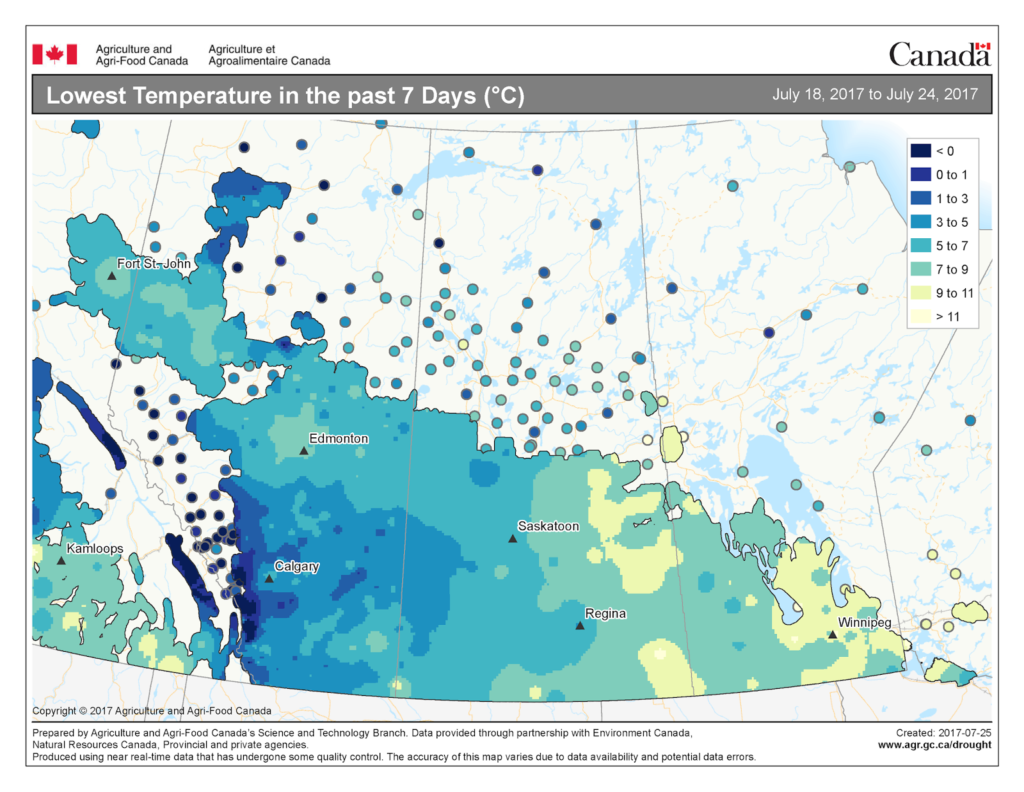
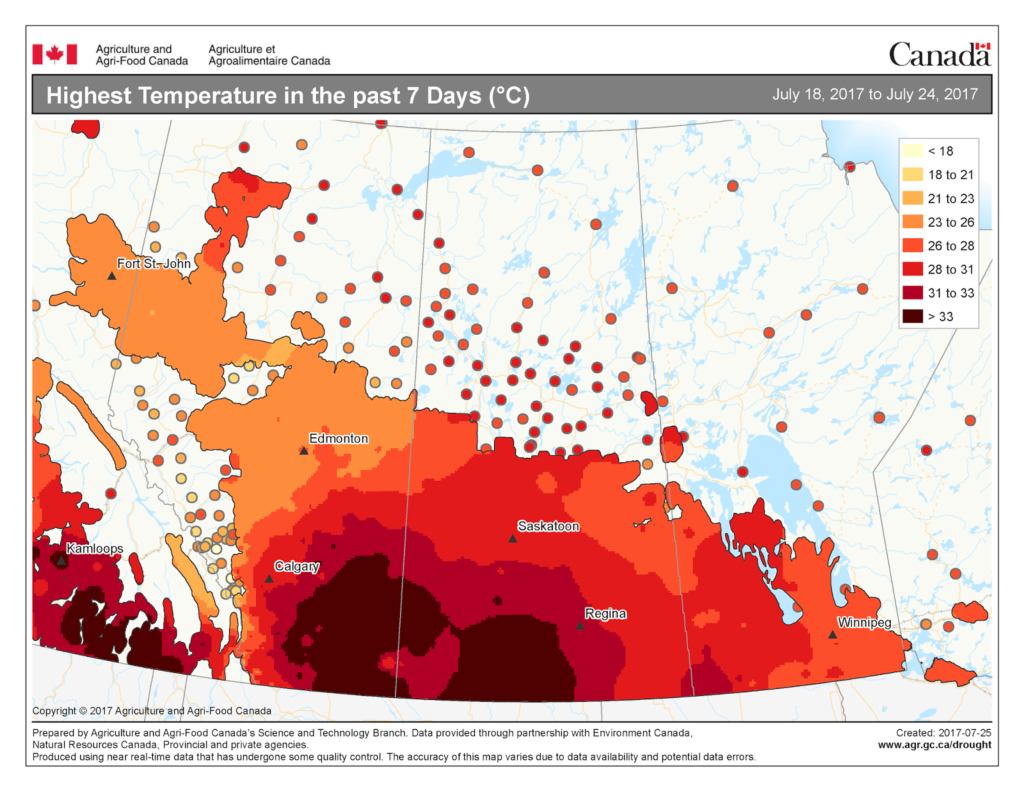
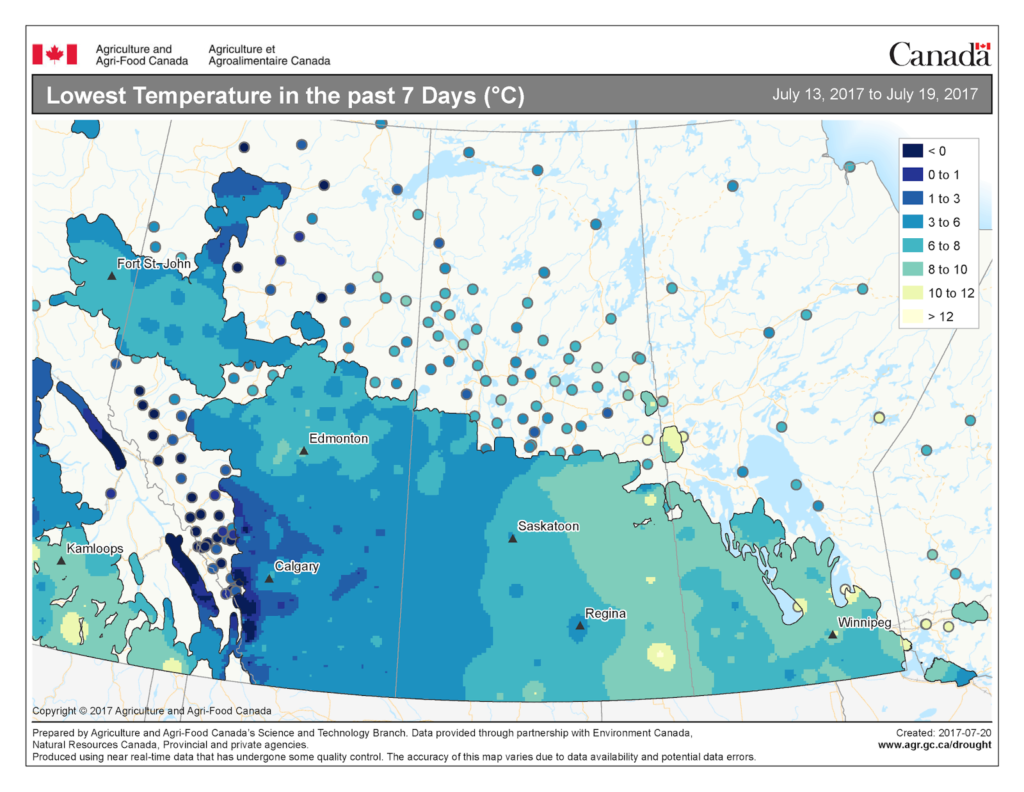
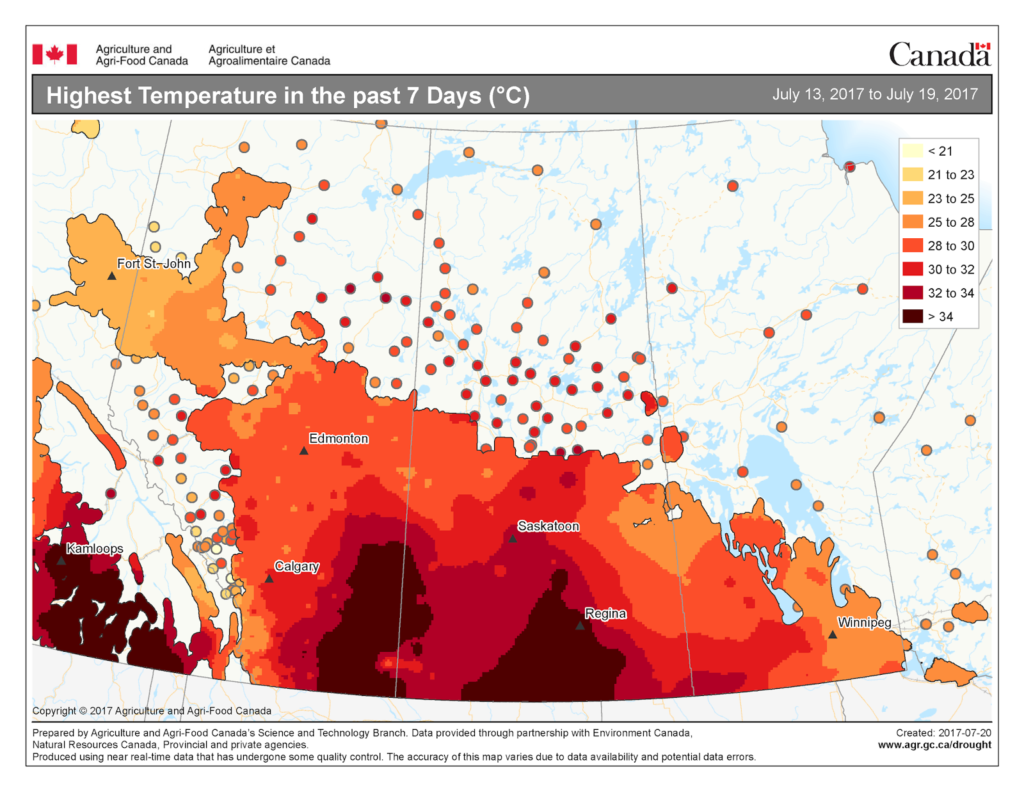
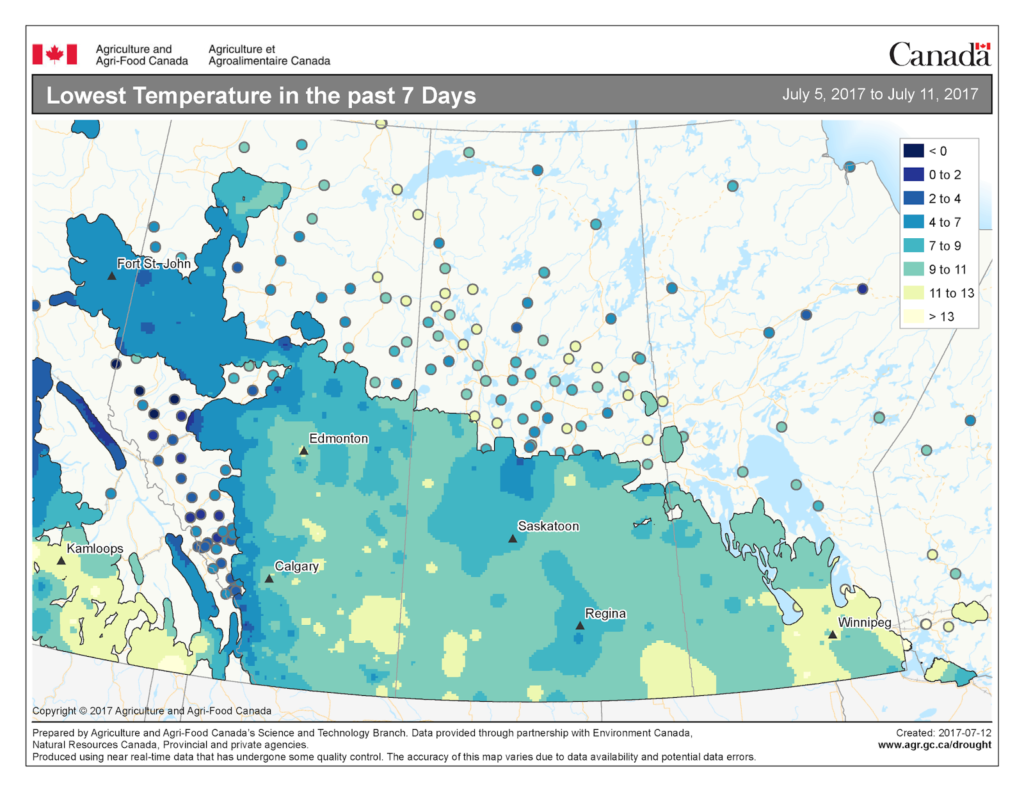
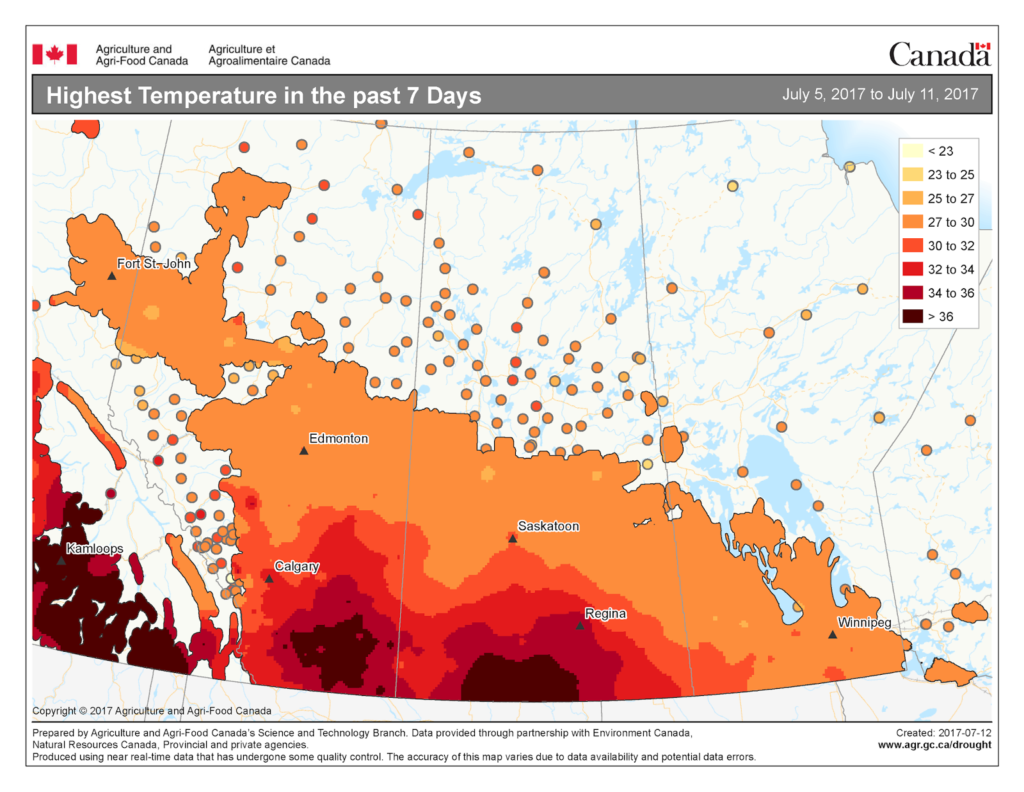
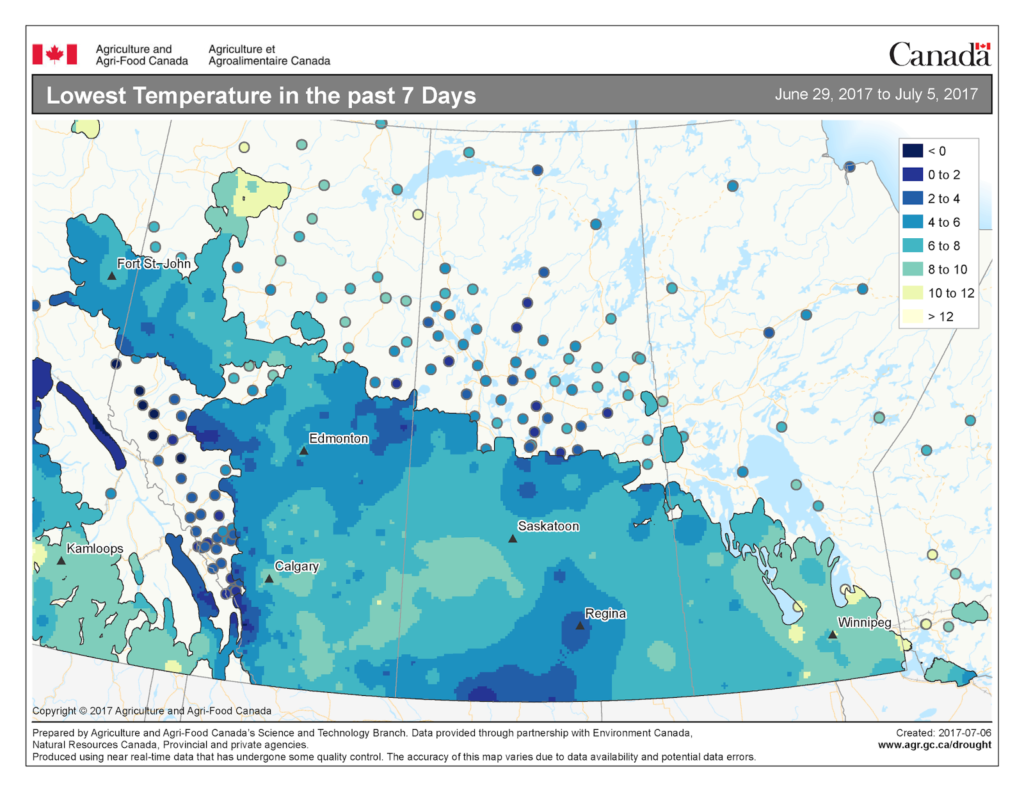
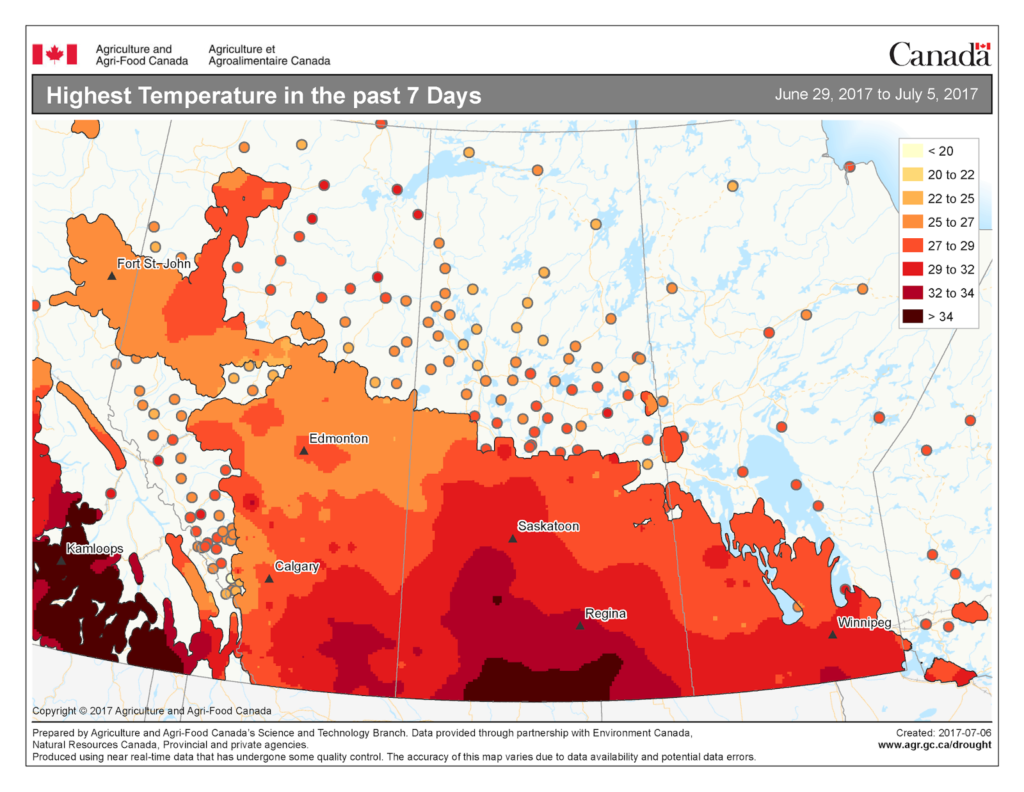
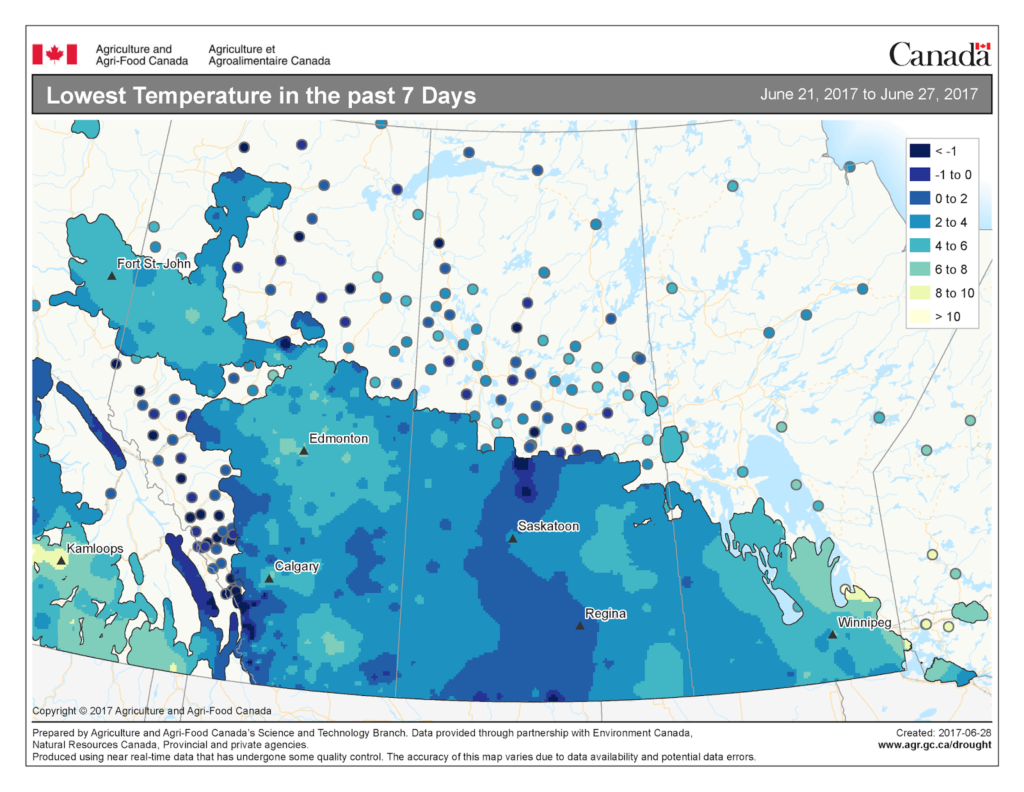
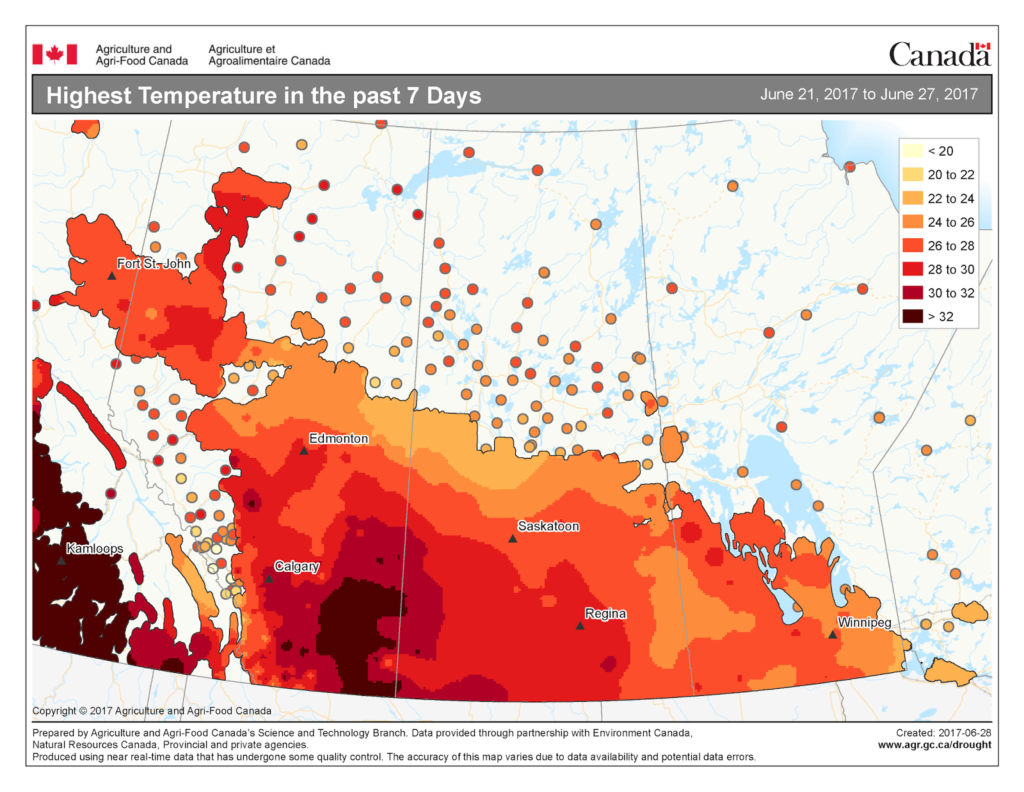
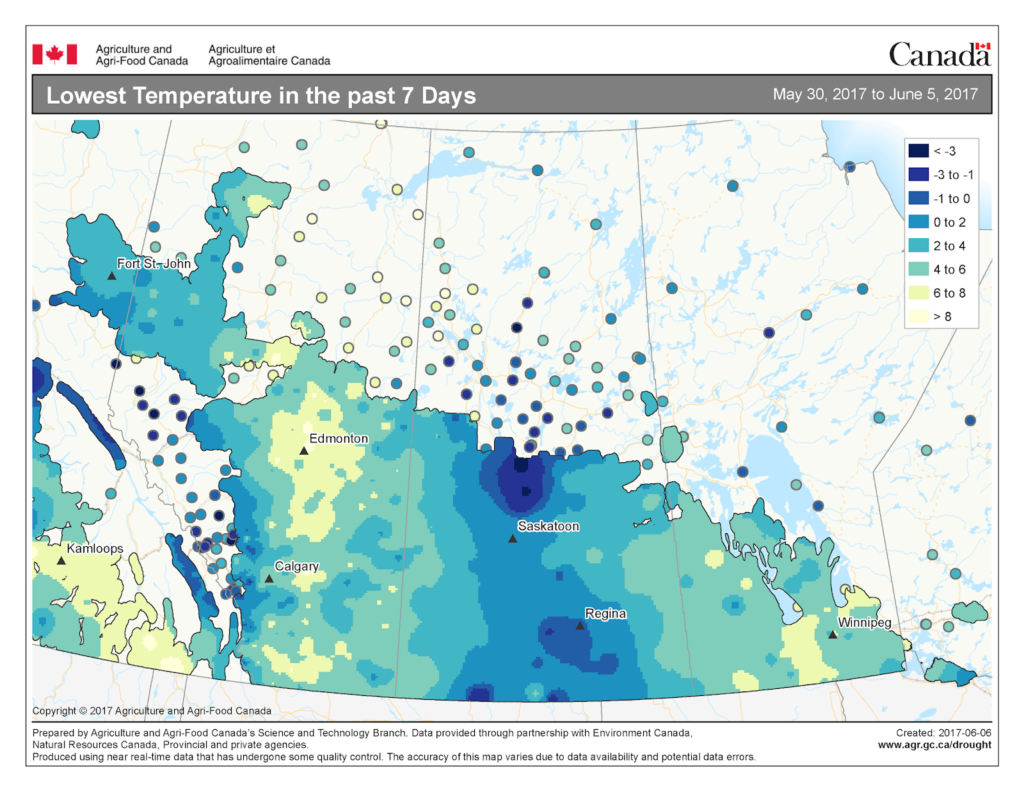
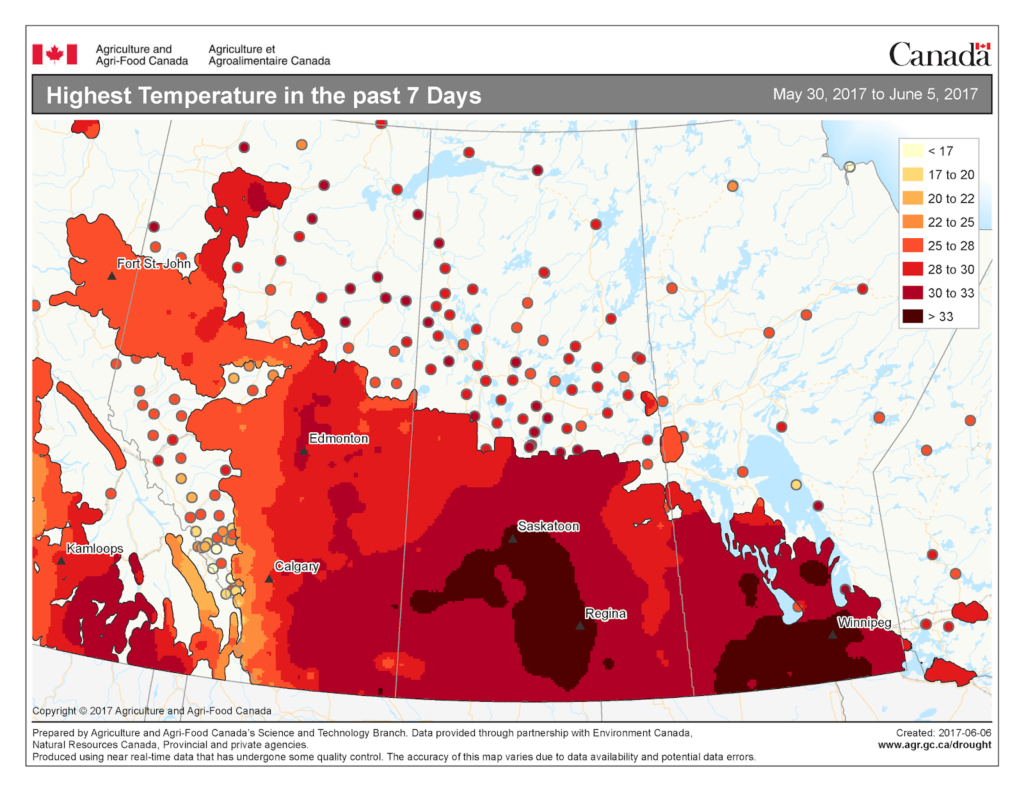
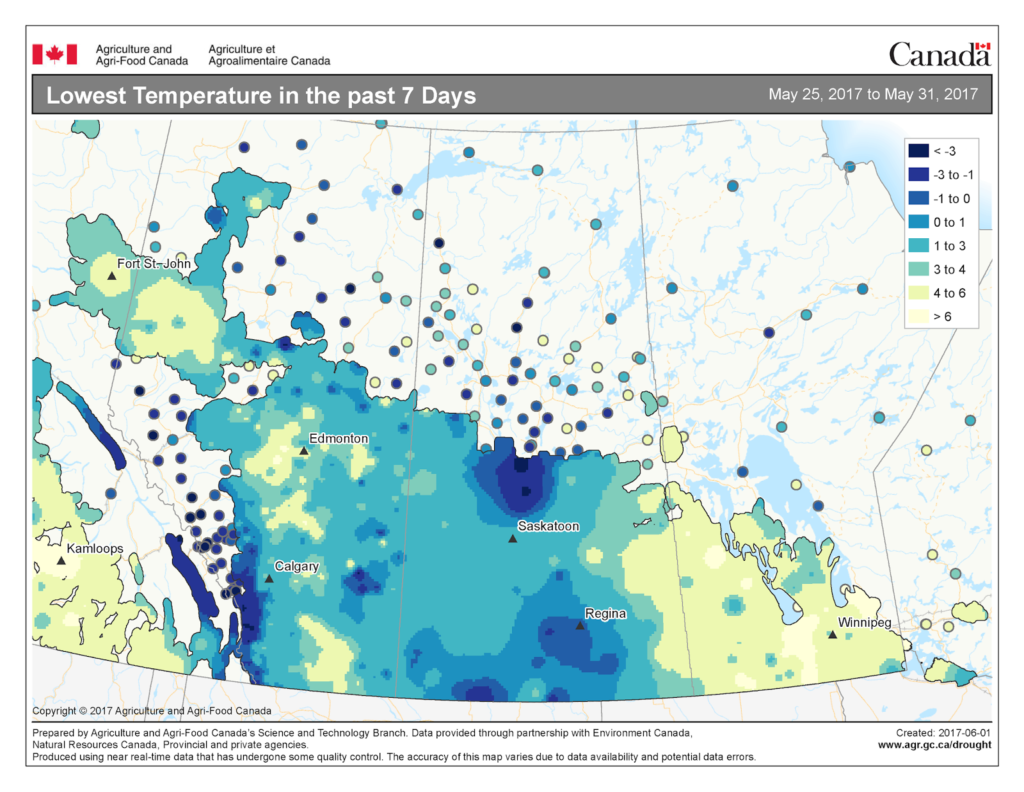
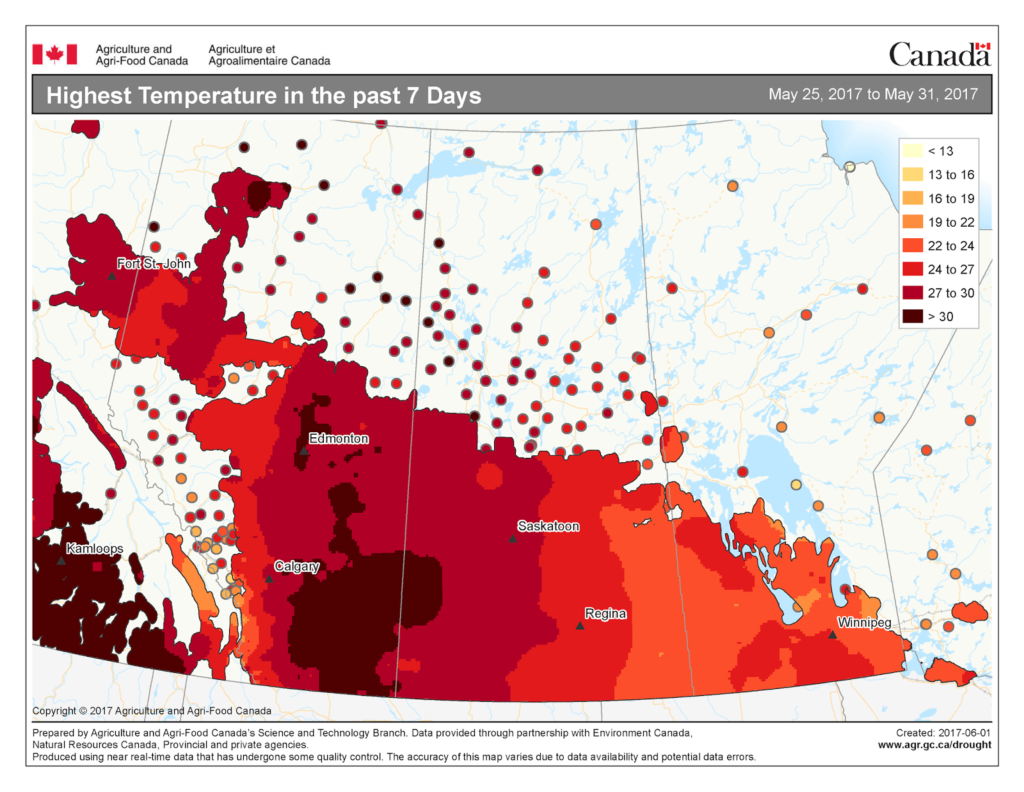
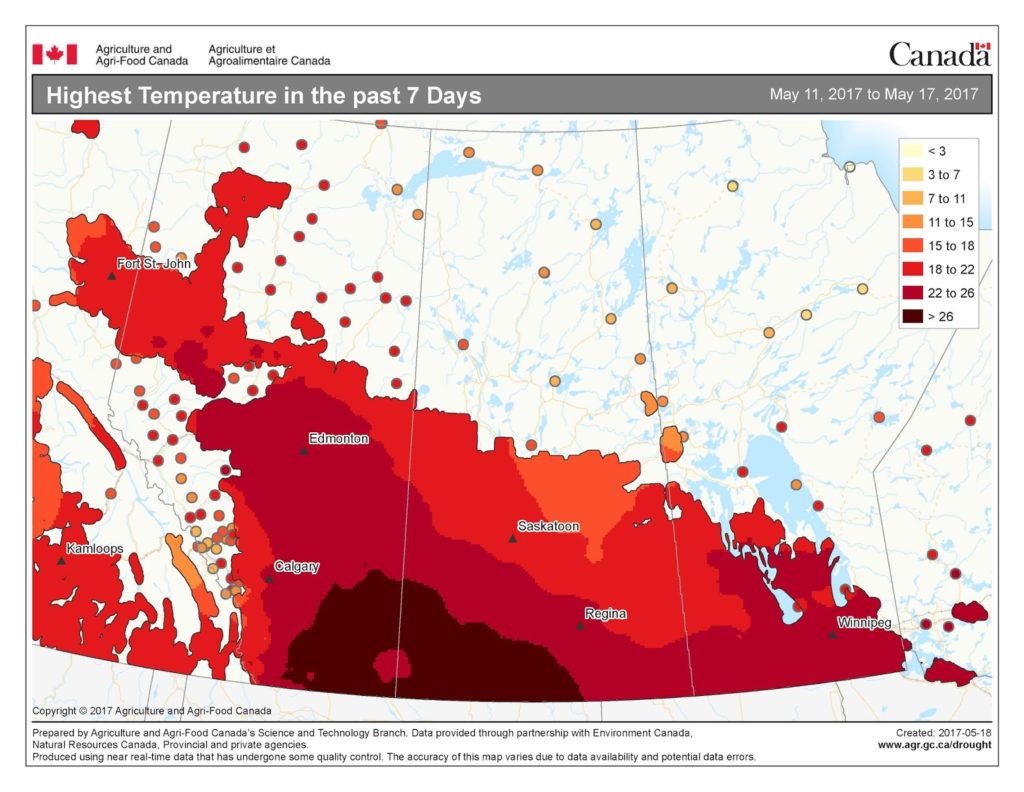
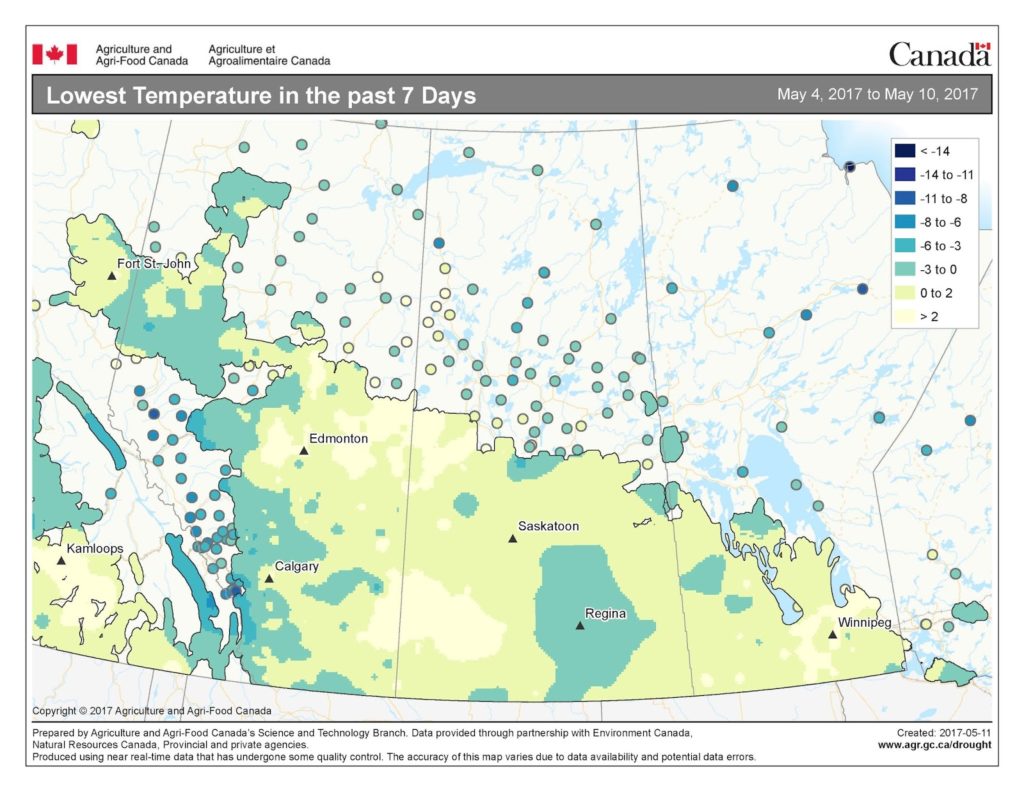
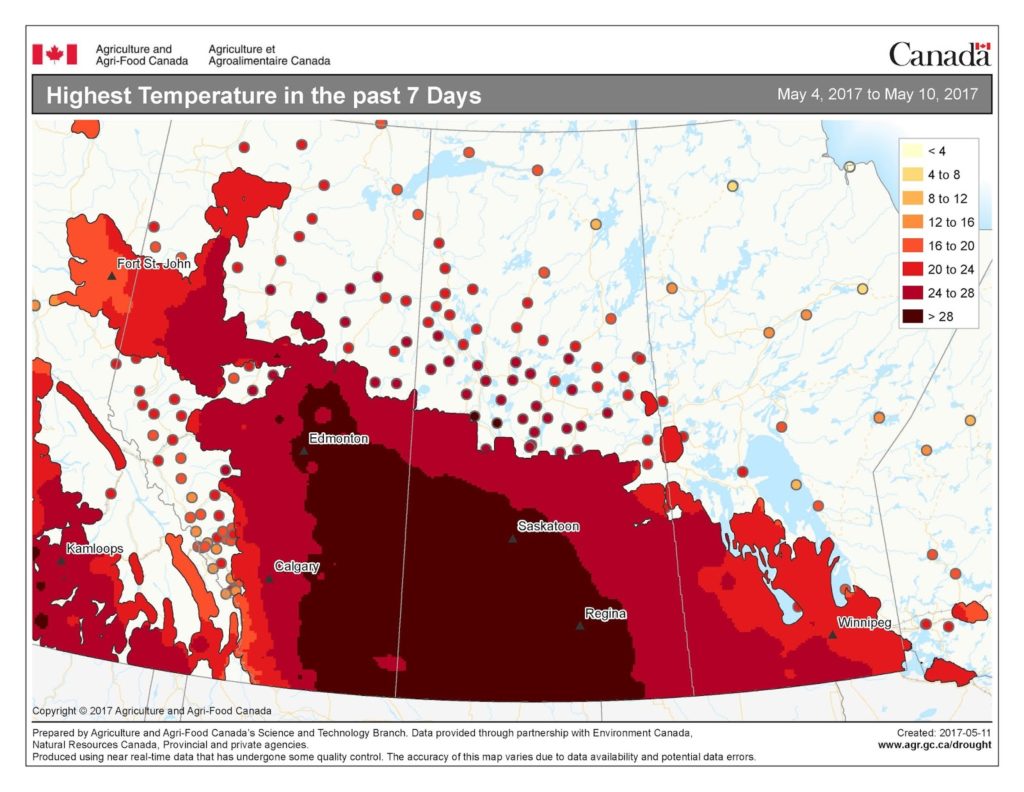
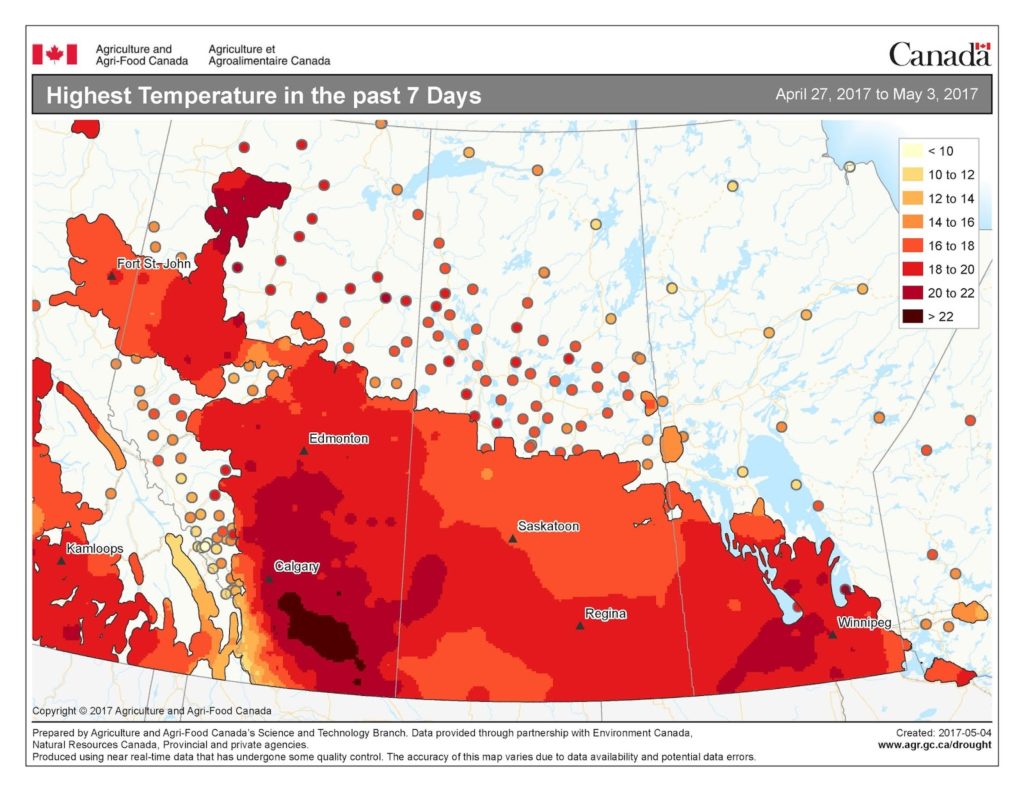
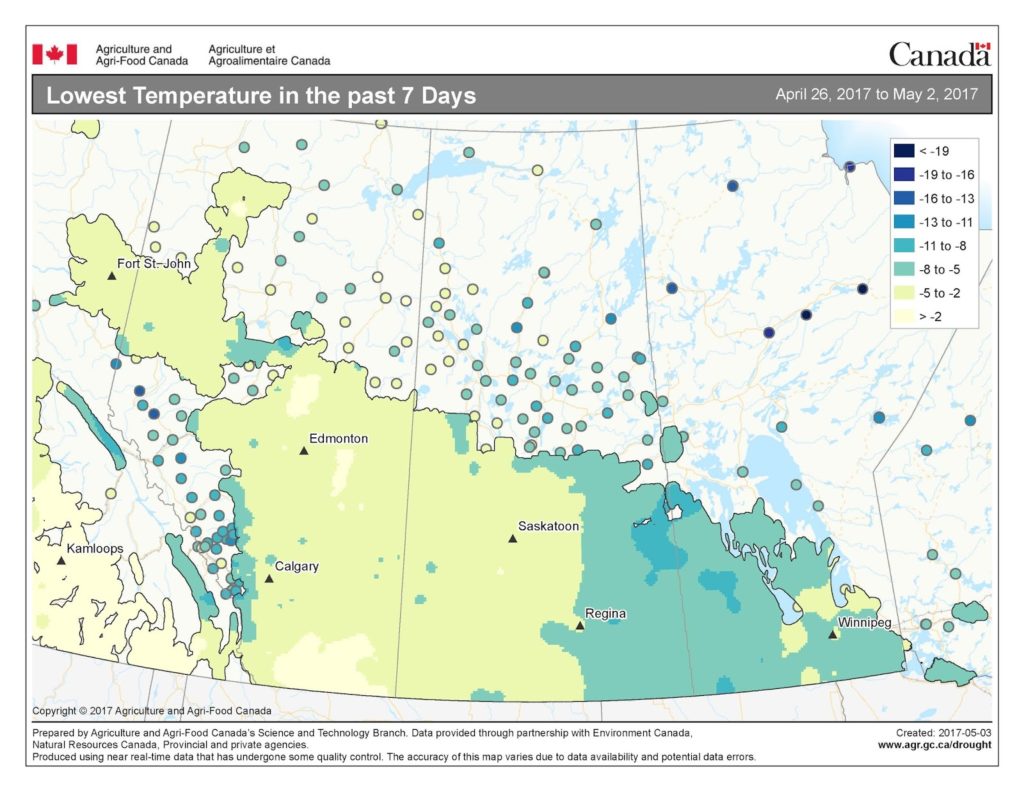
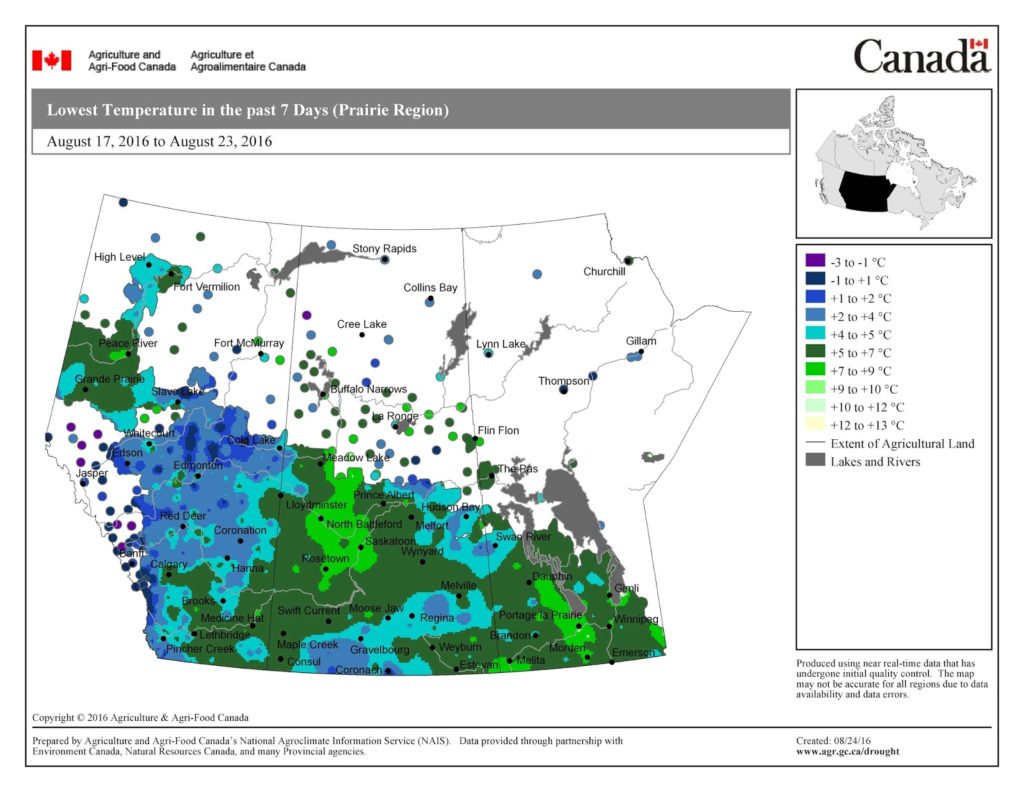
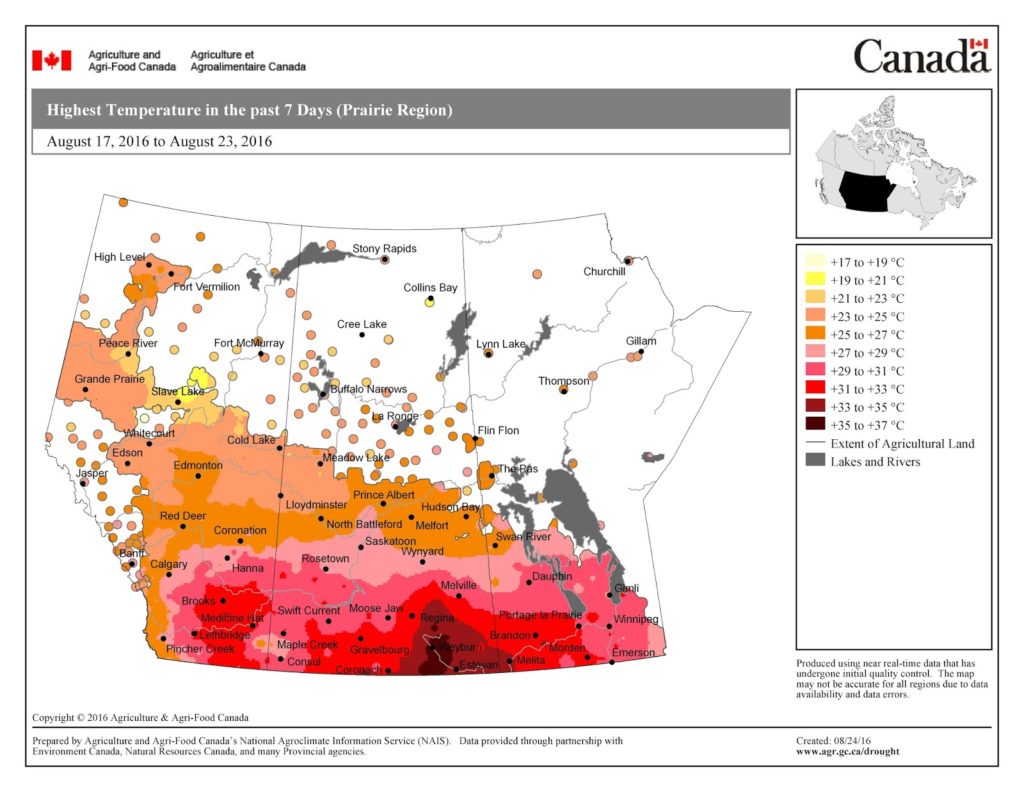
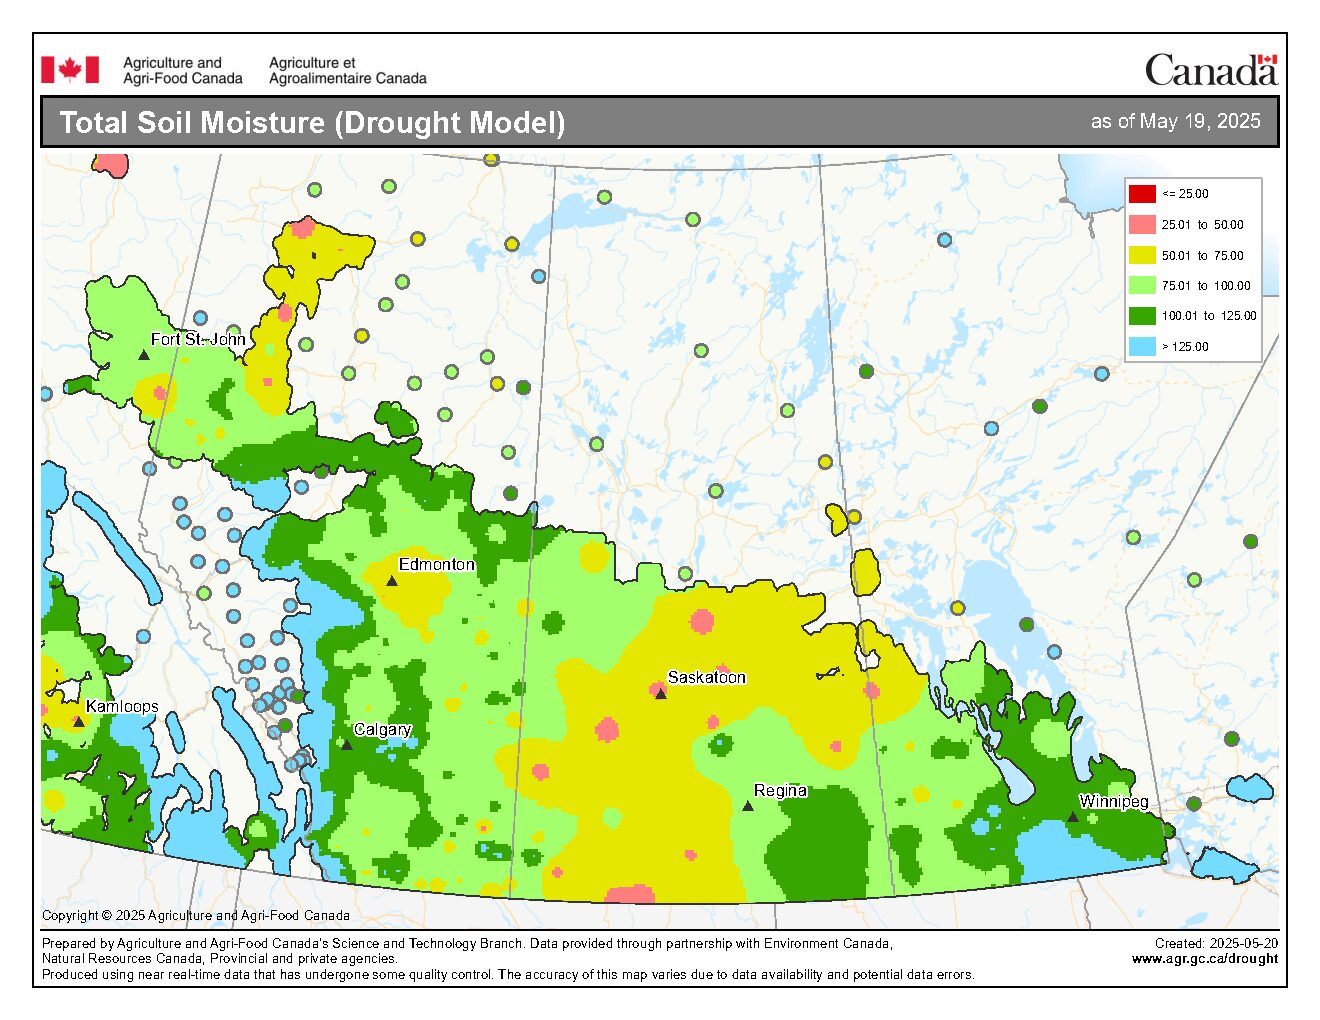
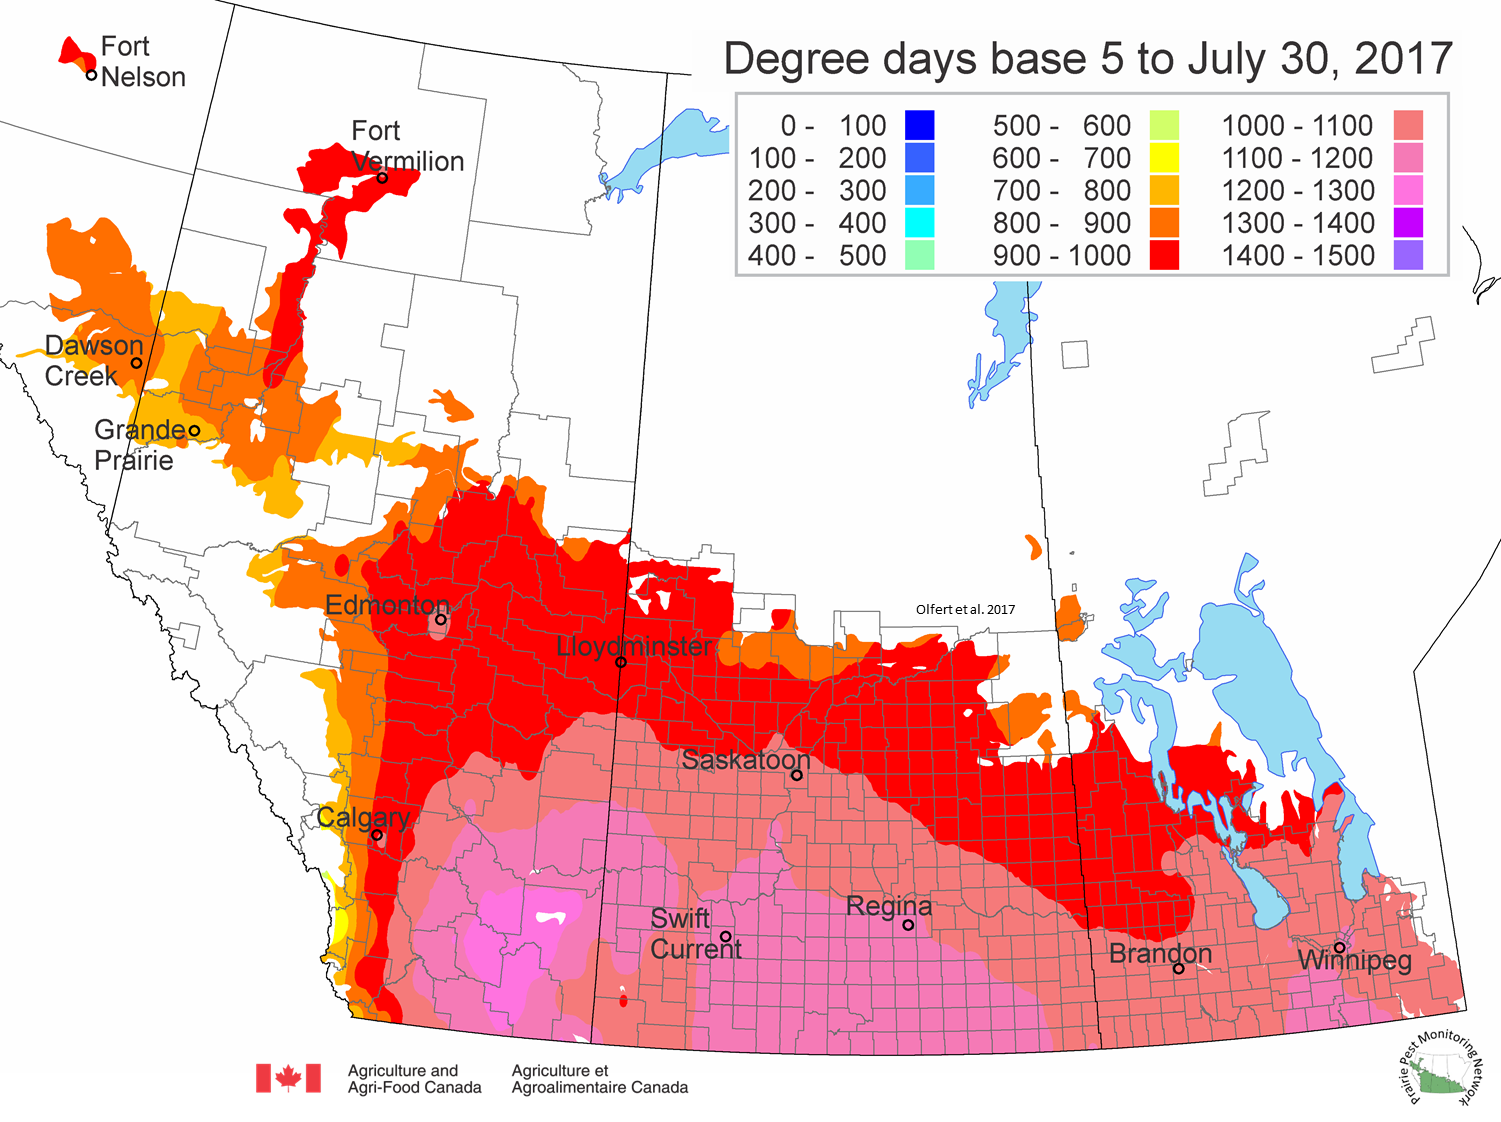
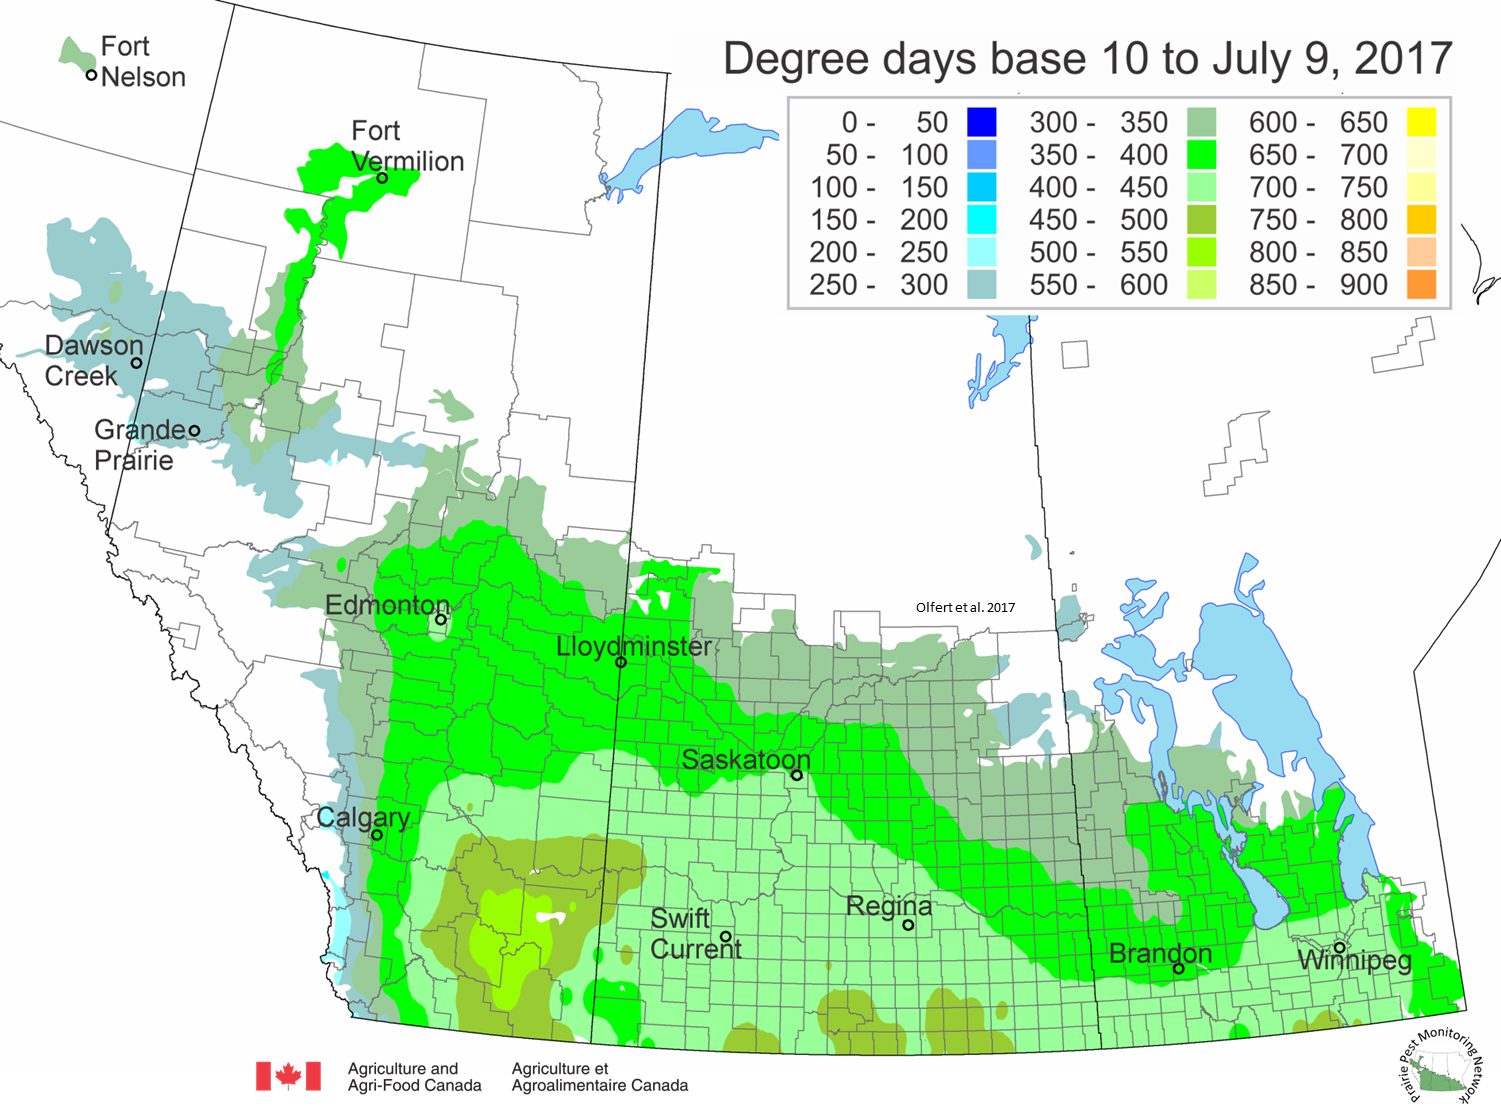
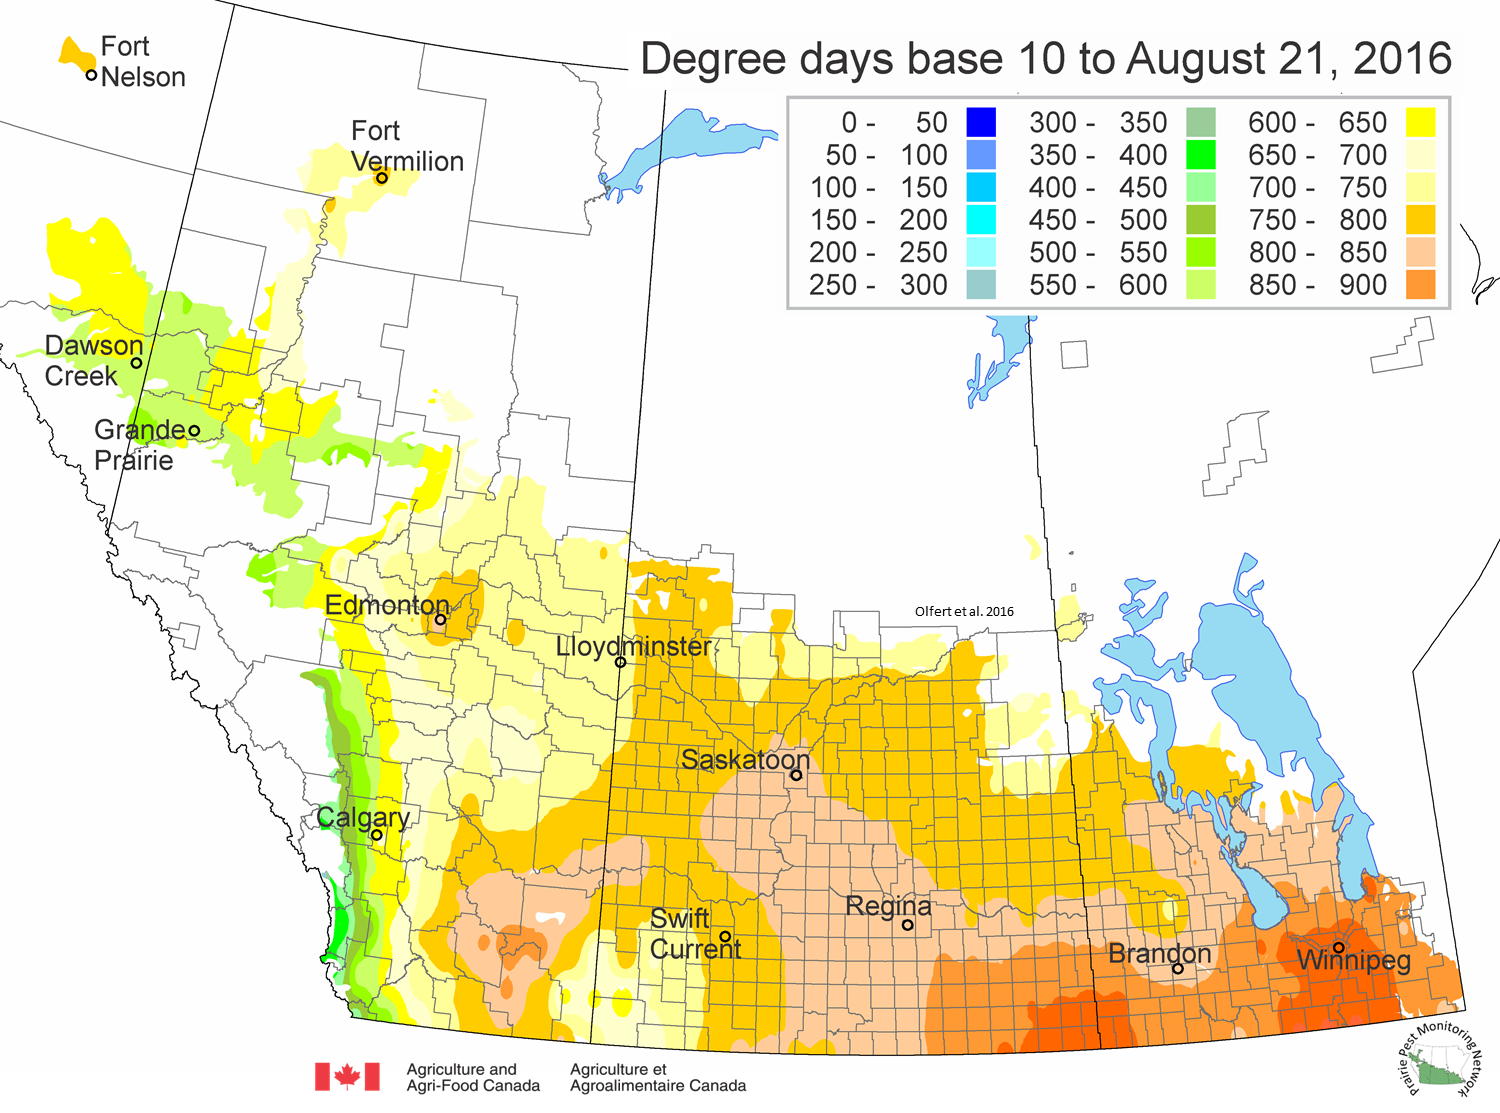
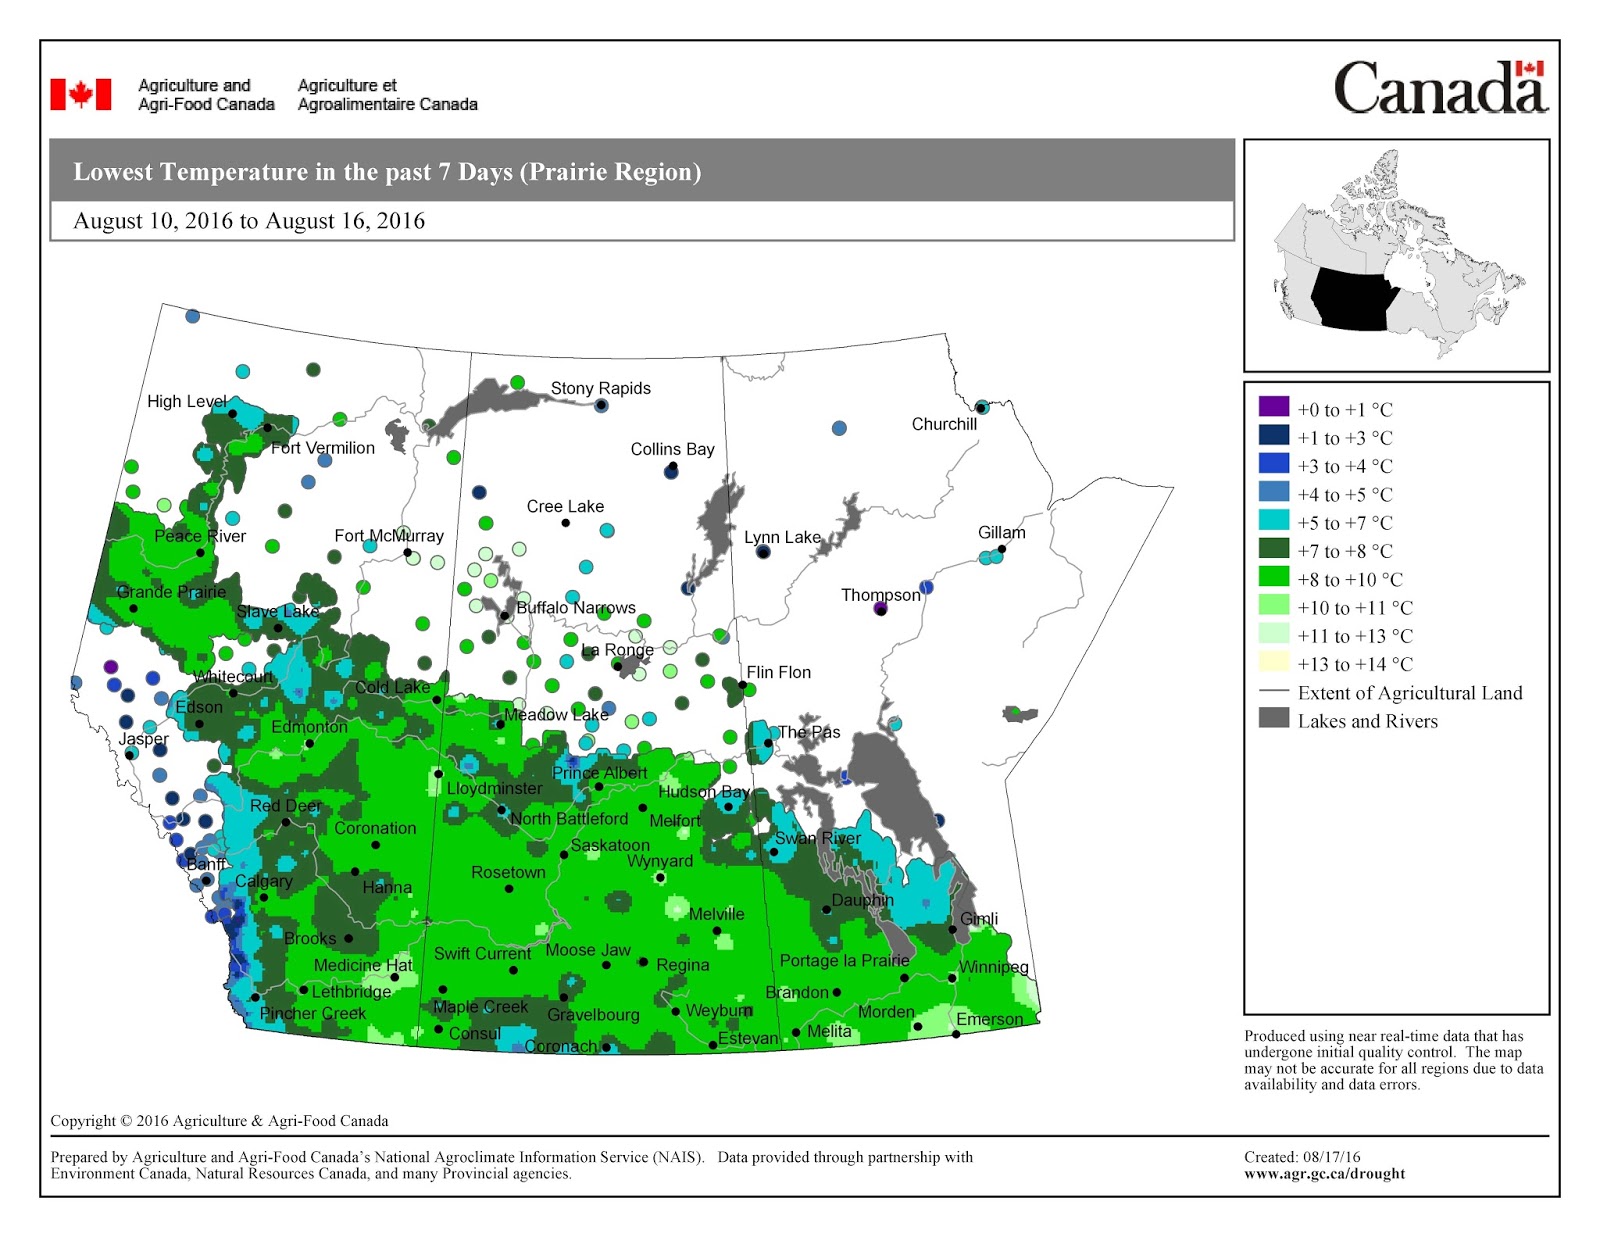
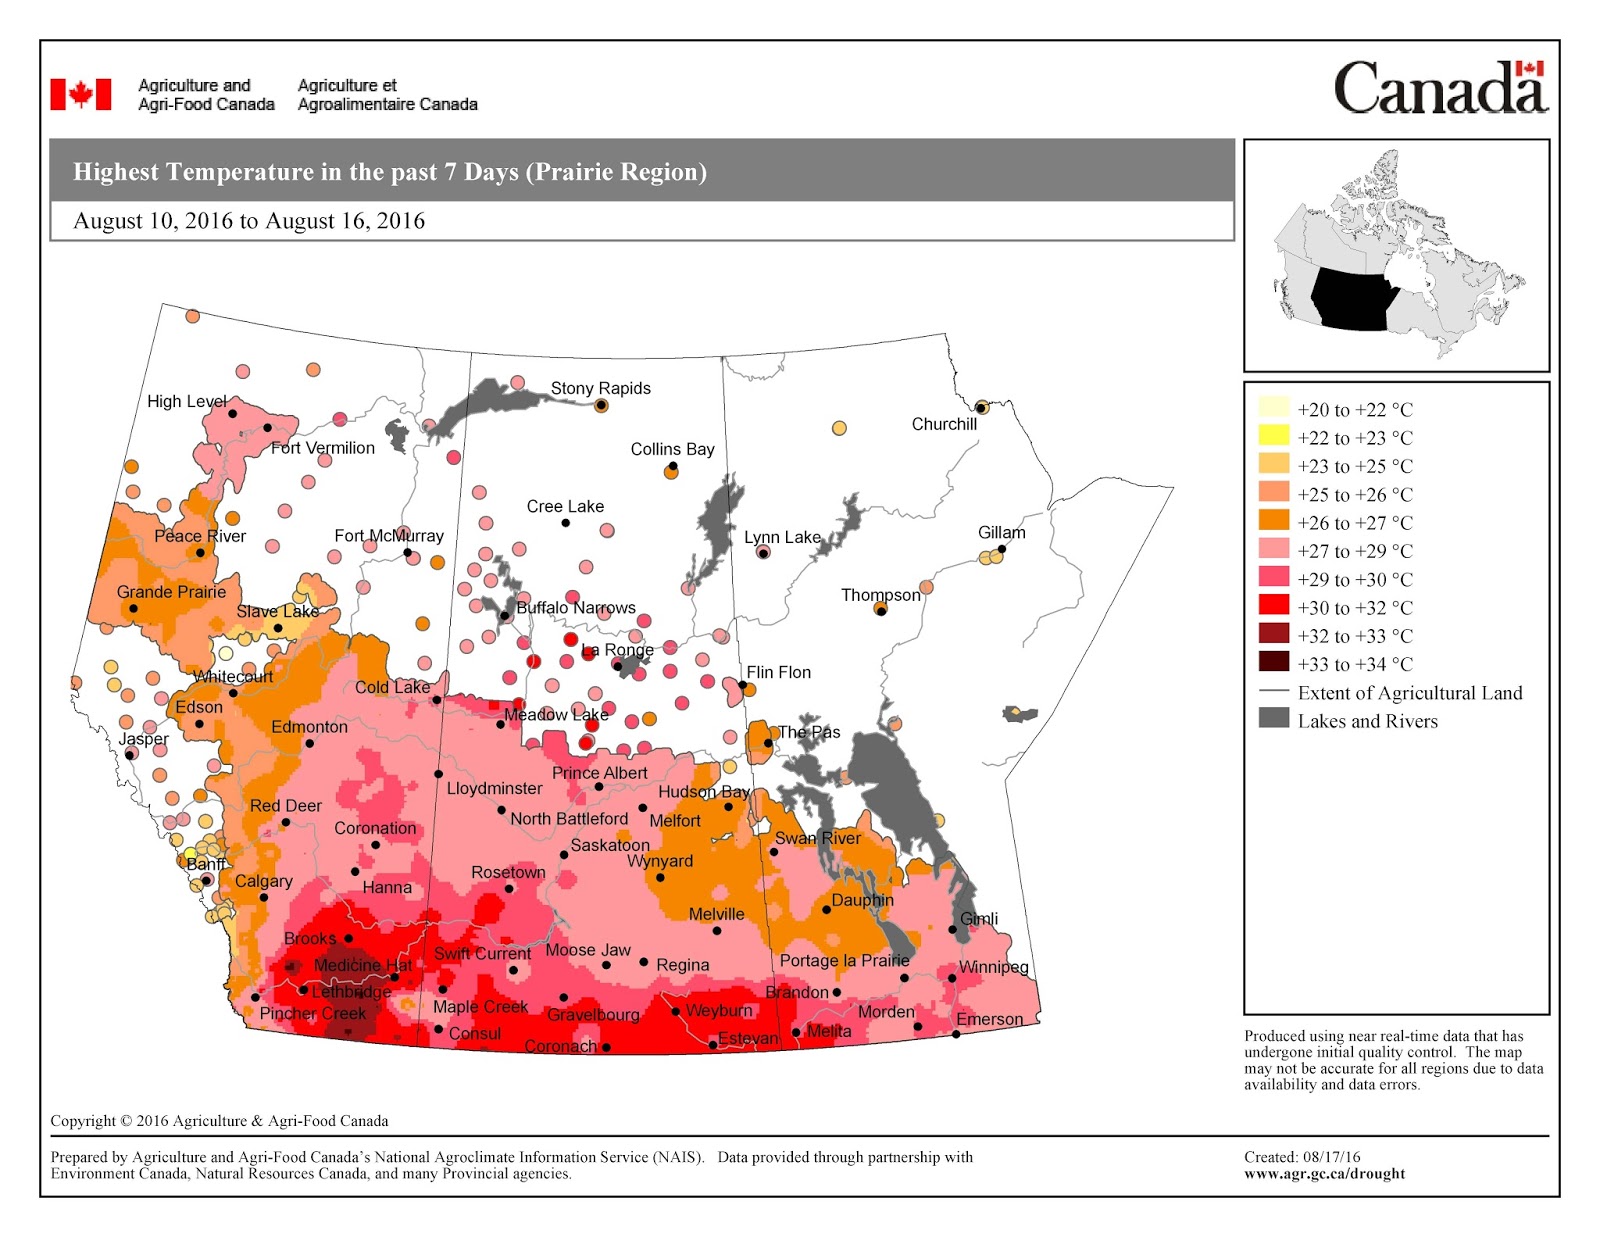
To help summarize the growing season so far, access the Growing Degree Day (GDD) dynamic maps for Base 5 ºC and Base 10 ºC (April 1-June 24, 2025). Over the past 7 days (as of June 23, 2025), the lowest temperatures recorded across the Canadian prairies ranged from < -3 to > 8 °C while the highest temperatures observed ranged again from <4 to >28 °C. Additionally, review the total soil moisture (static) across western Canada as of June 23, 2025, but also the soil moisture expressed as percent of normal. Access these maps and more using the AAFC Maps of Historic Agroclimate Conditions interface.
Growers can bookmark the AAFC Maps of Current Agroclimate Conditions for the growing season.


