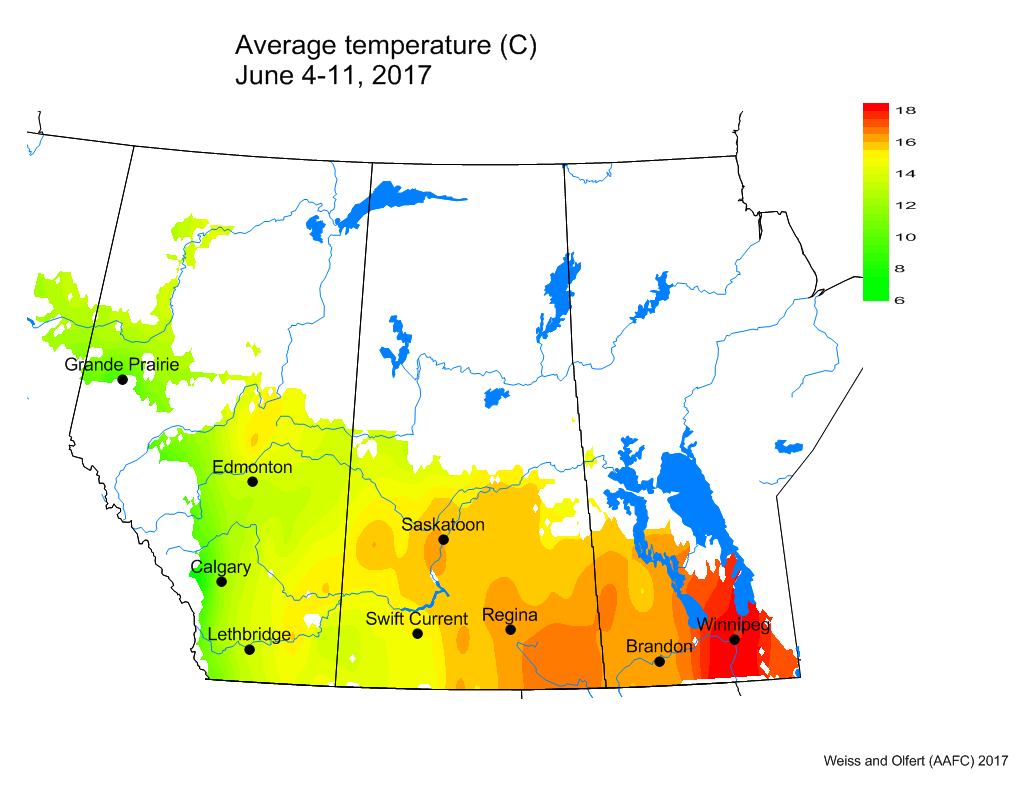
Weather synopsis – Over this past week, average temperatures were similar to last week and only marginally cooler than long term averages for early June. Average temperatures were warmest in southern Manitoba with cooler conditions occurring across Alberta.
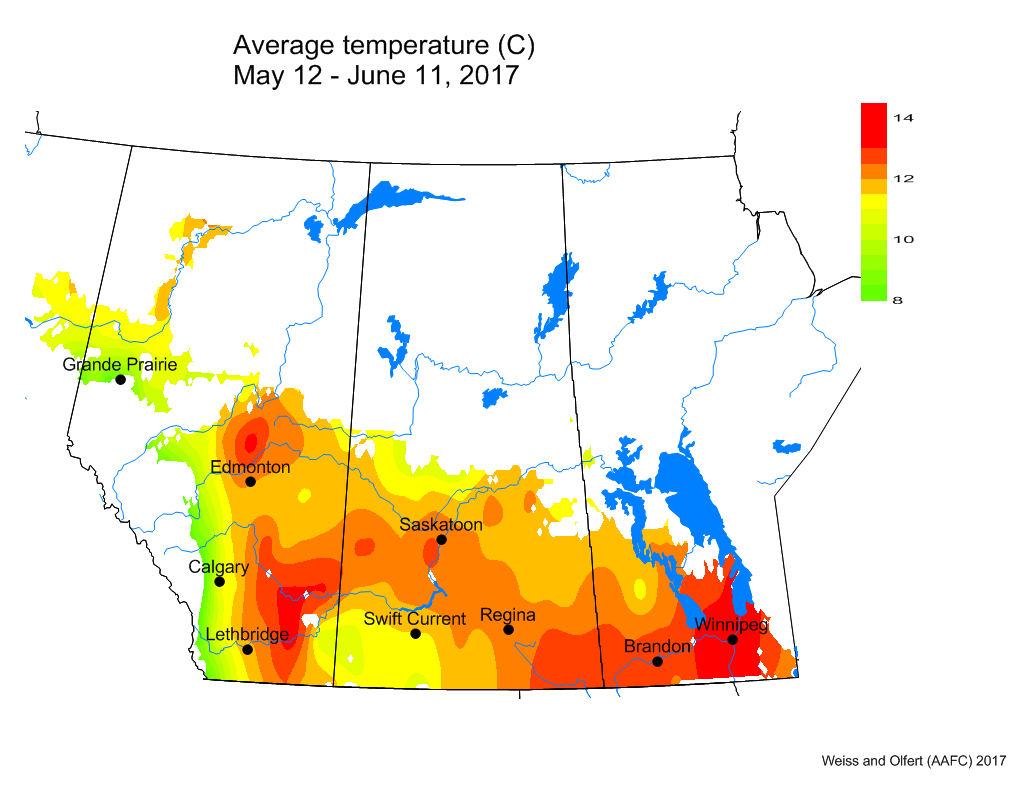
This second map presents the 30 Day Average Temperature. Average temperatures were greatest in southern regions of Manitoba and central Alberta.
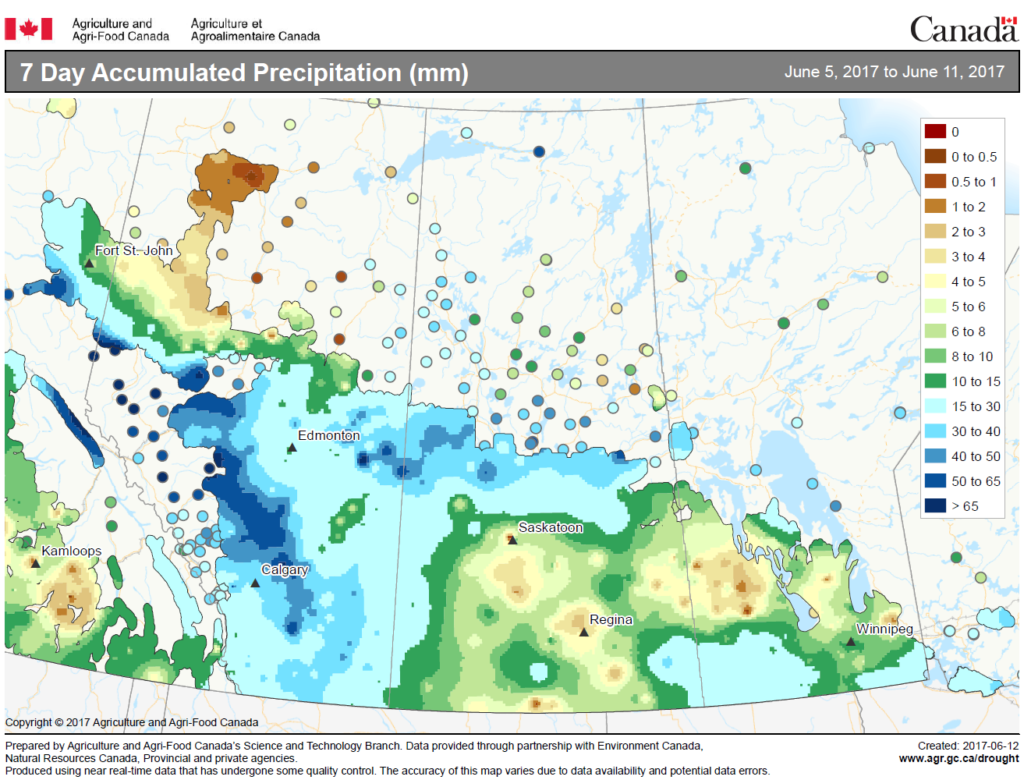
The map below indicates that 7 Day Accumulated Precipitation was greatest across Alberta while central and southern Saskatchewan continued to be dry.
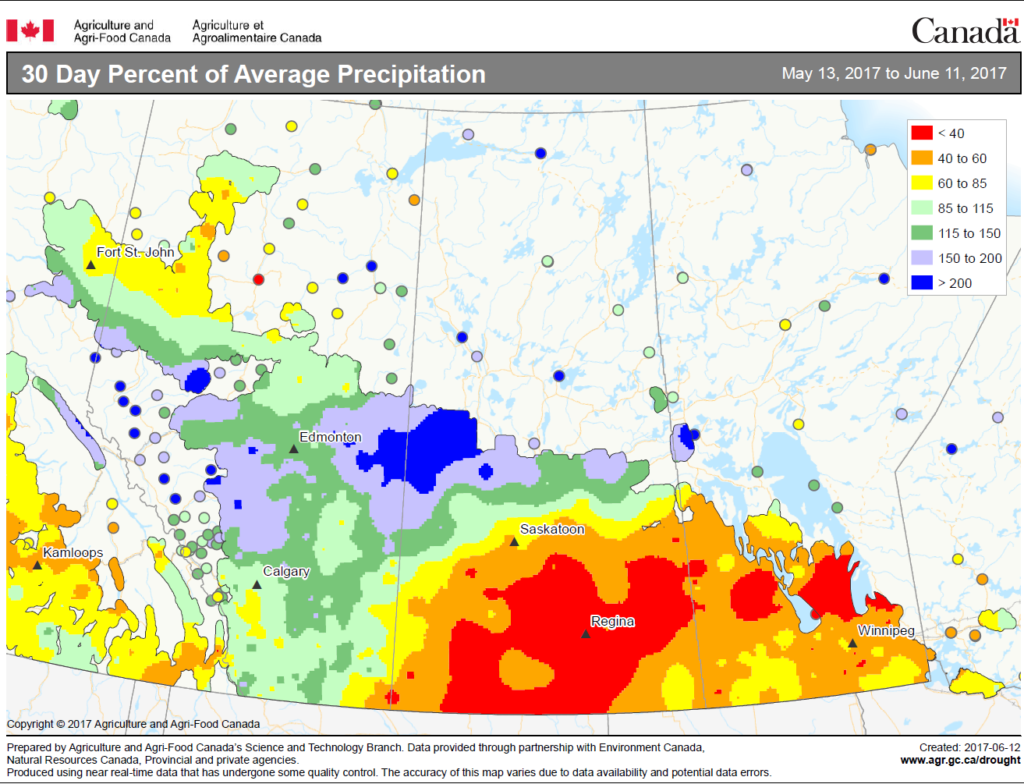
The map below indicates that the rainfall amounts for the past month (May 13 – June 11) were average to above-average in Alberta and below-average for Manitoba and Saskatchewan.
The updated growing degree day map (GDD) (Base 5ºC, March 1 – June 11, 2017) is below:
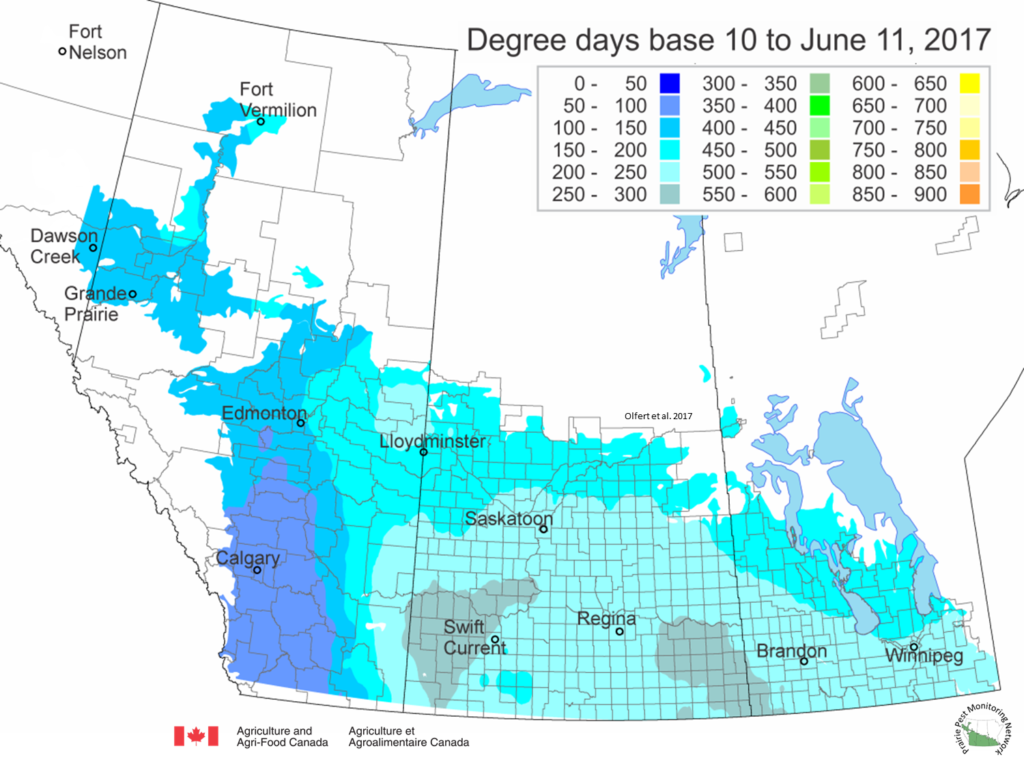
While the growing degree day map (GDD) (Base 10ºC, March 1 – June 11, 2017) is below:
The maps above are all produced by Agriculture and Agri-Food Canada. Growers may wish to bookmark the AAFC Drought Watch Maps for the growing season.
