Across the prairies, average temperatures were slightly cooler than long term climate normals (Fig. 1).
Figure 1. Mean temperature difference (°C) from Normal observed across the Canadian prairies for the past month (July 23- August 19, 2019). Image has not been reproduced in affiliation with, or with the endorsement of the Government of Canada and was retrieved (22Aug2019). Access the full map at the AGR website.
Significant rainfall amounts were reported across parts of the northern Peace River region, southern AB and SK (Fig. 2). Across the prairies, rainfall amounts for the past 30 days have been lowest across the southern prairies (Fig. 3 and 4).
Figure 2. Accumulated precipitation (mm) observed across the Canadian prairies for the past seven days (as of August 21, 2019). Image has not been reproduced in affiliation with, or with the endorsement of the Government of Canada and was retrieved (22Aug2019). Access the full map at the AGR website.Figure 3. Accumulated precipitation (mm) observed across the Canadian prairies for the past 30 days (as of August 21, 2019). Image has not been reproduced in affiliation with, or with the endorsement of the Government of Canada and was retrieved (22Aug2019). Access the full map at the AGR website. Figure 4. Percent of average precipitation (%) for the Canadian prairies for the past 30 days (as of August 21, 2019). Image has not been reproduced in affiliation with, or with the endorsement of the Government of Canada and was retrieved (22Aug2019). Access the full map at the AGR website.
Growing season rainfall amounts have been below average across much of Manitoba, southern regions of AB and west-central SK, and in the far north of the Peace River region (Fig. 5).
Figure 5. Percent of average precipitation observed across the Canadian prairies for the growing season (April 1-August 21, 2019). Image has not been reproduced in affiliation with, or with the endorsement of the Government of Canada and was retrieved (22Aug2019). Access the full map at the AGR website.
The growing degree day map (GDD) (Base 5 ºC, April 1-August 18, 2019) is below (Fig. 6):
The growing degree day map (GDD) (Base 10 ºC, April 1-August 18, 2019) is below (Fig. 7):
The lowest temperatures (°C) observed the past seven days ranged from at least 10 down to below -2 °C in the map below (Fig. 8).
Figure 8. Lowest temperatures (°C) observed across the Canadian prairies the past seven days (to August 21, 2019). Image has not been reproduced in affiliation with, or with the endorsement of the Government of Canada and was retrieved (22Aug2019). Access the full map at the AGR website.
The highest temperatures (°C) observed the past seven days ranged from at least 17 up to at least 33 °C in the map below (Fig. 9).
Figure 9. Highest temperatures (°C) observed across the Canadian prairies the past seven days (to August 21, 2019). Image has not been reproduced in affiliation with, or with the endorsement of the Government of Canada and was retrieved (22Aug2019). Access the full map at the AGR website.
The maps above are all produced by Agriculture and Agri-Food Canada. Growers can bookmark the AAFC Drought Watch Maps for the growing season.
This past week (August 6-12, 2019) prairie temperatures were almost 3 °C cooler than last week (Fig. 1). The warmest temperatures were observed in southern AB and MB and eastern AB.
Figure 1. Average temperature (°C) across the Canadian prairies the past seven days (August 6-12, 2019).
Across the prairies, 30 day (July 13- August 12, 2019; Fig. 2) average temperatures were slightly cooler than long term climate normals (Fig. 3). Temperatures were warmest across MB.
Figure 2. Average temperature (°C) across the Canadian prairies the past 30 days (July 13-August 12, 2019).Figure 3. Mean temperature difference (°C) from Normal observed across the Canadian prairies for the past month (July 16-August 12 2019). Image has not been reproduced in affiliation with, or with the endorsement of the Government of Canada and was retrieved (15Aug2019). Access the full map at http://www.agr.gc.ca/DW-GS/current-actuelles.jspx?lang=eng&jsEnabled=true
Growing season temperatures (April 1-August 12, 2019) continue to be approximately 1 °C cooler than average (Fig. 4).
Figure 4. Average temperature (°C) across the Canadian prairies for the growing season (April 1-August 12, 2019).
Significant rainfall amounts were reported across parts of the northern Peace River region, southern AB and SK (Fig. 5). Across the prairies, rainfall amounts for the past 30 days have been lowest across the southern prairies (Fig. 6).
Figure 5. Cumulative precipitation observed the past seven days across the Canadian prairies (August 6-12, 2019).Figure 6. Cumulative precipitation observed the past 30 days across the Canadian prairies (July 13-August 12, 2019).
Growing season rainfall amounts (Fig. 7) have been below average across southern regions of AB and west-central SK (Fig. 8).
Figure 7. Cumulative precipitation observed across the Canadian prairies for the growing season (April 1-August 12, 2019) .Figure 8. Percent of average precipitation observed across the Canadian prairies for the growing season (April 1-August 14, 2019). Image has not been reproduced in affiliation with, or with the endorsement of the Government of Canada and was retrieved (15Aug2019). Access the full map at http://www.agr.gc.ca/DW-GS/current-actuelles.jspx?lang=eng&jsEnabled=true
The growing degree day map (GDD) (Base 5 ºC, April 1-August 11, 2019) is below (Fig. 9):
The growing degree day map (GDD) (Base 10 ºC, April 1-August 11, 2019) is below (Fig. 10):
The lowest temperatures (°C) observed the past seven days ranged from at least 12 down to below 0 °C in the map below (Fig. 11).
Figure 11. Lowest temperatures (°C) observed across the Canadian prairies the past seven days (to August 14, 2019). Image has not been reproduced in affiliation with, or with the endorsement of the Government of Canada and was retrieved (15Aug2019). Access the full map at http://www.agr.gc.ca/DW-GS/current-actuelles.jspx?lang=eng&jsEnabled=true
The highest temperatures (°C) observed the past seven days ranged from at least 20 up to at least 32 °C in the map below (Fig. 12).
Figure 12. Highest temperatures (°C) observed across the Canadian prairies the past seven days (to August 14, 2019). Image has not been reproduced in affiliation with, or with the endorsement of the Government of Canada and was retrieved (15Aug2019). Access the full map at http://www.agr.gc.ca/DW-GS/current-actuelles.jspx?lang=eng&jsEnabled=true
The maps above are all produced by Agriculture and Agri-Food Canada. Growers can bookmark the AAFC Drought Watch Maps for the growing season.
This past week (July 30- August 5, 2019) temperatures were similar to last week (Fig. 1). The warmest temperatures were observed across most of southern SK and eastern AB.
Figure 1. Average temperature (°C) across the Canadian prairies the past seven days (July 30-August 5, 2019).
Across the prairies, 30-day (July 6- August 5, 2019) average temperatures (Fig. 2) were similar to long term climate normals (Fig. 3). Temperatures were warmest across MB and eastern SK.
Figure 2. Average temperature (°C) across the Canadian prairies the past 30 days (July 6-August 5, 2019).Figure 3. Mean temperature difference (°C) from Normal observed across the Canadian prairies for the growing season (July 9-August 5, 2019). Image has not been reproduced in affiliation with, or with the endorsement of the Government of Canada and was retrieved (07Aug2019). Access the full map at http://www.agr.gc.ca/DW-GS/current-actuelles.jspx?lang=eng&jsEnabled=true
Growing season temperatures (April 1-August 5, 2019) in the Peace River region, central AB and SK have been 1 °C cooler than average while the remainder of the prairies has been warmer than normal (Fig. 4).
Figure 4. Average temperature (°C) across the Canadian prairies for the growing season (April 1-August 5, 2019).
Similar to last week, this week significant rainfall amounts were reported the parkland region of SK and AB (Fig. 5). Across the prairies, rainfall amounts for the past 30 days have been highly variable (Fig. 6). Dry conditions continue across southern AB and western SK.
Figure 5. Cumulative precipitation observed the past seven days across the Canadian prairies (July 30-August 5, 2019).Figure 6. Cumulative precipitation observed the past 30 days across the Canadian prairies (July 6-August 5, 2019).
Growing season rainfall amounts have been below average across southern regions of AB, and across MB (Fig. 7 and 8).
Figure 7. Cumulative precipitation observed for the growing season (April 1-August 5, 2019) across the Canadian prairies.Figure 8. Percent of average precipitation observed across the Canadian prairies for the growing season (April 1-August 6, 2019). Image has not been reproduced in affiliation with, or with the endorsement of the Government of Canada and was retrieved (08Aug2019). Access the full map at http://www.agr.gc.ca/DW-GS/current-actuelles.jspx?lang=eng&jsEnabled=true
The growing degree day map (GDD) (Base 5 ºC, April 1-August 5, 2019) is below (Fig. 9):
The growing degree day map (GDD) (Base 10 ºC, April 1-August 5, 2019) is below (Fig. 10):
The lowest temperatures (°C) observed the past seven days ranged from at least 11 down to at least 0 °C in the map below (Fig. 11).
Figure 11. Lowest temperatures (°C) observed across the Canadian prairies the past seven days (to August 6, 2019). Image has not been reproduced in affiliation with, or with the endorsement of the Government of Canada and was retrieved (08Aug2019). Access the full map at http://www.agr.gc.ca/DW-GS/current-actuelles.jspx?lang=eng&jsEnabled=true
The highest temperatures (°C) observed the past seven days ranged from at least 21 up to at least 34 °C in the map below (Fig. 12).
Figure 12. Highest temperatures (°C) observed across the Canadian prairies the past seven days (to August 6, 2019). Image has not been reproduced in affiliation with, or with the endorsement of the Government of Canada and was retrieved (08Aug2019). Access the full map at http://www.agr.gc.ca/DW-GS/current-actuelles.jspx?lang=eng&jsEnabled=true
The maps above are all produced by Agriculture and Agri-Food Canada. Growers can bookmark the AAFC Drought Watch Maps for the growing season.
This past week (July 22-28, 2019) temperatures were approximately 2 °C warmer than last week (Fig. 1). The warmest temperatures were observed in MB and southern AB while temperatures were cooler in western AB and the Peace River region.
Figure 1. Average temperature (°C) across the Canadian prairies the past seven days (July 22-28, 2019).
Across the prairies, 30-day (June 28 – July 28, 2019) average temperatures have been approximately 1 °C cooler than normal (Fig. 2). Temperatures were warmest across MB and eastern SK.
Figure 2. Average temperature (°C) across the Canadian prairies the past 30 days (June 28-July 28, 2019).
Growing season temperatures (April 1-July 28, 2019; Fig. 3) in AB and SK have been 1 °C cooler than average while central and eastern MB has been approximately 1 °C warmer than average (Fig. 4).
Figure 3. Average temperature (°C) across the Canadian prairies for the growing season (April 1-July 28, 2019).Figure 4. Mean temperature difference (°C) from Normal observed across the Canadian prairies for the growing season (April 1-July 31, 2019). Image has not been reproduced in affiliation with, or with the endorsement of the Government of Canada and was retrieved (01Aug2019). Access the full map at http://www.agr.gc.ca/DW-GS/current-actuelles.jspx?lang=eng&jsEnabled=true
This past week significant rainfall amounts were reported the parkland region of SK and AB (Fig. 5). Across the prairies, rainfall amounts for the past 30 days have been highly variable (Fig. 6).
Figure 5. Cumulative precipitation observed the past seven days across the Canadian prairies (July 22-28, 2019).Figure 6. Cumulative precipitation observed the past 30 days across the Canadian prairies (June 28-July 28, 2019).
Dryer conditions continue across southern AB and western SK. Growing season (April 1 – July 21, 2019; Fig. 7) rainfall amounts have been below average across southern regions of AB, and across MB (Fig. 8).
Figure 7. Cumulative precipitation observed for the growing season (April 1-July 28, 2019) across the Canadian prairies.Figure 8. Percent of average precipitation observed across the Canadian prairies for the growing season (April 1-July 31, 2019). Image has not been reproduced in affiliation with, or with the endorsement of the Government of Canada and was retrieved (01Aug2019). Access the full map at http://www.agr.gc.ca/DW-GS/current-actuelles.jspx?lang=eng&jsEnabled=true
The growing degree day map (GDD) (Base 5 ºC, April 1-July 21, 2019) is below (Fig. 9):
The growing degree day map (GDD) (Base 10 ºC, April 1-July 21, 2019) is below (Fig. 10):
The lowest temperatures (°C) observed the past seven days ranged from at least 12 down to at least 0 °C in the map below (Fig. 11).
Figure 11. Lowest temperatures (°C) observed across the Canadian prairies the past seven days (to July 31, 2019). Image has not been reproduced in affiliation with, or with the endorsement of the Government of Canada and was retrieved (01Aug2019). Access the full map at http://www.agr.gc.ca/DW-GS/current-actuelles.jspx?lang=eng&jsEnabled=true
The highest temperatures (°C) observed the past seven days ranged from at least 18 up to at least 32 °C in the map below (Fig. 12).
Figure 12. Highest temperatures (°C) observed across the Canadian prairies the past seven days (to July 31, 2019). Image has not been reproduced in affiliation with, or with the endorsement of the Government of Canada and was retrieved (01Aug2019). Access the full map at http://www.agr.gc.ca/DW-GS/current-actuelles.jspx?lang=eng&jsEnabled=true
The maps above are all produced by Agriculture and Agri-Food Canada. Growers can bookmark the AAFC Drought Watch Maps for the growing season.
Weather synopsis – Prairie temperatures continue to be cooler than average. This past week (July 15-21, 2019), temperatures were approximately 1 °C cooler than last week (Fig. 1). The warmest temperatures were observed across MB while temperatures were cooler in western SK and AB.
Figure 1. Average temperature (°C) across the Canadian prairies the past seven days (July 15-21, 2019). Figure 2. Average temperature (°C) across the Canadian prairies the past seven days (June 21-July 21, 2019).
Across the prairies, 30 day (June 21 – July 21, 2019) average temperatures have been approximately 1 °C cooler than normal (Fig. 3). Temperatures were warmest across MB and eastern SK. Growing season temperatures (April 1-July 21, 2019) have been 1 °C cooler than average; the warmest temperatures were observed across the southern prairies.
Figure 3. Average temperature (°C) across the Canadian prairies for the growing season (April 1-July 21, 2019).
This past week significant rainfall amounts were reported the parkland region of SK and AB (Fig. 4).
Figure 4. Cumulative precipitation observed the past seven days across the Canadian prairies (July 15-21, 2019). Figure 5. Cumulative precipitation observed the past 30 days across the Canadian prairies (June 21-July 21, 2019).
Across the prairies, rainfall amounts for the past 30 days have been highly variable (Fig. 7). Dryer conditions continue across southern AB. Rainfall was well above average in SK. Growing season (April 1 – July 21, 2019) rainfall amounts have been below average across southern regions of AB, and across MB.
Figure 6. Cumulative precipitation observed the past 30 days across the Canadian prairies (April 1-July 21, 2019). Figure 7. Percent of average precipitation observed across the Canadian prairies for the growing season (April 1-July 24, 2019). Image has not been reproduced in affiliation with, or with the endorsement of the Government of Canada and was retrieved (25Jul2019). Access the full map at http://www.agr.gc.ca/DW-GS/current-actuelles.jspx?lang=eng&jsEnabled=true
The growing degree day map (GDD) (Base 5 ºC, April 1-July 21, 2019) is below (Fig. 8):
Figure 8. Growing degree day (Base 5 ºC) across the Canadian prairies for the growing season (April 1-July 21, 2019).
The growing degree day map (GDD) (Base 10 ºC, April 1-July 21, 2019) is below (Fig. 9):
Figure 9. Growing degree day (Base 10 ºC) across the Canadian prairies for the growing season (April 1-July 21, 2019).
The lowest temperatures (°C) observed the past seven days ranged from at least 14 down to at least 2 °C in the map below (Fig. 10).
Figure 10. Lowest temperatures (°C) observed across the Canadian prairies the past seven days (to July 21, 2019). Image has not been reproduced in affiliation with, or with the endorsement of the Government of Canada and was retrieved (25Jul2019). Access the full map at http://www.agr.gc.ca/DW-GS/current-actuelles.jspx?lang=eng&jsEnabled=true
The highest temperatures (°C) observed the past seven days ranged from less than 16 up to at least 30 °C in the map below (Fig. 11).
Figure 11. Highest temperatures (°C) observed across the Canadian prairies the past seven days (to July 21, 2019). Image has not been reproduced in affiliation with, or with the endorsement of the Government of Canada and was retrieved (125ul2019). Access the full map at http://www.agr.gc.ca/DW-GS/current-actuelles.jspx?lang=eng&jsEnabled=true
The maps above are all produced by Agriculture and Agri-Food Canada. Growers can bookmark the AAFC Drought Watch Maps for the growing season.
Prairie temperatures continue to be cooler than average. Though temperatures this week were approximately 2 °C warmer than last week (July 8-14, 2019), the seven-day average temperature was 0.5 °C cooler than normal (Fig. 1). The warmest temperatures were observed across MB while temperatures were cooler in western SK and across AB.
Figure 1. Average temperature (°C) across the Canadian prairies the past seven days (July 8-14, 2019).
Across the prairies, 30-day (June 14 – July 14, 2019) average temperatures have been approximately 1 °C cooler than normal (Fig. 2). Average 30-day temperatures were 0 to 2 °C warmer than average across MB and 0 to 2 °C cooler than average in SK and AB. Growing season temperatures (April 1-July 14, 2019) have been 1 °C cooler than average; the warmest temperatures were observed across the southern prairies (Fig. 3).
Figure 2. Average temperature (°C) across the Canadian prairies the past 30 days (June 14-July 14, 2019). Figure 3. Average temperature (°C) across the Canadian prairies for the growing season (April 1-July 14, 2019). Figure 4. Mean temperature difference from Normal (°C) observed across the Canadian prairies the past 30 days (June 18-July 15, 2019). Image has not been reproduced in affiliation with, or with the endorsement of the Government of Canada and was retrieved (18Jul2019). Access the full map at http://www.agr.gc.ca/DW-GS/current-actuelles.jspx?lang=eng&jsEnabled=true
This past week significant rainfall amounts were reported MB and southeastern SK while minimal rainfall was reported across southwestern SK and southern AB (Fig. 5).
Figure 5. Cumulative precipitation observed the past seven days across the Canadian prairies (July 8-14, 2019).
Across the prairies, rainfall amounts for the past 30 days have been highly variable (Fig. 6). Dry conditions continue across much of southern AB. Rainfall was well above average in SK.
Figure 6. Cumulative precipitation observed the past seven days across the Canadian prairies (June 15-July 15, 2019).
Growing season (April 1 – July 14, 2019) rainfall amounts have been below average across southern regions of AB, central SK, and central MB (Fig. 7).
Figure 6. Cumulative precipitation observed over the growing season (April 1-July 15, 2019) across the Canadian prairies. Figure 7. Percent of average precipitation observed across the Canadian prairies for the growing season (April 1-July 17, 2019). Image has not been reproduced in affiliation with, or with the endorsement of the Government of Canada and was retrieved (18Jul2019). Access the full map at http://www.agr.gc.ca/DW-GS/current-actuelles.jspx?lang=eng&jsEnabled=true
Based on modeled soil moisture (Fig. 8), recent rains have improved soil moisture values across a large area of SK and MB. Predicted soil moisture continues to be low across large regions of southern and central areas of AB and western SK.
Figure 8. Modeled soil moisture (%) across the prairies (up to July 15, 2019).
The growing degree day map (GDD) (Base 5 ºC, April 1-July 14, 2019) is below (Fig. 9):
Figure 9. Growing degree day (Base 5 ºC) across the Canadian prairies for the growing season (April 1-July 14, 2019).
The growing degree day map (GDD) (Base 10 ºC, April 1-July 14, 2019) is below (Fig. 10):
Figure 10. Growing degree day (Base 10 ºC) across the Canadian prairies for the growing season (April 1-July 14, 2019).
The lowest temperatures (°C) observed the past seven days ranged from at least 14 down to at least 2 °C in the map below (Fig. 11).
Figure 11. Lowest temperatures (°C) observed across the Canadian prairies the past seven days (to July 17, 2019). Image has not been reproduced in affiliation with, or with the endorsement of the Government of Canada and was retrieved (18Jul2019). Access the full map at http://www.agr.gc.ca/DW-GS/current-actuelles.jspx?lang=eng&jsEnabled=true
The highest temperatures (°C) observed the past seven days ranged from less than 16 up to at least 30 °C in the map below (Fig. 12).
Figure 12. Highest temperatures (°C) observed across the Canadian prairies the past seven days (to July 17, 2019). Image has not been reproduced in affiliation with, or with the endorsement of the Government of Canada and was retrieved (18Jul2019). Access the full map at http://www.agr.gc.ca/DW-GS/current-actuelles.jspx?lang=eng&jsEnabled=true
The maps above are all produced by Agriculture and Agri-Food Canada. Growers can bookmark the AAFC Drought Watch Maps for the growing season.
Prairie temperatures continue to be cooler than average. Temperatures this week were approximately 1 °C cooler than last week (Fig. 1). The warmest temperatures were observed across MB while temperatures were cooler in western SK and across AB.
Figure 1. Average temperature (°C) across the Canadian prairies the past seven days (July 2-July 8, 2019).
Across the prairies, 30-day average temperatures have been approximately 1.5 °C cooler than normal (Fig. 2). Average 30-day temperatures were warmest across southern MB and SK. Cooler temperatures were reported across eastern and northern AB.
Figure 2. Average temperature (°C) across the Canadian prairies the past 30 days (June 8- July 8, 2019).
Growing season temperatures (April 1-July 1, 2019) have been 1 °C cooler than average; the warmest temperatures were observed across the southern prairies (Fig. 3).
Figure 3. Average temperature (°C) across the Canadian prairies for the growing season (April 1-July 8, 2019).
This past week, significant rainfall amounts were reported central AB (Fig. 4). Minimal rainfall was reported across MB and southern AB. Across the prairies, rainfall amounts for the past 30 days have been highly variable (Fig. 5). Dry conditions persisted across much of MB and southern AB. Rainfall was well above average in SK. Growing season rainfall amounts have been below average for most of the prairies, particularly across southern regions of AB and eastern MB (Fig. 6).
Figure 4. Cumulative precipitation observed the past seven days across the Canadian prairies (July 2-8, 2019). Figure 5. Cumulative precipitation observed the past 30 days across the Canadian prairies (June 8-July 8, 2019). Figure 6. Cumulative precipitation observed over the growing season across the Canadian prairies (April 1-July 8, 2019).
Based on modeled soil moisture (Fig. 7), recent rains have improved soil moisture values across a large area of SK. Predicted soil moisture continues to be low across large regions of eastern MB and southern AB.
Figure 7. Modeled soil moisture (%) across the Canadian prairies as of July 8, 2019.
The growing degree day map (GDD) (Base 5 ºC, April 1-July 7, 2019) is below (Fig. 8):
Figure 8. Growing degree day (Base 5 ºC) across the Canadian prairies for the growing season (April 1-July 7, 2019).
The growing degree day map (GDD) (Base 10 ºC, April 1-July 7, 2019) is below (Fig. 9):
Figure 9. Growing degree day (Base 10 ºC) across the Canadian prairies for the growing season (April 1-July 7, 2019).
The lowest temperatures (°C) observed the past seven days ranged from at least 13 to at least 1 °C in the map below (Fig. 10).
Figure 10. Lowest temperatures (°C) observed across the Canadian prairies the past seven days (to July 11, 2019). Image has not been reproduced in affiliation with, or with the endorsement of the Government of Canada and was retrieved (011Jul2019). Access the full map at http://www.agr.gc.ca/DW-GS/current-actuelles.jspx?lang=eng&jsEnabled=true
The highest temperatures (°C) observed the past seven days ranged from less than 15 to at least 30 °C in the map below (Fig. 11).
Figure 11. Highest temperatures (°C) observed across the Canadian prairies the past seven days (to July 11, 2019). Image has not been reproduced in affiliation with, or with the endorsement of the Government of Canada and was retrieved (011Jul2019). Access the full map at http://www.agr.gc.ca/DW-GS/current-actuelles.jspx?lang=eng&jsEnabled=true
The maps above are all produced by Agriculture and Agri-Food Canada. Growers can bookmark the AAFC Drought Watch Maps for the growing season.
Prairie temperatures continue to be cooler than average. Though temperatures this week were approximately 1 °C warmer than last week, temperatures were cooler than normal (Fig. 1). The warmest temperatures were observed across MB while temperatures were cooler in western SK and across AB.
Figure 1. Average temperature (°C) across the Canadian prairies the past seven days (June 24-July 1, 2019).
Across the prairies, 30-day average temperatures were approximately 1 °C cooler than normal (Fig. 2). Average 30-day temperatures were warmest across southern MB and SK. Cooler temperatures were reported across eastern and northern AB. The mean temperature differences from normal (June 1 – 30, 2019) were zero to two degrees Celsius cooler than for AB and western SK while temperatures in eastern SK and MB have been zero to two degrees Celsius warmer than normal (Fig. 3).
Figure 2. Average temperature (°C) across the Canadian prairies the past 30 days (June 2-July 1, 2019). Figure 3. Mean temperature difference from Normal across the Canadian prairies over the past 30 days (June 1-30, 2019). Image has not been reproduced in affiliation with, or with the endorsement of the Government of Canada and was retrieved (04Jul2019). Access the full map at http://www.agr.gc.ca/DW-GS/current-actuelles.jspx?lang=eng&jsEnabled=true
Growing season temperatures (April 1-July 1, 2019) have been warmest across the southern prairies. Across the prairies, the average growing season temperature has been 1.2 °C below normal (Fig. 4).
Figure 4. Average temperature (°C) across the Canadian prairies for the growing season (April 1-July 1 2019).
This past week significant rainfall amounts were reported for southern SK and the Peace River region. Minimal rainfall was reported across MB and southern AB (Fig. 5).
Figure 5. Cumulative precipitation observed the past seven days across the Canadian prairies (June 24-July 1, 2019).
Across the prairies, rainfall amounts for the past 30 days have been near normal (Fig. 6). The Edmonton AB region has been the wettest. Growing season rainfall amounts have been below average for most of the prairies, particularly across southern regions of AB and eastern MB (Fig. 7).
Figure 6. Cumulative precipitation observed the past 30 days across the Canadian prairies (June 2-July 1, 2019). Figure 7. Cumulative precipitation observed for the growing season (April 1-July 1, 2019) across the Canadian prairies.
Based on modelled soil moisture, recent rains have improved soil moisture values across a large area of SK. Predicted soil moisture continues to be low across large regions of eastern MB and southern AB.
Figure 8. Modeled soil moisture (%) across the Canadian prairies as of July 1, 2019.
The growing degree day map (GDD) (Base 5 ºC, April 1-June 24, 2019) is below (Fig. 9):
Figure 9. Growing degree day (Base 5 ºC) across the Canadian prairies for the growing season (April 1-July 1, 2019). Image has not been reproduced in affiliation with, or with the endorsement of the Government of Canada and was retrieved (04Jul2019). Access the full map at http://www.agr.gc.ca/DW-GS/current-actuelles.jspx?lang=eng&jsEnabled=true
The growing degree day map (GDD) (Base 10 ºC, April 1-June 24, 2019) is below (Fig. 10):
Figure 10. Growing degree day (Base 10 ºC) across the Canadian prairies for the growing season (April 1-July 1, 2019). Image has not been reproduced in affiliation with, or with the endorsement of the Government of Canada and was retrieved (04Jul2019). Access the full map at http://www.agr.gc.ca/DW-GS/current-actuelles.jspx?lang=eng&jsEnabled=true
The lowest temperatures (°C) observed the past seven days ranged from at least 13 to at least 0 °C in the map below (Fig. 11).
Figure 11. Lowest temperatures (°C) observed across the Canadian prairies the past seven days (to July 1, 2019). Image has not been reproduced in affiliation with, or with the endorsement of the Government of Canada and was retrieved (04Jul2019). Access the full map at http://www.agr.gc.ca/DW-GS/current-actuelles.jspx?lang=eng&jsEnabled=true
The highest temperatures (°C) observed the past seven days ranged from less than 14 to at least 30 °C in the map below (Fig. 12).
Figure 12. Highest temperatures (°C) observed across the Canadian prairies the past seven days (to July 1, 2019). Image has not been reproduced in affiliation with, or with the endorsement of the Government of Canada and was retrieved (04Jul2019). Access the full map at http://www.agr.gc.ca/DW-GS/current-actuelles.jspx?lang=eng&jsEnabled=true
The maps above are all produced by Agriculture and Agri-Food Canada. Growers can bookmark the AAFC Drought Watch Maps for the growing season.
Temperatures this week, June 11-17 2019, were similar to last week and near normal (Fig. 1). The warmest temperatures were observed across AB while temperatures were cooler in eastern SK and across MB. Average 30-day temperatures were warmest across southern MB and SK from Estevan to Saskatoon and west to Kindersley (Fig. 2). Cooler temperatures were reported across the Parkland region, and western areas in AB (Fig. 2).
Figure 1. Average temperature (°C) across the Canadian prairies the past seven days (June 11-17, 2019). Figure 2. Average temperature (°C) across the Canadian prairies for the month of May (May 19-June 17, 2019).
Seven-day cumulative rainfall indicated that minimal rain was observed across most of the prairies (Fig. 3). Many locations reported less than 10 mm. Higher rainfall amounts were reported for eastern SK and western MB.
Figure 3. Cumulative precipitation observed the past seven days across the Canadian prairies (June 11-17, 2019).
Across the prairies, rainfall amounts for the past 30 days (May 19 – June 17, 2019; Fig. 4) have been approximately 56 % of normal (Fig. 5). Western SK and eastern AB continue to be dry.
Figure 4. Cumulative precipitation observed the past 30 days across the Canadian prairies (May 19-June 17, 2019). Figure 5. Percent of Average precipitation across the Canadian prairies for the past 30 days (to June 17, 2019). Image has not been reproduced in affiliation with, or with the endorsement of the Government of Canada and was retrieved (18Jun2019). Access the full map at http://www.agr.gc.ca/DW-GS/current-actuelles.jspx?lang=eng&jsEnabled=true
Growing season rainfall (April 1 – June 17) amounts have been well below average for most of the prairies, particularly in west central SK and eastern regions of AB (Fig. 6). Almost all of the prairies has had growing season rainfall that is 4 percent, or less, than average. Soil moisture values are low across most of the prairies.
Figure 6. Accumulated precipitation (mm) across the Canadian prairies for the growing season (April 1 to June 17, 2019). Image has not been reproduced in affiliation with, or with the endorsement of the Government of Canada and was retrieved (18Jun2019). Access the full map at http://www.agr.gc.ca/DW-GS/current-actuelles.jspx?lang=eng&jsEnabled=true
The growing degree day map (GDD) (Base 5 ºC, April 1-June 17, 2019) is below (Fig. 7):
Figure 7. Growing degree day (Base 5 ºC) across the Canadian prairies for the growing season (April 1-June 17 2019). Image has not been reproduced in affiliation with, or with the endorsement of the Government of Canada and was retrieved (13Jun2019). Access the full map at http://www.agr.gc.ca/DW-GS/current-actuelles.jspx?lang=eng&jsEnabled=true
The growing degree day map (GDD) (Base 10 ºC, April 1-June 17, 2019) is below (Fig. 8):
Figure 8. Growing degree day (Base 10 ºC) across the Canadian prairies for the growing season (April 1-June 17, 2019). Image has not been reproduced in affiliation with, or with the endorsement of the Government of Canada and was retrieved (18Jun2019). Access the full map at http://www.agr.gc.ca/DW-GS/current-actuelles.jspx?lang=eng&jsEnabled=true
The lowest temperatures (°C) observed the past seven days ranged from about 8 to -2 °C in the map below (Fig. 9).
Figure 9. Lowest temperatures (°C) observed across the Canadian prairies the past seven days (to June 17, 2019). Image has not been reproduced in affiliation with, or with the endorsement of the Government of Canada and was retrieved (18Jun2019). Access the full map at http://www.agr.gc.ca/DW-GS/current-actuelles.jspx?lang=eng&jsEnabled=true
The highest temperatures (°C) observed the past seven days ranged from about 18 to at least 31 °C in the map below (Fig. 10).
Figure 10. Highest temperatures (°C) observed across the Canadian prairies the past seven days (to June 17, 2019). Image has not been reproduced in affiliation with, or with the endorsement of the Government of Canada and was retrieved (18Jun2019). Access the full map at http://www.agr.gc.ca/DW-GS/current-actuelles.jspx?lang=eng&jsEnabled=true
The maps above are all produced by Agriculture and Agri-Food Canada. Growers can bookmark the AAFC Drought Watch Maps for the growing season.
This week there was an issue with the incoming environmental data but it was thankfully detected by David Giffen (AAFC-Saskatoon).
A: TEMPERATURES – Temperatures continued to be cooler than average. This past week temperatures were coolest in AB and warmest in MB (Fig. 1). Average temperatures for May 12 to June 11, 2019, were approximately 1°C cooler than average (Fig. 2).
Figure 1. Average temperature (°C) across the Canadian prairies over the past SEVEN days (June 5-11, 2019). Figure 2. Average temperature (°C) across the Canadian prairies over the past 30 days (May 12-June 11, 2019). Figure 3. Percent of Average precipitation across the Canadian prairies for the growing season (April 1-June 13, 2019). Image has not been reproduced in affiliation with, or with the endorsement of the Government of Canada and was retrieved (14Jun2019). Access the full map at http://www.agr.gc.ca/DW-GS/current-actuelles.jspx?lang=eng&jsEnabled=true
The growing degree day map (GDD) (Base 5 ºC, April 1-June 10, 2019) is below (Fig. 4):
Figure 4. Growing degree day (Base 5 ºC) across the Canadian prairies for the growing season (April 1-June 10, 2019). Image has not been reproduced in affiliation with, or with the endorsement of the Government of Canada and was retrieved (14Jun2019). Access the full map at http://www.agr.gc.ca/DW-GS/current-actuelles.jspx?lang=eng&jsEnabled=true
The growing degree day map (GDD) (Base 10 ºC, April 1-June 10, 2019) is below (Fig. 5):
Figure 5. Growing degree day (Base 10 ºC) across the Canadian prairies for the growing season (April 1-June 10, 2019). Image has not been reproduced in affiliation with, or with the endorsement of the Government of Canada and was retrieved (14Jun2019). Access the full map at http://www.agr.gc.ca/DW-GS/current-actuelles.jspx?lang=eng&jsEnabled=true
The lowest temperatures (°C) observed the past seven days are reflected in the map below (Fig. 6).
Figure 6. Lowest temperatures (°C) observed across the Canadian prairies the past seven days (June 7-13, 2019). Image has not been reproduced in affiliation with, or with the endorsement of the Government of Canada and was retrieved (13Jun2019). Access the full map at http://www.agr.gc.ca/DW-GS/current-actuelles.jspx?lang=eng&jsEnabled=true
The highest temperatures (°C) observed the past seven days are reflected in the map below (Fig. 7).
Figure 7. Highest temperatures (°C) observed across the Canadian prairies the past seven days (June 7-13 2019). Image has not been reproduced in affiliation with, or with the endorsement of the Government of Canada and was retrieved (14Jun2019). Access the full map at http://www.agr.gc.ca/DW-GS/current-actuelles.jspx?lang=eng&jsEnabled=true
B: PRECIPITATION – During the past seven days, rainfall in central regions of AB and southern MB was reported to be greater than 15 mm (Fig. 8). Little or no rain was reported across central areas of SK. Rainfall totals for May 12-June 11 indicated that rainfall amounts were greatest in AB and MB (Fig. 9) while conditions continue to be very dry across most of SK (Fig. 10).
Figure 8. Cumulative precipitation (mm) across the Canadian prairies over the past SEVEN days (June 5-11, 2019). Figure 9. Cumulative precipitation (mm) across the Canadian prairies over the past 30 days (May 12-June 11, 2019).
C: SOIL MOISTURE – Soil moisture values are low across most of the prairies (Fig. 10).
Figure 10. Modeled soil moisture (%) across the Canadian prairies (up to June 11, 2019).
The maps above are all produced by Agriculture and Agri-Food Canada. Growers can bookmark the AAFC Drought Watch Maps for the growing season.
Weather synopsis – The prairie wide average temperature for May was 2 °C cooler than average (Fig. 1) while rainfall was approximately 50% of average (Fig. 2). The coolest conditions have occurred across southern MB and SK.
Figure 1. Average temperature (°C) across the Canadian prairies for the month of May (May 1-31, 2019). Figure 2. Mean temperature differences from Normal across the Canadian prairies from May 1-31, 2019. Image has not been reproduced in affiliation with, or with the endorsement of the Government of Canada and was retrieved (06Jun2019). Access the full map at http://www.agr.gc.ca/DW-GS/current-actuelles.jspx?lang=eng&jsEnabled=true
This week (May 29 – June 4, 2019) weather conditions were warm and dry. Across the prairies, temperatures were 3-4 °C warmer than last week and 1-2 °C warmer than average (Fig. 3). The warmest temperatures were observed across a region that extended from Medicine Hat AB to Saskatoon SK and southwestern MB.
Figure 3. Average temperature (°C) across the Canadian prairies the past seven days (May 29-June 4, 2019).
Average 30-day temperatures were warmest in AB and coolest in eastern SK and MB (Fig. 4). Northern locations within the Peace River region were warmer than average.
Figure 4. Average temperature (°C) across the Canadian prairies the past 30 days (May 5-June 4, 2019).
Seven day cumulative rainfall indicated that minimal rain was observed across most of the prairies (Fig. 5). Most locations reported less than 5 mm. Higher rainfall amounts were reported in southwestern AB, southeastern SK and an area near Dauphin MB.
Figure 5. Cumulative precipitation observed the past seven days across the Canadian prairies (May 29-June 4, 2019).
Across the prairies, rainfall amounts for the past 30 days (May 5 – June 4, 2019) were approximately 48 % of normal (Fig. 7 and 8). Most of the prairies reported rainfall amounts less than 40 % of normal.
Figure 6. Cumulative precipitation observed the past 30 days across the Canadian prairies (May 5-June 4, 2019).
Growing season rainfall (April 1 – June 4) amounts have been well below average for most of the prairies, particularly in west central SK and eastern regions of AB (Fig. 7). Almost all of the prairies has had growing season rainfall that is 85 percent, or less, than average.
Figure 7. Cumulative precipitation observed for the growing season across the Canadian prairies (April 1-June 4, 2019). Figure 8. Percent of Average precipitation across the Canadian prairies for the growing season (April 1-June 5, 2019). Image has not been reproduced in affiliation with, or with the endorsement of the Government of Canada and was retrieved (06Jun2019). Access the full map at http://www.agr.gc.ca/DW-GS/current-actuelles.jspx?lang=eng&jsEnabled=true
Soil moisture values are low across most of the prairies (Fig. 9).
Figure 9. Modeled soil moisture (%) across the Canadian prairies (up to June 4, 2019).
The growing degree day map (GDD) (Base 5 ºC, April 1-June 3, 2019) is below (Fig. 10):
Figure 10. Growing degree day (Base 5 ºC) across the Canadian prairies for the growing season (April 1-June 3, 2019). Image has not been reproduced in affiliation with, or with the endorsement of the Government of Canada and was retrieved (06Jun2019). Access the full map at http://www.agr.gc.ca/DW-GS/current-actuelles.jspx?lang=eng&jsEnabled=true
The growing degree day map (GDD) (Base 10 ºC, April 1-June 3, 2019) is below (Fig. 11):
Figure 11. Growing degree day (Base 10 ºC) across the Canadian prairies for the growing season (April 1-June 3, 2019). Image has not been reproduced in affiliation with, or with the endorsement of the Government of Canada and was retrieved (06Jun2019). Access the full map at http://www.agr.gc.ca/DW-GS/current-actuelles.jspx?lang=eng&jsEnabled=true
The lowest temperatures (°C) observed the past seven days ranged from 6 to at least -5 °C in the map below (Fig. 12).
Figure 12. Lowest temperatures (°C) observed across the Canadian prairies the past seven days (May 30-June 5, 2019). Image has not been reproduced in affiliation with, or with the endorsement of the Government of Canada and was retrieved (06Jun2019). Access the full map at http://www.agr.gc.ca/DW-GS/current-actuelles.jspx?lang=eng&jsEnabled=true
The highest temperatures (°C) observed the past seven days ranged from 14 to at least 32 °C in the map below (Fig. 14).
Figure 14. Highest temperatures (°C) observed across the Canadian prairies the past seven days (May 30-June 5, 2019). Image has not been reproduced in affiliation with, or with the endorsement of the Government of Canada and was retrieved (06Jun2019). Access the full map at http://www.agr.gc.ca/DW-GS/current-actuelles.jspx?lang=eng&jsEnabled=true
The maps above are all produced by Agriculture and Agri-Food Canada. Growers can bookmark the AAFC Drought Watch Maps for the growing season.
Weather synopsis – This week (May 21-28, 2019) cool, dry conditions continued to occur across the prairies. Though temperatures are warming up, early growing season daily average temperatures continue to be cooler than normal.
Throughout this past week, the average temperature was approximately 1 °C cooler than normal (Fig. 1). Compared to last week, the prairie-wide average daily temperature was 3 °C warmer. The warmest temperatures were observed across the Parkland region of the prairies.
Figure 1. Average temperature (°C) across the Canadian prairies the past seven days (May 22-28, 2019).
The average 30-day temperatures were approximately 3 °C cooler than average (Fig. 2).
Figure 2. Average temperature (°C) across the Canadian prairies the past 30 days (April 28-May 28, 2019).
Seven-day cumulative rainfall (Fig. 3) indicated that minimal rain was observed across large areas of SK. Most locations reported less than 5 mm. Wetter conditions were reported in a corridor between Lethbridge and Calgary AB. Most of MB and southeast SK had rainfall amounts that were greater than 10 mm (Fig. 3).
Figure 3. Cumulative precipitation observed the past seven days across the Canadian prairies (May 22-28, 2019). Figure 4. Mean temperature differences from Normal across the Canadian prairies from April 30-May 27, 2019. Image has not been reproduced in affiliation with, or with the endorsement of the Government of Canada and was retrieved (30May2019). Access the full map at http://www.agr.gc.ca/DW-GS/current-actuelles.jspx?lang=eng&jsEnabled=true
Across the prairies, rainfall amounts for the past 30 days (April 28-May 28, 2019) have been approximately 50% of normal (Fig. 6). The 30-day rainfall totals have improved in MB and southwest SK.
Figure 5. Cumulative precipitation observed the past 30 days across the Canadian prairies (April 28-May 28, 2019).
Growing season rainfall (April 1 – May 28) amounts have been well below average for most of the prairies, particularly in west central SK and eastern regions of AB (Fig. 6).
Figure 6. Cumulative precipitation observed for the growing season across the Canadian prairies (April 1-May 28, 2019).
Almost all of the prairies has had growing season rainfall amounting to 85 %, or less, than average.
Figure 6. Percent of Average precipitation across the Canadian prairies for the growing season (April 1-May 28, 2019). Image has not been reproduced in affiliation with, or with the endorsement of the Government of Canada and was retrieved (30May2019). Access the full map at http://www.agr.gc.ca/DW-GS/current-actuelles.jspx?lang=eng&jsEnabled=true
Soil moisture values are low across most of the prairies.
Figure 7. Modeled soil moisture (%) across the Canadian prairies (up to May 28, 2019).
The two week forecast is not predicting significant rainfall for the prairies. The Agroclimate National Risk Report for May 7 to May 22, 2019 reports that there is less than a 30% chance of rainfall amounting to >25 mm (May 29-June 4, 2019). The report states that “No rain is expected in the week ahead in areas currently experiencing drought conditions such as southwestern Saskatchewan”.
The growing degree day map (GDD) (Base 5 ºC, April 1-May 27, 2019) is below (Fig. 9):
Figure 9. Growing degree day (Base 5 ºC) across the Canadian prairies for the growing season (April 1-May 27, 2019). Image has not been reproduced in affiliation with, or with the endorsement of the Government of Canada and was retrieved (30May2019). Access the full map at http://www.agr.gc.ca/DW-GS/current-actuelles.jspx?lang=eng&jsEnabled=true
The growing degree day map (GDD) (Base 10 ºC, April 1-May 15, 2019) is below (Fig. 10):
Figure 10. Growing degree day (Base 10 ºC) across the Canadian prairies for the growing season (April 1-May 27, 2019). Image has not been reproduced in affiliation with, or with the endorsement of the Government of Canada and was retrieved (30May2019). Access the full map at http://www.agr.gc.ca/DW-GS/current-actuelles.jspx?lang=eng&jsEnabled=true
The lowest temperatures (°C) observed the past seven days range from -6 to 6 °C in the map below (Fig. 11).
Figure 11. Lowest temperatures (°C) observed across the Canadian prairies the past seven days (May 23-29, 2019). Image has not been reproduced in affiliation with, or with the endorsement of the Government of Canada and was retrieved (30May2019). Access the full map at http://www.agr.gc.ca/DW-GS/current-actuelles.jspx?lang=eng&jsEnabled=true
The highest temperatures (°C) observed the past seven days range from 14 to at least 32 °C in the map below (Fig. 12).
Figure 12. Highest temperatures (°C) observed across the Canadian prairies the past seven days (May 23-29, 2019). Image has not been reproduced in affiliation with, or with the endorsement of the Government of Canada and was retrieved (30May2019). Access the full map at http://www.agr.gc.ca/DW-GS/current-actuelles.jspx?lang=eng&jsEnabled=true
The maps above are all produced by Agriculture and Agri-Food Canada. Growers can bookmark the AAFC Drought Watch Maps for the growing season.
Weather synopsis – This past week (May 8-15, 2019) the average temperature was approximately 1 °C cooler than normal (Fig. 1). The warmest temperatures were observed in AB and with conditions much cooler in SK and MB.
This week, May 15-21, 2019, cool, dry conditions continued to occur across the prairies. Though temperatures are warming up, early growing season daily average temperatures continue to be cooler than normal. This past week the average temperature was approximately 2.5 °C cooler than normal (Fig. 2). The warmest temperatures were observed in central AB, southeast SK and southwest MB (Fig. 2).
Figure 1. Average Temperature (°C) across the Canadian prairies the past seven days (May 15-21, 2019). Figure 2. Average Temperature (°C) across the Canadian prairies the past 30 days (April 21-May 21, 2019).
Average 30 day temperatures were approximately 3 °C cooler than average (Fig. 3). Across the prairies, average temperatures (April 23 – May 20, 2019) were 2 to -3 °C below normal with central SK having temperatures that were 3 to 4 °C cooler than average with well below average temperatures occurring in a large area of central SK.
Figure 3. Mean temperature differences from Normal across the Canadian prairies from April 23-May 20, 2019. Image has not been reproduced in affiliation with, or with the endorsement of the Government of Canada and was retrieved (21May2019). Access the full map at http://www.agr.gc.ca/DW-GS/current-actuelles.jspx?lang=eng&jsEnabled=true
This week (May 15-21, 2019), the seven-day cumulative rainfall indicated that minimal rain was observed across large areas of SK (Fig. 4). Most locations reported less than 5 mm. Wetter conditions were reported in a corridor between Lethbridge and Calgary AB.
Figure 4. Cumulative precipitation observed the past seven days across the Canadian prairies (May 15-21, 2019).
Across the prairies, rainfall amounts for the past 30 days (April 21-May 21, 2019) have been approximately 50% of normal (Fig. 5). Rainfall in southwest SK has increased. Between Brandon MB and Lloydminster SK 30-day rainfall amounts are well below average (Fig. 5). Growing season rainfall (April 1 – May 21) amounts have been well below average for most of the prairies, particularly in west central SK and eastern regions of AB (Fig. 6). For this growing season, almost all of the prairies have received rainfall that is 85 percent or less than average (Fig. 7).
Figure 5. Cumulative precipitation observed the past 30 days across the Canadian prairies (April 21-May 21, 2019). Figure 6. Cumulative precipitation observed for the growing season across the Canadian prairies (April 1-May 21, 2019). Figure 7. Percent of Average precipitation across the Canadian prairies for the growing season (April 1-May 21, 2019). Image has not been reproduced in affiliation with, or with the endorsement of the Government of Canada and was retrieved (21May2019). Access the full map at http://www.agr.gc.ca/DW-GS/current-actuelles.jspx?lang=eng&jsEnabled=true
Soil moisture values are low across most of the prairies. Near normal soil moisture is predicted to occur in an area extending from Swift Current, west to Lethbridge and north to Edmonton and Grande Prairie (Fig. 8).
Figure 8. Modeled soil moisture (%) across the Canadian prairies (up to May 21, 2019).
The growing degree day map (GDD) (Base 5 ºC, April 1-May 20, 2019) is below (Fig. 9):
Figure 9. Growing degree day (Base 5 ºC) across the Canadian prairies for the growing season (April 1-May 20, 2019). Image has not been reproduced in affiliation with, or with the endorsement of the Government of Canada and was retrieved (22May2019). Access the full map at http://www.agr.gc.ca/DW-GS/current-actuelles.jspx?lang=eng&jsEnabled=true
The growing degree day map (GDD) (Base 10 ºC, April 1-May 15, 2019) is below (Fig. 10):
Figure 10. Growing degree day (Base 10 ºC) across the Canadian prairies for the growing season (April 1-May 20, 2019). Image has not been reproduced in affiliation with, or with the endorsement of the Government of Canada and was retrieved (22May2019). Access the full map at http://www.agr.gc.ca/DW-GS/current-actuelles.jspx?lang=eng&jsEnabled=true
The lowest temperatures (°C) observed the past seven days range from -10 to 2 °C in the map below (Fig. 11).
Figure 11. Lowest temperatures (°C) observed across the Canadian prairies the past seven days (May 14-20, 2019). Image has not been reproduced in affiliation with, or with the endorsement of the Government of Canada and was retrieved (22May2019). Access the full map at http://www.agr.gc.ca/DW-GS/current-actuelles.jspx?lang=eng&jsEnabled=true
The highest temperatures (°C) observed the past seven days range from -10 to 2 °C in the map below (Fig. 12).
Figure 12. Highest temperatures (°C) observed across the Canadian prairies the past seven days (May 14-20, 2019).Image has not been reproduced in affiliation with, or with the endorsement of the Government of Canada and was retrieved (22May2019). Access the full map at http://www.agr.gc.ca/DW-GS/current-actuelles.jspx?lang=eng&jsEnabled=true
The maps above are all produced by Agriculture and Agri-Food Canada. Growers may wish to bookmark the AAFC Drought Watch Maps for the growing season.
Weather synopsis – This past week (May 8-15, 2019) the average temperature was approximately 1 °C cooler than normal (Fig. 1). The warmest temperatures were observed in AB and with conditions much cooler in SK and MB.
Figure 1. Average Temperature (°C) across the Canadian prairies the past seven days (May 8-15, 2019).
Average 30-day temperatures were approximately 2 °C cooler than average (Fig. 2). Across the prairies, average temperatures (April 9-May 6) were 0 to -3 °C below normal (Fig. 3).
Figure 2. Mean temperature differences from Normal across the Canadian prairies from April 16-May 13, 2019. Image has not been reproduced in affiliation with, or with the endorsement of the Government of Canada and was retrieved (16May2019). Access the full map at http://www.agr.gc.ca/DW-GS/current-actuelles.jspx?lang=eng&jsEnabled=true Figure 3. Average Temperature (°C) across the Canadian prairies the past 30 days (April 15- May 15, 2019).
Seven-day cumulative rainfall indicated that minimal rain was observed across large areas in AB and MB. Most locations reported less than 5mm (Fig. 4).
Figure 4. Cumulative precipitation observed the past seven days across the Canadian prairies (May 8-15, 2019).
Across the prairies, rainfall amounts for the past 30 days (April 15-May 15, 2019) have been approximately 50% of normal (Fig. 5). Growing season rainfall amounts have been well below average for most of the prairies. Only two areas, southern SK and the Peace River region were the only two areas that had normal to above normal rainfall (Fig. 6).
Figure 5. Percent of Average precipitation across the Canadian prairies the past 30 days (Up to May 15, 2019). Image has not been reproduced in affiliation with, or with the endorsement of the Government of Canada and was retrieved (16May2019). Access the full map at http://www.agr.gc.ca/DW-GS/current-actuelles.jspx?lang=eng&jsEnabled=true Figure 6. Cumulative precipitation observed the past 30 days across the Canadian prairies (April 15-May 15, 2019).
Soil moisture values are low across most of the prairies (Fig. 7).
Figure 7. Modeled soil moisture (%) across the Canadian prairies (up to May 15, 2019).
The growing degree day map (GDD) (Base 5 ºC, April 1-May 15, 2019) is below (Fig. 8):
Figure 8. Growing degree day (Base 5 ºC) across the Canadian prairies for the growing season (April 1-May 15, 2019). Image has not been reproduced in affiliation with, or with the endorsement of the Government of Canada and was retrieved (16May2019). Access the full map at http://www.agr.gc.ca/DW-GS/current-actuelles.jspx?lang=eng&jsEnabled=true
The growing degree day map (GDD) (Base 10 ºC, April 1-May 15, 2019) is below (Fig. 9):
Figure 9. Growing degree day (Base 10 ºC) across the Canadian prairies for the growing season (April 1-May 15, 2019). Image has not been reproduced in affiliation with, or with the endorsement of the Government of Canada and was retrieved (16May2019). Access the full map at http://www.agr.gc.ca/DW-GS/current-actuelles.jspx?lang=eng&jsEnabled=true
The lowest temperatures (°C) observed the past seven days range from -10 to 2 °C in the map below (Fig. 10).
Figure 10. Lowest temperatures (°C) observed across the Canadian prairies the past seven days (May 8-15, 2019). Image has not been reproduced in affiliation with, or with the endorsement of the Government of Canada and was retrieved (16May2019). Access the full map at http://www.agr.gc.ca/DW-GS/current-actuelles.jspx?lang=eng&jsEnabled=true
The maps above are all produced by Agriculture and Agri-Food Canada. Growers may wish to bookmark the AAFC Drought Watch Maps for the growing season.
Remember – If your fields are near one of Environment Canada’s PRAIRIE Radar Stations, consider accessing weather radar maps in video format to access either the past 1 OR 3 hours of precipitation events displayed as spatio-temporal maps. These maps can help growers review where and how much precipitation fell nearby and can help when trying to time pesticide applications.
Screen shots of Environment Canada’s webpages are below for reference and red text and arrows have been added to help you navigate the webpage.
Weather synopsis – Daily average temperatures continue to be cooler than normal for the early growing season. This past week (April 30-May 7, 2019), the average temperature (0.5 °C) was approximately 6 °C cooler than normal (Fig. 1). The warmest temperatures were observed in southern AB and southeastern SK (Fig. 1). Average 30-day temperatures were well below normal (Fig. 3). Across the prairies, average temperatures (April 9-May 6) was 0 to -3 °C below normal (Fig. 2).
Figure 1. Average Temperature (°C) across the Canadian prairies the past seven days (April 30-May 7, 2019). Figure 2. Average Temperature (°C) across the Canadian prairies the past 30 days (April 7-May 7, 2019). Figure 3. Mean temperature differences from Normal across the Canadian prairies from April 9-May 6, 2019. Image has not been reproduced in affiliation with, or with the endorsement of the Government of Canada and was retrieved (09May2019). Access the full map at http://www.agr.gc.ca/DW-GS/current-actuelles.jspx?lang=eng&jsEnabled=true
Seven day cumulative rainfall shows that minimal rain was observed across large areas in MB and SK (Fig. 4). Rainfall (30 day accumulation) amounts (Fig. 5) have been well below average for most of the prairies (66% of average) (Fig. 6). Rainfall amounts across southern SK are normal to above normal (Fig. 6).
Figure 4. Cumulative precipitation observed the past seven days across the Canadian prairies (April 30-May 7, 2019). Figure 5. Cumulative precipitation observed the past 30 days across the Canadian prairies (April 7-May 7, 2019). Figure 6. Percent of average precipitation across the Canadian prairies the past 30 days (as of May 8, 2019). Image has not been reproduced in affiliation with, or with the endorsement of the Government of Canada and was retrieved (09May2019). Access the full map at http://www.agr.gc.ca/DW-GS/current-actuelles.jspx?lang=eng&jsEnabled=true
Soil moisture values are low across large generally low.
Figure 7. Modelled soil moisture (%) across the Canadian prairies as of May 7, 2019.
The growing degree day map (GDD) (Base 5 ºC, March 1 – June 18, 2017) is below:
Figure 8. Growing degree day (Base 5 ºC) across the Canadian prairies for the growing season (April 1-May 6, 2019). Image has not been reproduced in affiliation with, or with the endorsement of the Government of Canada and was retrieved (09May2019). Access the full map at http://www.agr.gc.ca/DW-GS/current-actuelles.jspx?lang=eng&jsEnabled=true
The growing degree day map (GDD) (Base 10 ºC, March 1 – June 18, 2017) is below:
Figure 9. Growing degree day (Base 10 ºC) across the Canadian prairies for the growing season (April 1-May 6, 2019). Image has not been reproduced in affiliation with, or with the endorsement of the Government of Canada and was retrieved (09May2019). Access the full map at http://www.agr.gc.ca/DW-GS/current-actuelles.jspx?lang=eng&jsEnabled=true
Weather synopsis – Temperatures (30 day average) continue to be warmest in southern AB and western SK (Fig. 1). Across the prairies, the monthly average temperature was slightly cooler than normal.
Figure 1. Average temperatures across the Canadian prairies (°C) from March 31-April 30, 2019.
Rainfall (30 day accumulation) amounts have been well below average for most of the prairies (Figs. 2 and 3). Rainfall amounts (30 day) across southern SK are normal to above normal.
Figure 2. Accumulated 30 day cumulative rainfall (mm) across the Canadian prairies from March 31-April 30, 2019. Figure 3. Percent of average precipitation across the Canadian prairies from March 31-April 30, 2019. Image has not been reproduced in affiliation with, or with the endorsement of the Government of Canada and was retrieved (01May2019). Access the full map at http://www.agr.gc.ca/DW-GS/current-actuelles.jspx?lang=eng&jsEnabled=true
On March 27 and 28 significant snowfall amounts were reported for a number of locations across AB and southern SK (Table 1; Fig. 4). This has resulted in improved soil moisture amounts for the southern SK (Fig. 5).
Figure 4. Observed 7-day cumulative rain (mm) across the Canadian prairies (April 23-30, 2019). Figure 5. Modeled soil moisture (%) across the Canadian prairies (as of April 30, 2019).
Weather synopsis – Temperatures (30 day average) have been warmest in southern AB and western SK.
Rainfall (30 day accumulation) amounts have been well below average for most of the prairies.
Percent of normal precipitation for the past 30 days (as of April 23, 2019) across the Canadian prairies. Image has not been reproduced in affiliation with, or with the endorsement of the Government of Canada and was retrieved (24Apr2019). Access the full map at http://www.agr.gc.ca/DW-GS/current-actuelles.jspx?lang=eng&jsEnabled=true
The soil moisture model indicates that soil moisture levels are low across most of southern and central AB and western SK.
Weather synopsis – We close out the Weekly Update for the growing season by looking back at precipitation thanks to the AAFC Drought Watch folks.
This is a map of growing season precipitation (% of normal; Fig. 1):
Figure 1. Percent of normal precipitation for the growing season (April 1-August 22, 2018) across the Canadian prairies. Image has not been reproduced in affiliation with, or with the endorsement of the Government of Canada and was retrieved (23Aug2018). Access the full map at http://www.agr.gc.ca/DW-GS/current-actuelles.jspx?lang=eng&jsEnabled=true
The following map illustrates precipitation (% of normal) for the last 60 days (Fig. 2):
Figure 2. Percent of normal precipitation the past 60 days (as of August 22, 2018) across the Canadian prairies. Image has not been reproduced in affiliation with, or with the endorsement of the Government of Canada and was retrieved (23Aug2018). Access the full map at http://www.agr.gc.ca/DW-GS/current-actuelles.jspx?lang=eng&jsEnabled=true
Whereas this is the precipitation (% of normal) for the past 30 days (Fig. 3):
Figure 3. Percent of normal precipitation the past 30 days (as of August 22, 2018) across the Canadian prairies. Image has not been reproduced in affiliation with, or with the endorsement of the Government of Canada and was retrieved (23Aug2018). Access the full map at http://www.agr.gc.ca/DW-GS/current-actuelles.jspx?lang=eng&jsEnabled=true
Here is the accumulated precipitation the past 7 days (Fig. 4)!
Figure 4. Accumulated precipitation the past 7 days (as of August 22, 2018) across the Canadian prairies. Image has not been reproduced in affiliation with, or with the endorsement of the Government of Canada and was retrieved (23Aug2018). Access the full map at http://www.agr.gc.ca/DW-GS/current-actuelles.jspx?lang=eng&jsEnabled=true
The map below reflects the Highest Temperatures occurring over the past 7 days (August 16-22, 2018) across the prairies and is available from Agriculture and Agri-Food Canada (Fig. 5).
Figure 5. Highest temperature across the Canadian prairies the past seven days (August 16-22, 2018). Image has not been reproduced in affiliation with, or with the endorsement of the Government of Canada and was retrieved (23Aug2018). Access the full map at http://www.agr.gc.ca/DW-GS/current-actuelles.jspx?lang=eng&jsEnabled=true
The map below reflects the Highest Temperatures occurring over the past 7 days (August 16-22, 2018) across the prairies and is available from Agriculture and Agri-Food Canada (Fig. 6).
Figure 6. Lowest temperature across the Canadian prairies the past seven days (August 16-22, 2018). Image has not been reproduced in affiliation with, or with the endorsement of the Government of Canada and was retrieved (23Aug2018). Access the full map at http://www.agr.gc.ca/DW-GS/current-actuelles.jspx?lang=eng&jsEnabled=true
Normally we share growing degree day maps calculated for the growing season including March 1, 2018, to the present. This week we instead reference the AAFC Drought Watch maps. Below is the growing degree day map (GDD: Base 10ºC for APRIL 1 – August 20, 2018) and is available from Agriculture and Agri-Food Canada (Fig. 7):
Figure 7. Growing degree-day using base 10ºC for across the Canadian prairies for the growing season (APRIL 1-August 20, 2018). Image has not been reproduced in affiliation with, or with the endorsement of the Government of Canada and was retrieved (23Aug2018). Access the full map at http://www.agr.gc.ca/DW-GS/current-actuelles.jspx?lang=eng&jsEnabled=true
Below is the growing degree day map (GDD: Base 5ºC for APRIL 1 – August 20, 2018) and is available from Agriculture and Agri-Food Canada (Fig. 8):
Figure 8. Growing degree-day using base 5ºC for across the Canadian prairies for the growing season (APRIL 1-August 20, 2018). Image has not been reproduced in affiliation with, or with the endorsement of the Government of Canada and was retrieved (23Aug2018). Access the full map at http://www.agr.gc.ca/DW-GS/current-actuelles.jspx?lang=eng&jsEnabled=true
The maps above are all produced by Agriculture and Agri-Food Canada. Growers can bookmark the AAFC Drought Watch Maps to continue to follow weather conditions during harvest and beyond.
Weather synopsis – This week, weather data is unavailable due to technical difficulties so we are unable to generate several maps. Please check webpages posted by Environment Canada for weather-related information.
Weather synopsis – This past week (July 23 – 30, 2018) the average temperature (14.8 °C) was marginally cooler than long term average values (Fig. 1). The warmest weekly temperatures occurred across southern and central Alberta and eastern Manitoba. The 30-day (June 30 – July 30) average temperature (15.7 °C) was similar to the long term average (Fig. 2).
Figure 1. Weekly (July 23 – 30, 2018) average temperature (°C).Figure 2. The 30-day (June 30 – July 30, 2018) average temperature (°C).
Weekly total precipitation was below average and 30-day total precipitation was marginally above average (Figs. 3 and 4). The wettest region (30-day cumulative precipitation) was across eastern areas in Saskatchewan and southern Manitoba while central Saskatchewan and most of Alberta continue to be dry. Growing season precipitation is below average across large areas of Alberta, Saskatchewan and Manitoba. Average precipitation has been reported across the Peace River region, eastern Saskatchewan, and the Parkland region.
The map below reflects the Highest Temperatures occurring over the past 7 days (July 24-30, 2018) across the prairies and is available from Agriculture and Agri-Food Canada (Fig. 4).
The map below reflects the Highest Temperatures occurring over the past 7 days (July 24-30, 2018) across the prairies and is available from Agriculture and Agri-Food Canada (Fig. 5).
Weather synopsis – This past week (July 16 – 23, 2018) the average temperature (16.3 °C) was marginally warmer than long term average values (Fig. 1). The warmest weekly temperatures occurred across east-central AB and west-central/southern SK. The 30-day (June 23 – July 23) average temperature (15.8 °C) was similar to the long term average.
Figure 1. Weekly (July 16-23, 2018) average temperature (°C).
Weekly and 30-day total precipitation was above average (Figs. 2 and 3). The wettest region (30 day cumulative precipitation) was across eastern areas in SK and southern MB while central SK and most of AB continue to be dry.
The map below reflects the Highest Temperatures occurring over the past 7 days (July 17-23, 2018) across the prairies and is available from Agriculture and Agri-Food Canada (Fig. 4).
The map below reflects the Highest Temperatures occurring over the past 7 days (July 17-23, 2018) across the prairies and is available from Agriculture and Agri-Food Canada (Fig. 5).
Weather synopsis – This past week (July 9 – 16, 2018), the average temperature (16.7 °C) was almost 2 °C warmer than last week and marginally warmer than long term average values (Fig. 1). Once again, the warmest weekly temperatures occurred across MB. The 30-day (June 16 – July 16, 2018) average temperature (15.8 °C) was just slightly above long term average temperatures.
Figure 1. Weekly (July 9 – 16, 2018) average temperature (°C) .
Weekly and 30-day total precipitation was less than average (Figs. 2 and 3). The wettest region (30-day cumulative precipitation) was across eastern areas in Saskatchewan and southern Manitoba while western Saskatchewan and most of Alberta continue to be dry.
The map below reflects the Highest Temperatures occurring over the past 7 days (July 11-17, 2018) across the prairies and is available from Agriculture and Agri-Food Canada (Fig. 4).
The map below reflects the Lowest Temperatures occurring over the past 7 days (July 11-17, 2018) across the prairies and is available from Agriculture and Agri-Food Canada (Fig. 5).
Weather synopsis – This week staff were again surveying so we direct you to the AAFC Drought Watch maps in addition to the following updates.
This past week (July 2 – 9, 2018), temperatures across the prairies were warmer than long term average values (Fig. 1). The warmest weekly temperatures continue to occur across Manitoba. Compared to last week, daily average temperatures were warmer across southern Alberta and Saskatchewan. The 30-day (June 9 – July 9, 2018) average temperature was similar to the long term average.
Figure 1. Weekly (July 2 – 9, 2018) average temperature (°C).
Weekly and 30-day total precipitation was slightly above average (Figs. 2 and 3). Weekly accumulations were generally less than 20 mm with a few areas (northeast Saskatchewan, northwest Manitoba and the south of the Peace River region) reporting greater than 40 mm. The wettest (30-day) regions were across eastern areas in Saskatchewan, and isolated areas in southern Manitoba and the south of the Peace River region. A large region across Saskatchewan and Alberta continues to be dry.
Weather synopsis – This week staff have been busy surveying so we direct you to the AAFC Drought Watch maps in addition to the following updates.
The average temperature (14.6 °C) this past week (June 25 – July 2, 2018) was almost 2 °C warmer than long term average values (Fig. 1).
Figure 1. Average temperature the past seven days (June 25-July 2, 2018).
Once again, the warmest weekly temperatures occurred across MB. The 30-day (June 2-July 2) average temperature (14.3 °C) was approximately 0.5 °C warmer than long term average (Fig. 2). Average June temperatures were above normal across the entire prairie region (Fig. 3).
Figure 2. Average temperature the past 30 days (June 2-July 2, 2018).Figure 3. Monthly mean temperature differences from Normal for the month of June 2018. Image has not been reproduced in affiliation with, or with the endorsement of the Government of Canada and was retrieved (03Jul2018). Access the full map at http://www.agr.gc.ca/DW-GS/current-actuelles.jspx?lang=eng&jsEnabled=true&reset=1529635048320).
Weekly and 30-day total precipitation was slightly above average (Figs. 4 and 5). The wettest (30-day) region was across eastern areas in SK and southern MB, while western SK and most of AB continue to be dry.
Figure 4. Cumulative precipitation the past seven days (June 25-July 2, 2018).Figure 5. Cumulative precipitation the past 30 days (June 2-July 2, 2018).
The growing degree day map (GDD) (Base 10ºC, March 1 – July 2, 2018) is below:
The growing degree day map (GDD) (Base 5ºC, March 1 – July 2, 2018) is below:
The maps above are all produced by Agriculture and Agri-Food Canada. Growers may wish to bookmark the AAFC Drought Watch Maps for the growing season.
The map below reflects the Highest Temperatures occurring over the past 7 days (June 27, 2018) across the prairies and is available from Agriculture and Agri-Food Canada (Fig. 3).
The map below reflects the Lowest Temperatures occurring over the past 7 days (June 21-27, 2018) across the prairies and is available from Agriculture and Agri-Food Canada (Fig. 4).
Weather synopsis – This past week (June 11 – 18, 2018), the average temperature (12.4 °C) was 1 °C cooler than long term average values (Fig. 1). The warmest weekly temperatures occurred across Manitoba. The 30-day (May 19-June 18, 2018) average temperature (13.1 °C) was approximately 1 °C warmer than long term average (Fig. 2).
Figure 1. Weekly (June 11 – 18, 2018) average temperature (°C) . Figure 2. The 30-day (May 19 – June 18, 2018) average temperature (°C).
Weekly and 30-day total precipitation was above average (Figs. 3 and 4). The wettest (30-day) region was across eastern areas in SK and western MB, while western Saskatchewan and most of Alberta are dry.
The map below reflects the Highest Temperatures occurring over the past 7 days (June 5-11, 2018) across the prairies and is available from Agriculture and Agri-Food Canada (Fig. 6).
The map below reflects the Lowest Temperatures occurring over the past 7 days (June 5-11, 2018) across the prairies and is available from Agriculture and Agri-Food Canada (Fig. 7).
Weather synopsis – This past week (June 4 – 11, 2018), the average temperature (13.3 °C) was very similar to long term average (Fig. 1). The warmest weekly temperatures occurred across MB. The 30-day (May 12 – June 11) average temperature (12.9 °C) was approximately 2 °C warmer than long term average (Fig. 2).
Figure 1. Weekly (June 4 – 11, 2018) average temperature (°C) . Figure 2. The 30-day (May 12 – June 11, 2018) average temperature (°C).
Weekly and 30-day total precipitation was above average. The wettest region was across eastern areas in SK (Figs. 3 and 4).
Background: Agriculture and Agri-Food Canada (AAFC) and Environment and Climate Change Canada (ECCC) have been working together to study the potential of trajectories to deliver an early-warning system for the origin and destination of migratory invasive agricultural pests.
We receive two types of model output from ECCC: reverse trajectories (RT) and forward trajectories (FT):
(i) ‘Reverse trajectories’ (RT) refer to air currents that are tracked back in time from specified Canadian locations over a five-day period prior to their arrival date.
(ii) ‘Forward trajectories’ (FT) have a similar purpose; however, the modelling process begins at sites in USA and Mexico. The model output predicts the pathway of a trajectory. Again, of interest are the winds that eventually end up passing over the Prairies.
Current Data
Since April 1. 2018, the majority of Pacific Northwest (PNW) air currents have crossed over southern AB (Fig. 1). The cumulative number of wind dispersal events for June 1 – 11, 2018 (181) is greater than the long term (2007 – 2017) average (98).
Figure 1. Total reverse trajectories (originating from US – PNW) April 1 – June 11, 2018.
Since April 1, the majority of air currents from southwest USA and Mexico have crossed over eastern SK and western MB (Fig. 2). So far there have been 18 RT’s (June 1 – 11, 2018) and compares with 2017 (3) and the long term average (24).
Figure 2. Total number of reverse trajectories (originating from southern USA) April 1 – June 11, 2018.
Weather synopsis – This past week (May 28-June 4, 2018), the average temperature was very similar to the long term normal (Fig. 1). The warmest weekly temperatures occurred across Manitoba. The 30-day average temperature (April 29 – May 29) was approximately 2 °C warmer than long term average (Fig. 2). Across the prairies, the average temperature for May was up to 5 °C warmer than average.
Figure 1. Weekly (May 28–June 4, 2018) average temperature (°C) . Figure 2. The 30 day (April 29 – May 29, 2018) average temperature (°C).
Weekly precipitation was above average and 30-day total rainfall is approximately 20% less than average (Figs. 3 and 4).
Figure 3. Weekly (May 28 – June 4, 2018) cumulative precipitation (mm).Figure 4. The 30-day (May 28 – June 4, 2018) cumulative precipitation (mm).
Accumulated precipitation for the growing season (April 01-June 4, 2018) is shown below.
The map below reflects the Highest Temperatures occurring over the past 7 days (May 29-June 4, 2018) across the prairies.
The map below reflects the Lowest Temperatures occurring over the past 7 days (May 29-June 4, 2018) across the prairies.
The growing degree day map (GDD) (Base 10ºC, March 1 – June 3, 2018) is below:
The growing degree day map (GDD) (Base 5ºC, March 1 – June 3, 2018) is below:
The maps above are all produced by Agriculture and Agri-Food Canada. Growers may wish to bookmark the AAFC Drought Watch Maps for the growing season.
Background: Agriculture and Agri-Food Canada (AAFC) and Environment and Climate Change Canada (ECCC) have been working together to study the potential of trajectories to deliver an early-warning system for the origin and destination of migratory invasive agricultural pests.
We receive two types of model output from ECCC: reverse trajectories (RT) and forward trajectories (FT):
(i) ‘Reverse trajectories’ (RT) refer to air currents that are tracked back in time from specified Canadian locations over a five-day period prior to their arrival date.
(ii) ‘Forward trajectories’ (FT) have a similar purpose; however, the modelling process begins at sites in USA and Mexico. The model output predicts the pathway of a trajectory. Again, of interest are the winds that eventually end up passing over the Prairies.
Current Data The number of Reverse Trajectories (RTs), crossing the prairies in May 2018, was lower than the long term average (2007 – 2017). The total number of incoming trajectories (sum of Pacific Northwest and southwest USA/Mexico) for 2018 was less than similar values for 2017 and 2007 – 2017. Based on RTs by region, the number of RTs from the Pacific Northwest (PNW) was less than 2007 – 2017 and 2017. To date, the RTs originating in the southwest USA/Mexico in 2018, have been greater in number than in 2017 and less than the long term average (Fig. 1).
Figure 1. Total number of reverse trajectories by geographic region (Pacific Northwest and Mexico and the southwest USA) for May 2018.
Weather synopsis – Weather conditions continue to be warmer and dryer than average across most of the prairies. This past week, (May 22 – 29, 2018) the average temperature was approximately 4 °C warmer than long term average (Fig. 1). The warmest weekly temperatures occurred across MB.
Figure 1. Weekly (May 22 – 29, 2018) average temperature (°C) .
The 30-day average temperature (April 29 – May 29) was approximately 2 °C warmer than long term average (Fig. 2).
Figure 2. The 30-day (April 29 – May 29, 2018) average temperature (°C).
Weekly precipitation was below average and 30-day total rainfall was approximately 50% less than average (Figs. 3 and 4).
Accumulated precipitation for the growing season (April 01-May 30, 2018) is shown below.
The map below reflects the Highest Temperatures occurring over the past 7 days (May 24-30, 2018) across the prairies.
The map below reflects the Lowest Temperatures occurring over the past 7 days (May 24-30, 2018) across the prairies – it got a bit chilly for our newly seeded crops!
The growing degree day map (GDD) (Base 10ºC, March 1 – May 30, 2018) is below:
The growing degree day map (GDD) (Base 5ºC, March 1 – May 30, 2018) is below:
The maps above are all produced by Agriculture and Agri-Food Canada. Growers may wish to bookmark the AAFC Drought Watch Maps for the growing season.
Background: Agriculture and Agri-Food Canada (AAFC) and Environment and Climate Change Canada (ECCC) have been working together to study the potential of trajectories to deliver an early-warning system for the origin and destination of migratory invasive agricultural pests.
We receive two types of model output from ECCC: reverse trajectories (RT) and forward trajectories (FT):
(i) ‘Reverse trajectories’ (RT) refer to air currents that are tracked back in time from specified Canadian locations over a five-day period prior to their arrival date.
(ii) ‘Forward trajectories’ (FT) have a similar purpose; however, the modelling process begins at sites in USA and Mexico. The model output predicts the pathway of a trajectory. Again, of interest are the winds that eventually end up passing over the Prairies.
Current Data
Since May 21, 2018, the number of incoming trajectories (RTs) crossing the prairies has increased, particularly from California, Texas and Mexico (Fig. 1). The increased number of reverse trajectories could result in increased introductions of insects into the prairies.
Figure 1. Daily total number of reverse trajectories, originating over the Pacific Northwest AND Southwest of the USA, that have entered the Canadian prairies (May 1-28, 2018).
Weather synopsis – Across most of the prairies, weather conditions continue to be warmer and dryer than average. This past week (May 14-21, 2018), the average temperature was approximately 2 °C warmer than long-term average temperatures (Fig. 1). The warmest weekly temperatures occurred across AB and west-central Saskatchewan. The 30-day average temperature (April 21-May 21) was 1-2 °C warmer than long term average temperatures with the warmest conditions occurring the western half of the prairies (Fig. 2).
Figure 1. Weekly (May 14 – May 21, 2018) average temperature (°C) .
Figure 2. 30-day (April 21 – May 21, 2018) average temperature (°C).
Weekly precipitation was well below average and 30 day total rainfall is approximately 50% less than average (Figs. 3 and 4). Manitoba continues to be very dry, though this week southeast Manitoba did receive rainfall amounts that were greater than 30 mm.
Background.Agriculture and Agri-Food Canada (AAFC) and Environment and Climate Change Canada (ECCC) have been working together to study the potential of trajectories to deliver an early-warning system for the origin and destination of migratory invasive agricultural pests. We receive two types of model output from ECCC: reverse trajectories (RT) and forward trajectories (FT):
(i) ‘Reverse trajectories’ (RT) refer to air currents that are tracked back in time from specified Canadian locations over a five-day period prior to their arrival date.
(ii) ‘Forward trajectories’ (FT) have a similar purpose; however, the modelling process begins at sites in USA and Mexico. The model output predicts the pathway of a trajectory. Again, of interest are the winds that eventually end up passing over the Prairies.
Current Data
Pacific Northwest (PNW) –The total number of RT’s from the Pacific Northwest of the United States, for the period between May 1 – 22, 2018, was n=67. This was significantly less than in 2017 (n=226), as well as the long term average (n=166) (Fig. 1).
Figure 1. Daily total number of reverse trajectories originating over the Pacific Northwest of
the United States that have entered the prairies (May 1-22, 2018).
Remember – If your fields are near one of Environment Canada’s PRAIRIE Radar Stations, consider accessing weather radar maps in video format show either the past 1 OR 3 hours of spatio-temporal maps of precipitation events. These maps can help growers review where and how much precipitation fell nearby. Screen shots of Environment Canada’s webpages are below for reference and red text and arrows have been added to help you navigate the webpage.
Weather synopsis – This past week (May 6-13), the average temperature was approximately 2 °C cooler than long term average (Fig. 1). The warmest weekly temperatures occurred across Alberta. The 30-day average temperature (April 13-May 13) was very similar to long term average temperatures with the warmest conditions occurring across Alberta (Fig. 2).
Figure 1. Average temperatures across the Canadian prairies these past seven days (May 6-13, 2018).
Figure 2. Average temperatures across the Canadian prairies this past month (April 13-May 13, 2018).
Weekly precipitation was well below average and 30-day total rainfall is approximately 50% less than average (Figs. 3 and 4). The lowest precipitation amounts have occurred across eastern Saskatchewan and most of Manitoba.
Figure 3. Cumulative precipitation (mm) these past seven days (May 6-13, 2018).
Figure 4. Cumulative precipitation (mm) this past month (April 13-May 13, 2018).
The map below reflects the Highest Temperatures occurring over the past 7 days across the prairies.
The map below reflects the Lowest Temperatures occurring over the past 7 days across the prairies.
The growing degree day map (GDD) (Base 10ºC, March 1 – May 13, 2018) is below:
The growing degree day map (GDD) (Base 5ºC, March 1 – May 13, 2018) is below:
The maps above are all produced by Agriculture and Agri-Food Canada. Growers may wish to bookmark the AAFC Drought Watch Maps for the growing season.
Background. Agriculture and Agri-Food Canada (AAFC) and Environment and Climate Change Canada (ECCC) have been working together to study the potential of trajectories for monitoring insect movements since the late 1990’s. Trajectory models are used to deliver an early-warning system for the origin and destination of migratory invasive species, such as diamondback moth. In addition, plant pathologists have shown that trajectories can assist with the prediction of plant disease infestations and are also beginning to utilize these same data.
We receive two types of model output from ECCC: reverse trajectories (RT) and forward trajectories (FT): (i) Reverse trajectories refer to air currents that are tracked back in time from specified Canadian locations over a five-day period prior to their arrival date. Of particular interest are those trajectories that, prior to their arrival in Canada, originated over northwestern and southern USA and Mexico, anywhere diamondback moth populations overwinter and adults are actively migrating. If diamondback adults are present in the air currents that originate from these southern locations, the moths may be deposited on the Prairies at sites along the trajectory, depending on the local weather conditions at the time that the trajectories pass over our area (e.g. rain showers, etc.). RTs are the best available estimate of 3D wind fields at a specific point. They are based on observations, satellite and radiosonde data. (ii) Forward trajectories have a similar purpose; however, the modelling process begins at sites in USA and Mexico. The model output predicts the pathway of a trajectory. Again, of interest to us are the winds that eventually end up passing over the Prairies. Current Data
Pacific Northwest (PNW) –The number of RTs, predicted to cross the prairies, has increased over the past week (Fig. 1). Though there has been an increase, results for May 1-14 predicted that 38 PNW reverse trajectories (RT) have crossed the prairies. This total is less than the average number 107 (based on 2007-2017) and well below last year’s results (155).
Figure 1. Daily total of reverse trajectories (RT) originating over the Pacific Northwest that
have entered the prairies during April 2018.
Weather synopsis – We begin with a synopsis of the weather situation starting with the map below reflecting the Accumulated Precipitation received during the winter (Nov 1, 2017 to Mar 31, 2018) across the prairies (Figure 1).
Figure 1. Accumulated precipitation across the Canadian prairies during the winter (November 1, 2017-March 31, 2018.
Prairie meteorological conditions continue to be cooler and dryer than average. This past week the average temperature was about 1 °C cooler than normal (Fig. 2). The 30-day average temperature (April 6-May 6) was 4 °C cooler than normal (Figs. 3 and 4). Weekly and 30 day total rainfall is approximately 50% less than average (Figs. 5 and 6).
Figure 2. Average temperatures across the Canadian prairies these past seven days (Apr 29-May 6, 2018).
Figure 3. Average temperatures across the Canadian prairies these past 30 days (Apr 6-May 6, 2018).
Figure 4. Monthly mean temperature differences across the Canadian prairies for the month of April 2018.
Figure 5 Accumulated precipitation across the Canadian prairies these past seven days (Apr 29-May 6, 2018).
Figure 6. Accumulated precipitation across the Canadian prairies these past 30 days (Apr 6-May 6, 2018).
The map below reflects the Highest Temperatures occurring over the past 7 days across the prairies.
The map below reflects the Lowest Temperatures occurring over the past 7 days across the prairies.
The growing degree day map (GDD) (Base 10ºC, March 1 – May 6, 2018) is below:
The growing degree day map (GDD) (Base 5ºC, March 1 – May 6, 2018) is below:
The maps above are all produced by Agriculture and Agri-Food Canada. Growers may wish to bookmark the AAFC Drought Watch Maps for the growing season.
Background. Agriculture and Agri-Food Canada (AAFC) and Environment and Climate Change Canada (ECCC) have been working together to study the potential of trajectories for monitoring insect movements since the late 1990’s. Trajectory models are used to deliver an early-warning system for the origin and destination of migratory invasive species, such as diamondback moth. In addition, plant pathologists have shown that trajectories can assist with the prediction of plant disease infestations and are also beginning to utilize these same data.
We receive two types of model output from ECCC: reverse trajectories (RT) and forward trajectories (FT): (i) Reverse trajectories refer to air currents that are tracked back in time from specified Canadian locations over a five-day period prior to their arrival date. Of particular interest are those trajectories that, prior to their arrival in Canada, originated over northwestern and southern USA and Mexico, anywhere diamondback moth populations overwinter and adults are actively migrating. If diamondback adults are present in the air currents that originate from these southern locations, the moths may be deposited on the Prairies at sites along the trajectory, depending on the local weather conditions at the time that the trajectories pass over our area (e.g. rain showers, etc.). RTs are the best available estimate of 3D wind fields at a specific point. They are based on observations, satellite and radiosonde data.
(ii) Forward trajectories have a similar purpose; however, the modelling process begins at sites in USA and Mexico. The model output predicts the pathway of a trajectory. Again, of interest to us are the winds that eventually end up passing over the Prairies.
Current Data
Pacific Northwest (PNW) – The number of RTs predicted to cross the prairies from the PNW, has increased over the last few days. Model runs for May 7th predicted that seven RTs will cross over AB and SK in the next 24 hours from the PNW. Based on results for April, there have been fewer RTs in 2018 than 2017. The number of RTs were greatest across southern AB (Fig. 1). The majority of these crossed the prairies in mid-April (Fig. 2).
Figure 1. Total number of reverse trajectories, originating over the US PNW, that
has entered the prairies during April, 2018.
Figure 2. Daily total number of reverse trajectories, originating over the US PNW, that
have entered the prairies during April, 2018.
Weather synopsis – Temperature – Crops continue to mature and some fields have been harvested across the prairies. The map below reflects the number of days above 25°C (Fig. 1) while the next map reflects the number of days above 30°C (Fig. 2).
Figure 1. Number of days above 25°C.
Figure 2. Number of days above 30°C.
The map below reflects the highest temperatures across the prairies the past seven days (Fig. 3) while the lowest temperatures the past seven days reveals some cool nights in some areas (Fig. 4).
Figure 3. Highest temperatures the past seven days (August 15-21, 2017) across
the Canadian prairies.
Figure 4. Lowest temperatures the past seven days (August 15-21, 2017) across the Canadian prairies.
Precipitation – Seven-day rainfall accumulations were greatest in central Alberta into Saskatchewan but also in eastern Saskatchewan and into Manitoba (Fig. 5).
Figure 5. Accumulated precipitation the past seven days (August 15-21, 2017).
The accumulated precipitation for the growing season (Fig. 6) continues to reflect dryer growing conditions and dryer than normal for most of the prairies (Fig. 7).
Figure 6. Accumulated precipitation for the growing season (April 1-21, 2017).
Figure 7. Percent of average precipitation for the growing season (April 1-August 21, 2017).
The growing degree day map (GDD) (Base 10ºC, March 1 – August 20, 2017) is below:
The growing degree day map (GDD) (Base 5ºC, March 1 – August 20, 2017) is below:
The maps above are all produced by Agriculture and Agri-Food Canada. Growers may wish to bookmark the AAFC Drought Watch Maps for the growing season.
Weather synopsis – Temperature – This week’s temperatures were warmest in southern Alberta and Manitoba (Fig. 1). The 30-day average temperatures were warmest along the border with USA (Fig. 2).
Figure 1. Average precipitation across the Canadian prairies the past
seven days (August 7-14, 2017).
Figure 2. Average temperature across the Canadian prairies the
past 30 days (July 14-August 14, 2017).
After a fair bit heat across the prairies (Fig. 3), a few of us woke to cooler temperatures (Fig. 4) this week!
Figure 3. Highest temperatures the past seven days (August 10-16, 2017) across
the Canadian prairies.
Figure 4. Lowest temperatures the past seven days (August 10-16, 2017) across
the Canadian prairies.
Precipitation – Seven-day rainfall accumulations were greatest in regions north of the Yellowhead highway (Fig. 5). Total 30-day rainfall accumulations indicate that conditions dryer than normal for most of the prairies, particularly southern and central regions of Alberta (Fig. 6).
Figure 5. Accumulated precipitation the past seven days (August 7-13, 2017).
Figure 6. Percent of average precipitation across the Canadian prairies the past 30 days (July 15-August 13, 2017).
This growing season (April 1 – August 13, 2017), the percent of average precipitation continues to be below average for most of the prairies (Fig. 7).
Figure 7. Percent of average precipitation across the Canadian prairies for the growing season (April 1-August 13, 2017).
The growing degree day map (GDD) (Base 10ºC, March 1 – August 13, 2017) is below:
The growing degree day map (GDD) (Base 5ºC, March 1 – August 13, 2017) is below:
The maps above are all produced by Agriculture and Agri-Food Canada. Growers may wish to bookmark the AAFC Drought Watch Maps for the growing season.
Weather synopsis – This past week’s temperatures were above normal in many locations on the prairies, especially south and central Alberta and Saskatchewan (Fig. 1).
Figure 1. Highest temperatures across the Canadian prairies the past seven days (July 25-31, 2017).
Seven-day rainfall accumulations were low across the prairies. Total 30-day rainfall accumulations indicate that conditions are normal to dryer-than-normal for most of the prairies (Fig. 2).
Figure 2. Percent of average precipitation across the Canadian prairies the past 30 days (July 2-31, 2017).
Growing season (April 1 – July 31, 2017) percent of average precipitation continues to be average for some areas of Alberta, but below average for most of Saskatchewan and Manitoba.
Figure 3. Percent of average precipitation across the Canadian prairies over the growing season (April 1-July 31, 2017).
The growing degree day map (GDD) (Base 10ºC, March 1 – July 30, 2017) is below:
The growing degree day map (GDD) (Base 5ºC, March 1 – July 30, 2017) is below:
The maps above are all produced by Agriculture and Agri-Food Canada. Growers may wish to bookmark the AAFC Drought Watch Maps for the growing season.
Weather synopsis – This week’s temperatures were similar to last week, both the seven-day (Fig. 1) and 30-day average temperatures (Fig. 2) were similar to long term averages (Fig. 3). Compared to 30-day average temperatures, Alberta was above normal, whereas Saskatchewan and Manitoba were slightly below normal (Fig. 2).
Figure 1. Accumulated precipitation the past 7 days (from July 17-24, 2017) across the Canadian prairies.
Figure 2. Accumulated precipitation the past 30 days (from June 24-July 24, 2017) across the Canadian prairies.
Figure 3. Long Term Normal (LTN) average temperatures over 30 days
(from June 24-July 24) across the Canadian prairies.
Seven-day rainfall accumulations were low across the prairies ( Fig. 4). Total 30-day rainfall accumulations indicate that conditions are normal to dryer than normal for most of the prairies (Fig. 5). Growing season (April 1 – July 23, 2017) percent of average precipitation continues to be average for most of Alberta and below average for most of Saskatchewan and Manitoba.
Figure 4. Accumulated precipitation the past seven days (July 17-24, 2017) across the Canadian prairies.
Figure 5. Accumulated precipitation the past 30 days (June 24-July 24, 2017) across the Canadian prairies.
Figure 6. Percent of average precipitation for the across the Canadian prairies for
the growing season (April 1-July 24, 2017).
The lowest temperatures across the prairies over the past seven days (July 18-24, 2017) are mapped below.
In contrast, the highest temperatures recorded over the past seven days (July 13-19, 2017) are presented below.
The growing degree day map (GDD) (Base 10ºC, March 1 – July 23, 2017) is below:
The growing degree day map (GDD) (Base 5ºC, March 1 – July 23, 2017) is below:
The maps above are all produced by Agriculture and Agri-Food Canada. Growers may wish to bookmark the AAFC Drought Watch Maps for the growing season.
Weather synopsis – Seven-day rainfall accumulations were generally greater than the previous week. Some areas in southern prairies received 10 to 30 mm of rain (Fig. 1). Total 30-day rainfall for June 17 to July 16, 2017, indicates that conditions are somewhat dryer than normal for most of the prairies. Figure 2 indicates that the regions with <40% of average rainfall (30-day) now include much of southern Saskatchewan, as well as large spots of southern Alberta and Manitoba. The percent of average precipitation for this growing season continues to be average for most of Alberta and below average for much of Saskatchewan and Manitoba (Fig. 3).
Figure 1. Accumulated precipitation across the Canadian prairies the past seven days (July 10-16, 2017).
Figure 2. Accumulated precipitation across the Canadian prairies the past 30 days (June 17-July 16, 2017).
Figure 3. Percent of average precipitation across the Canadian prairies from June 17-July 16, 2017.
Over the past week, the warmest temperatures occurred over a large area from Brandon to Edmonton and south to the Canada-USA border. Although temperatures were warmer (1°C) than last week, both the 7- and 30-day average temperatures were similar to long-term normal (LTN). Compared to 30-day average temperatures, Alberta was above normal whereas Saskatchewan and Manitoba were slightly below normal.
The lowest temperatures across the prairies over the past seven days (July 13-19, 2017) are mapped below.
In contrast, the highest temperatures recorded over the past seven days (July 13-19, 2017) are presented below.
The growing degree day map (GDD) (Base 10ºC, March 1 – July 13, 2017) is below:
The maps above are all produced by Agriculture and Agri-Food Canada. Growers may wish to bookmark the AAFC Drought Watch Maps for the growing season.
Weather synopsis – Although temperatures were warmer than last week, both the seven- and 30-day average temperatures were similar to long term averages.
Compared to 30-day average temperatures, Alberta was above normal, whereas Saskatchewan and Manitoba were slightly below normal.
Central and northern regions of all three provinces reported increased rainfall amounts. Total 30-day rainfall accumulations indicate that conditions are normal to dryer than normal for most of the prairies.
Growing season (April 1 – July 10, 2017) percent of average precipitation is average for most of Alberta and below average for most of Saskatchewan and Manitoba.
The lowest temperatures across the prairies over the past seven days (July 5-11, 2017) are mapped below.
In contrast, the highest temperatures recorded over the past seven days (July 5-11, 2017) are presented below.
The updated growing degree day map (GDD) (Base 5ºC, March 1 – July 9, 2017) is below:
While the growing degree day map (GDD) (Base 10ºC, March 1 – July 9, 2017) is below:
The maps above are all produced by Agriculture and Agri-Food Canada. Growers may wish to bookmark the AAFC Drought Watch Maps for the growing season.
Weather synopsis – This past week, average temperatures were slightly below long-term normals for mid-June. Average temperatures for June indicate that Alberta temperatures were average, to above average, while Saskatchewan was slightly below than average temperatures.
Total 30 day rainfall accumulations indicate that conditions are dryer than normal for most of Saskatchewan, the southern Peace River region and large areas of Manitoba. Central and southern Alberta has had normal rainfall for June.
The lowest temperatures across the prairies over the past seven days (June 29-July 5, 2017) are mapped below.
In contrast, the highest temperatures recorded over the past seven days (June 29-July 5, 2017) are presented below.
The updated growing degree day map (GDD) (Base 5ºC, March 1 – July 3, 2017) is below:
While the growing degree day map (GDD) (Base 10ºC, March 1 – July 3, 2017) is below:
The maps above are all produced by Agriculture and Agri-Food Canada. Growers may wish to bookmark the AAFC Drought Watch Maps for the growing season.
Weather synopsis – Our AAFC Staff are busy surveying this week so be sure to check back for updates!
Precipitation for the growing season is presented below (April 1-June 27, 2017) followed by the precipitation expressed as Percent of Normal for the same period.
Over the past seven days, the greatest precipitation fell in northern growing areas along areas typically grouped as Boreal Plains (June 21-27, 2017). Southern Alberta, southeast Saskatchewan and southwest Manitoba received the lowest amounts of precipitation over the same period.
The lowest temperatures across the prairies over the past seven days (June 21-27, 2017) are mapped below. Although there was little chance of frost, much of the prairies recorded lows ranging from 0-4°C.
In contrast, the highest temperatures recorded over the past seven days (June 21-27, 2017) are presented below. The field crops in some of these areas endured daily fluctuations of 20-25°C.
The updated growing degree day map (GDD) (Base 5ºC, March 1 – June 25, 2017) is below:
While the growing degree day map (GDD) (Base 10ºC, March 1 – June 25, 2017) is below:
The maps above are all produced by Agriculture and Agri-Food Canada. Growers may wish to bookmark the AAFC Drought Watch Maps for the growing season.
Weather synopsis – This past week our average temperatures were cooler than last week, and 2 – 3°C cooler than long term averages for mid-June (Fig. 1). The second map presents the 30-day average temperature (Fig. 2).
Figure 1. Average temperature across the Canadian prairies from June 4-11, 2017.
Figure 2. Average temperature across the Canadian prairies from May 19-June 19, 2017.
Temperature – The seven-day accumulated precipitation was greater than 15 mm with southeast Saskatchewan and southwest Manitoba reporting amounts in excess of 40 mm (Fig. 3).
Figure 3. Accumulated precipitation across the Canadian prairies from June 11-18, 2017.
Compared to last week, the 30-day rainfall amounts are similar to long term average values for southern Manitoba, southeast Saskatchewan and southwest Alberta (Fig. 4). A large region in south and central Saskatchewan is reporting well below normal precipitation.
Figure 4. Percent of average precipitation from May 20-June 18, 2017.
The following is the accumulated precipitation for the growing season up to June 18, 2017.
The updated growing degree day map (GDD) (Base 5ºC, March 1 – June 18, 2017) is below:
While the growing degree day map (GDD) (Base 10ºC, March 1 – June 18, 2017) is below:
The maps above are all produced by Agriculture and Agri-Food Canada. Growers may wish to bookmark the AAFC Drought Watch Maps for the growing season.
Weather synopsis – Over this past week, average temperatures were similar to last week and only marginally cooler than long term averages for early June. Average temperatures were warmest in southern Manitoba with cooler conditions occurring across Alberta.
This second map presents the 30 Day Average Temperature. Average temperatures were greatest in southern regions of Manitoba and central Alberta.
The map below indicates that 7 Day Accumulated Precipitation was greatest across Alberta while central and southern Saskatchewan continued to be dry.
The map below indicates that the rainfall amounts for the past month (May 13 – June 11) were average to above-average in Alberta and below-average for Manitoba and Saskatchewan.
The updated growing degree day map (GDD) (Base 5ºC, March 1 – June 11, 2017) is below:
While the growing degree day map (GDD) (Base 10ºC, March 1 – June 11, 2017) is below:
The maps above are all produced by Agriculture and Agri-Food Canada. Growers may wish to bookmark the AAFC Drought Watch Maps for the growing season.
Reverse trajectories (RT) There were 139 reverse trajectories that were predicted to pass across Alberta and Saskatchewan from the Pacific Northwest between May 26 and June 8.
Forward trajectories (FT) The following map indicates the origin of forward trajectories predicted to cross the prairies over the next five days. There have been an increased number of winds that have crossed the prairies from the southwest USA and Mexico since June 1.
Weather synopsis – Meteorological conditions for the past month of May were generally warmer and dryer than normal. Average May temperatures were in the range of 0 to 2°C warmer than long term averages.
May precipitation was below average across Manitoba and Saskatchewan; rainfall amounts were greatest across Alberta. The overall precipitation this growing season has been below normal to normal in Saskatchewan and Manitoba, but normal to well above normal in Alberta.
Over this past week, average temperatures across the prairies were 2°C warmer than last week, and marginally warmer than long term averages for early June. Weekly average temperatures were greatest in southern regions of Manitoba and Alberta. Precipitation over the past week was greatest in central and northern Alberta. Most of Saskatchewan was dry over the past week.
The map below reflects the Accumulated Precipitation for the Growing Season so far for the prairie provinces (i.e., April 1-June 5, 2017):
The map below shows the Lowest Temperatures the Past 7 Days (May 30-June 5, 2017) across the prairies:
Whereas the map below shows the Highest Temperatures the Past 7 Days (May 30-June 5, 2017):
The updated growing degree day map (GDD) (Base 5ºC, March 1 – June 4, 2017) is below:
While the growing degree day map (GDD) (Base 10ºC, March 1 – June 4, 2017) is below:
The maps above are all produced by Agriculture and Agri-Food Canada. Growers may wish to bookmark the AAFC Drought Watch Maps for the growing season.
Remember – If your fields are near one of Environment Canada’s PRAIRIE Radar Stations, consider accessing weather radar maps in video format show either the past 1 OR 3 hours of spatio-temporal maps of precipitation events. These maps can help growers review where and how much precipitation fell nearby. Screen shots of Environment Canada’s webpages are below for reference and red text and arrows have been added to help you navigate the webpage.
Weather synopsis – Across the prairies, this week’s average temperatures were slightly cooler than normal.
After a wetter week in central and northern Alberta, the most current 7-day rainfall was greater in the east of central Alberta into central Saskatchewan down into Manitoba.
The 30-day rainfall amounts were average to below average across the southern prairies.
The map below reflects the Accumulated Precipitation for the Growing Season so far for the prairie provinces (i.e., April 1-May 31, 2017):
The map below shows the Lowest Temperatures the Past 7 Days (May 25-31, 2017) across the prairies:
Whereas the map below shows the Highest Temperatures the Past 7 Days (May 25-31, 2017):
The updated growing degree day map (GDD) (Base 5ºC, March 1 – May 28, 2017) is below:
While the growing degree day map (GDD) (Base 10ºC, March 1 – May 28, 2017) is below:
The maps above are all produced by Agriculture and Agri-Food Canada. Growers may wish to bookmark the AAFC Drought Watch Maps for the growing season.
THE WEEK OF MAY 29, 2017: Wind trajectory data processing by AAFC-Saskatoon Staff began in April. Reverse Trajectories track arriving air masses back to their point of origin while Forward Trajectories predict favourable winds expected to arrive across the Canadian Prairies for the week of May 23, 2017: Reverse trajectories (RT) Overall, the number of RTs entering the prairies from the Pacific
Northwest has been lower than average. The map (Fig. 1) shows that the greatest number
of RTs from the Pacific Northwest continued to be across southern Alberta.
Figure 1. Number of Reverse Trajectories (RT) originating in the Pacific Northwest that
arrived at sites across the Canadian prairies from April 1-May 29, 2017.
If your fields are near one of Environment Canada’s PRAIRIE Radar Stations, consider accessing weather radar maps in video format show either the past 1 OR 3 hours of spatio-temporal maps of precipitation events. These maps can help growers review where and how much precipitation fell nearby. Screen shots of Environment Canada’s webpages are below for reference and red text and arrows have been added to help you navigate the webpage.
Weather synopsis – This week’s average temperatures were approximately 3°C cooler than normal (Fig. 1) and seven day precipitation accumulations were above normal. The 30-day rainfall amounts were below average in eastern Saskatchewan and Manitoba (Fig. 2).
The map below reflects the Accumulated Precipitation for the Growing Season so far for the prairie provinces (i.e., April 1-May 24, 2017):
The map below shows the Lowest Temperatures the Past 7 Days (May 18-24, 2017) across the prairies:
Whereas the map below shows the Highest Temperatures the Past 7 Days (May 18-24, 2017):
The updated growing degree day map (GDD) (Base 5ºC, March 1 – May 22, 2017) is below:
While the growing degree day map (GDD) (Base 10ºC, March 1 – May 22, 2017) is below:
The maps above are all produced by Agriculture and Agri-Food Canada. Growers may wish to bookmark the AAFC Drought Watch Maps for the growing season.
THE WEEK OF MAY 23, 2017: Wind trajectory data processing by AAFC-Saskatoon Staff began in April. Reverse Trajectories track arriving air masses back to their point of origin while Forward Trajectories predict favourable winds expected to arrive across the Canadian Prairies for the week of May 23, 2017: Reverse trajectories (RT) Between May 16 and 23 there were 57 RT’s from the Pacific Northwest of USA that crossed the prairies. The first chart (Fig. 1) indicates site specific results for PNW RT’s for each day of the past week. Values reflect the fact that PNW RT’s were lower this week than previous weeks. The greatest number of PNW RT’s continued to be across southern AB (Fig. 2).
Figure 1. Cumulative number of Reverse Trajectories (RT) originating from the Pacific Northwest arriving across the Canadian prairies from May 16-23, 2017 (Olfert et al. 2017).
Figure 2. Number of Reverse Trajectories (RT) originating in the Pacific Northwest that arrived at sites across the Canadian prairies from April 1-May 23, 2017.
Forward trajectories (FT) No FTs originating from Mexico or southwest USA/Mexico are predicted to cross the prairies over the next 5 days. The following map provides an overview of FTs that have crossed the prairies during the 2017 growing season.
Figure 2. Total number of reverse trajectories originating from the Pacific Northwest of the USA arriving at sites across the Canadian prairies (April 1-May 23, 2017).
Weather synopsis – This week’s average temperatures were approximately 2°C cooler than normal and seven-day precipitation accumulations were above normal.
Over the past month, precipitation was below average in Manitoba, but above average in northwest Alberta.
The map below reflects the Accumulated Precipitation for the Growing Season so far for the prairie provinces (i.e., April 1-May 17, 2017):
The map below shows the Lowest Temperatures the Past 7 Days (May 11-17, 2017) across the prairies:
Whereas the map below shows the Highest Temperatures the Past 7 Days (May 11-17, 2017):
The updated growing degree day map (GDD) (Base 5ºC, March 1 – May 14, 2017) is below:
While the growing degree day map (GDD) (Base 10ºC, March 1 – May 14, 2017) is below:
The maps above are all produced by Agriculture and Agri-Food Canada. Growers may wish to bookmark the AAFC Drought Watch Maps for the growing season.
THE WEEK OF MAY 15, 2017: Wind trajectory data processing by AAFC-Saskatoon Staff began in April. Reverse Trajectories track arriving air masses back to their point of origin while Forward Trajectories predict favourable winds expected to arrive across the Canadian Prairies for the week of May 15, 2017: Reverse trajectories (RT) Wind trajectories have been monitored since April 1 this year. Wind patterns continue to be similar to previous weeks. The first graph (Fig. 1) indicates that winds from the Pacific Northwest (PNW) passed over Carman MB each day of the past week. Though the number of RTs increased over the past week, the overall pattern has not changed across the prairies.
Figure 1. Number of Reverse Trajectories (RT) originating in the Pacific Northwest that have arrived at sites across the Canadian prairies from May 9-15, 2017.
Figure 2 shows that the greatest number of RTs continue to be settling at sites across southern Alberta (e.g., areas highlighted red).
Figure 2. Total number of reverse trajectories originating from the Pacific Northwest of the USA arriving at sites across the Canadian prairies (April 1-May 15, 2017).
Weather synopsis – Many locations across southern Saskatchewan and Alberta experienced temperatures above 25°C this week. Average temperatures were warmest across southeastern Saskatchewan from May 1-8, 2017.
The map below reflects the Accumulated Precipitation for the Growing Season so far for the prairie provinces (i.e., April 1-May 10, 2017):
Whereas the seven-day precipitation accumulations were greatest across Saskatchewan:
The map below shows the Lowest Temperatures the Past 7 Days (May 4-10, 2017) across the prairies:
Whereas the map below shows the Highest Temperatures the Past 7 Days (May 4-10, 2017):
The updated growing degree day map (GDD) (Base 5ºC, March 1 – May 7, 2017) is below:
While the growing degree day map (GDD) (Base 10ºC, March 1 – May 7, 2017) is below:
The maps above are all produced by Agriculture and Agri-Food Canada. Growers may wish to bookmark the AAFC Drought Watch Maps for the growing season.
THE WEEK OF MAY 1, 2017: Wind trajectory data processing by AAFC-Saskatoon Staff began in April. Reverse Trajectories track arriving air masses back to their point of origin while Forward Trajectories predict favourable winds expected to arrive across the Canadian Prairies for the week of May 9, 2017: Reverse trajectories (RT) Wind trajectories have been monitored since April 1 this year. This week there was an increase in the number of RT winds that crossed the prairies from the Pacific Northwest (PNW) of USA. In Alberta, Grande Prairie and Beiseker had a significant increase in the number of RT winds over this past week (Fig. 1 and 2). In addition to the PNW, there were three prairie locations (Selkirk MB, Unity SK and Olds AB) that had winds originating from California and Texas.
Figure 1. Weekly cumulative counts of Reverse Trajectories (RT) from the Pacific Northwest (PNW) from May 3-9, 2017 (2017 Olfert et al.).
Figure 2. Total number of RT winds from the Pacific Northwest from April 1-May 9, 2017.
Forward trajectories (FT) Similar to Reverse Trajectories, most of the model output of Forward Trajectories (FT) have originated from the Pacific Northwest (PNW). However, a few winds have been forecasted to cross the prairies from the southern USA since April 1, 2017 (Fig. 3).
Figure 3. Source destinations and number of FT winds originating from the USA between April 1-May 9, 2017.
Weather synopsis – We begin with a synopsis of the weather situation starting with the map below which reflects the Accumulated Precipitation received during the winter (Nov 1, 2016 to Mar 31, 2017) across the prairies (Figure 1).
Figure 1. Accumulated precipitation across the Canadian prairies during the winter (November 1, 2016-March 31, 2017).
Average temperatures over the past month have been warmest across the southern prairies. April precipitation was greater across Manitoba and eastern Saskatchewan than western Saskatchewan or Alberta (Figure 2). Compared to last year at this time, April 2017 was approximately 2°C cooler with marginally greater precipitation than last year (prairie-wide average values; Figure 3).
Figure 2. Average temperatures across the Canadian prairies the past 30 days (April 1-30, 2017).
Figure 3. Cumulative precipitation across the Canadian prairies the past 30 days (April 1-30, 2017).
The map below reflects the Highest Temperatures occurring over the past 7 days across the prairies.
The map below reflects the Lowest Temperatures occurring over the past 7 days across the prairies.
The maps above are all produced by Agriculture and Agri-Food Canada. Growers may wish to bookmark the AAFC Drought Watch Maps for the growing season.
THE WEEK OF MAY 1, 2017: Wind trajectory data processing by AAFC-Saskatoon Staff began in April. Reverse Trajectories track arriving air masses back to their point of origin while Forward Trajectories predict favourable winds expected to arrive across the Canadian Prairies for the week of May 1, 2017: Reverse trajectories (RT) Wind trajectories have been monitored since April 1 this year. To date, winds have originated predominantly from the USA – Pacific Northwest (PNW). Overall results indicate that eastern locations on the prairies have had fewer of these winds than western locations (Figure 1). Over the last week (April 25- May 1, 2017), Lethbridge has had significantly more RT’s from the Pacific Northwest than either SK and MB sites (Figure 2).
Figure 1. Summary of reverse trajectory wind data (PNW) for the
prairies April 1-May 1, 2017.
Figure 2. Based on results for specific locations (Brandon,
Saskatoon, Lethbridge), Lethbridge has had significantly more RT’s from the
Pacific Northwest than SK and MB.
Forward trajectories (FT) Forward trajectories that were predicted to cross the prairies from the southern USA and Mexico have been limited so far. There were a few isolated days of winds from Santa Maria and Imperial Valley, CA. and from Mexicali, Mexico in mid-April.
Weather synopsis – The average temperature over the past seven days (August 7-14, 2016) was similar to Long Term Normal (LTN) values.
Across central Alberta, Saskatchewan, and Manitoba, average cumulative rainfall was well above LTN values.
The average 30 day temperature for July 8-August 7, 2016, was similar to LTN and rainfall was 50% greater than LTN (average across the prairies). The wettest conditions have been in south and central areas of western Saskatchewan and central Alberta.
The average growing season temperature (April 1- August 7, 2016) was marginally warmer than normal. Growing season rainfall has been approximately 28% above average.
The map below shows the modelled soil moisture across the prairies (August 14, 2016).
The updated growing degree day map (GDD) (Base 5ºC, March 1 – August 14, 2016) is below:
While the growing degree day map (GDD) (Base 10ºC, March 1 – August 14, 2016) is below:
The map below shows the Lowest Temperatures the Past 7 Days (August 10 – August 16, 2016) across the prairies:
The map below shows the Highest Temperatures the Past 7 Days (August 10 – August 16, 2016):
The maps above are all produced by Agriculture and Agri-Food Canada. Growers may wish to bookmark the AAFC Drought Watch Maps for the growing season.
Average temperatures for June 27-July 3 were warmer in Alberta than Manitoba. This week the trend was reversed with the warmest temperatures being reported from Manitoba. Prairie wide, the average temperature was similar to Long Term Normals (LTN).
Seven day (July 4-10, 2016) cumulative rainfall was greater in Manitoba and eastern Saskatchewan and Alberta and western Saskatchewan. Average cumulative rainfall was marginally greater than LTN values.
The average 30 day temperature (June 10-July 10) was 0.5 °C warmer than LTN values.
The average 30 day rainfall was 20% greater than LTN values.
The average growing season temperature (April 1 – July 10) has been approximately 1 °C warmer than normal. Growing season rainfall has been approximately 10% above average.
The map below shows the Lowest Temperatures the Past 7 Days (July 5-11, 2016) across the prairies:
The map below shows the Highest Temperatures the Past 7 Days (July 5-11, 2016):
The updated growing degree day map (GDD) (Base 5ºC, March 1 – July 10, 2016) is below:
While the growing degree day map (GDD) (Base 10ºC, March 1 – July 10, 2015) is below:
The maps above are all produced by Agriculture and Agri-Food Canada. Growers may wish to bookmark the AAFC Drought Watch Maps for the growing season.
Staff are busy surveying so some maps are not available this week.
Warmer temperatures were observed throughout the prairies and the west was drier compared to the east.
The Accumulated Precipitation the past 7 days (June 22-28, 2016) is below:
The map below reflects the Accumulated Precipitation for the Growing Season so far for the prairie provinces (i.e., May 1-June 26, 2016):
Compared to last week, overnight temperatures were warmer during the past 7 days. The map below shows the Lowest Temperatures the Past 7 Days (June 22-28, 2016) across the prairies:
The map below shows the Highest Temperatures the Past 7 Days (June 22-28, 2016):
The updated growing degree day map (GDD) (Base 5ºC, March 1 – June 26, 2016) is below:
While the growing degree day map (GDD) (Base 10ºC, March 1 – June 26, 2015) is below:
The maps above are all produced by Agriculture and Agri-Food Canada. Growers may wish to bookmark the AAFC Drought Watch Maps for the growing season.
Across the prairies, weather conditions were warmer and wetter than long term average values for the period of June 6-13, 2016. The average temperature was 15°C and was approximately 2°C warmer than the previous week.
Across the prairies, weather conditions were very similar to long term average (LTN) values for the period of June 13-19, 2016. The average temperature was 14 °C and was approximately 1 °C warmer than the previous week. Temperatures in southern MB were 5-6 °C warmer than many locations in AB.
The Peace River region was wetter than normal while most of southern AB and MB were dryer than normal.
Soil moisture conditions are wettest in the Peace River region and across southern SK and MB. Southern AB and central SK have the driest soil moisture conditions.
The map below reflects the Accumulated Precipitation for the Growing Season so far for the prairie provinces (i.e., April 1-June 20, 2016):
Compared to last week, overnight temperatures were warmer during the past 7 days. The map below shows the Lowest Temperatures the Past 7 Days (June 14-20, 2016) across the prairies:
The map below shows the Highest Temperatures the Past 7 Days (June 14-20, 2016):
The updated growing degree day map (GDD) (Base 5ºC, March 1 – June 19, 2016) is below:
While the growing degree day map (GDD) (Base 10ºC, March 1 – June 19, 2015) is below:
The maps above are all produced by Agriculture and Agri-Food Canada. Growers may wish to bookmark the AAFC Drought Watch Maps for the growing season.
Across the prairies, weather conditions were warmer and wetter than long term average values for the period of June 6-13, 2016. The average temperature was 15°C and was approximately 2°C warmer than the previous week.
This week’s rainfall was generally greater than long term average amounts. For the 30 day period of May 14-June 13, conditions were cooler in Alberta compared to Saskatchewan and Manitoba. The area extending from Swift Current to Regina and north to Saskatoon continues to be the warmest/driest region of the prairies.
The map below reflects the Accumulated Precipitation for the Growing Season so far for the prairie provinces (i.e., April 1-June 14, 2016):
The map below reflects the Accumulated Precipitation the Past 7 Days for the prairie provinces (i.e., June 8-14, 2016):
Compared to last week, overnight temperatures were warmer the past 7 days. The map below shows the Lowest Temperatures the Past 7 Days (June 8-14, 2016) across the prairies:
The map below shows the Highest Temperatures the Past 7 Days (June 8-14, 2016):
The updated growing degree day map (GDD) (Base 5ºC, March 1 – June 12, 2016) is below:
While the growing degree day map (GDD) (Base 10ºC, March 1 – June 12, 2015) is below:
The maps above are all produced by Agriculture and Agri-Food Canada. Growers may wish to bookmark the AAFC Drought Watch Maps for the growing season.
THE WEEK OF JUNE 13, 2016: Wind trajectory data processing by AAFC-Saskatoon Staff began in April. Reverse Trajectories track arriving air masses back to their point of origin while Forward Trajectories predict favourable winds expected to arrive across the Canadian Prairies for the week of June 13, 2016: Reverse trajectories (RT) Mexico and southwest USA – This week, Grande Prairie (June 7) had the first report of a Reverse Trajectory crossing over southwest US and Mexico crossing. Other sites included Selkirk, Portage, Carman and Brandon.
The map below represents the distribution of RTs from the prairies that originated over southwest US and Mexico.
Forward trajectories (FT) There were 17 Forward Trajectories from southwest US (12) and Mexico (5) that were predicted to cross the prairies over the next five days.
Across the prairies, meteorological conditions were similar to long term average values for the period of May 30 – June 5, 2016. The average temperature was 12.8 °C and was 1.5 °C warmer than the previous week.
This week’s rainfall was generally greater than long term average amounts. Since April 1, most regions have reported above normal precipitation. Southeastern Saskatchewan and southern Manitoba reported the highest rainfall amounts. The map below shows the Accumulated Precipitation the past 7 days (i.e., May 30-June 5, 2016):
Soil moisture levels (refer to model output map) were predicted to be above average across most of the prairies.
For the period of May 1-31, 2016, conditions were cooler and wetter in Alberta than Saskatchewan and Manitoba.
The map below reflects the Accumulated Precipitation for the Growing Season so far for the prairie provinces (i.e., April 1-May 30, 2016):
Compared to last week, overnight temperatures were warmer the past 7 days. The map below shows the Lowest Temperatures the Past 7 Days (June 1-7, 2016) across the prairies:
The map below shows the Highest Temperatures the Past 7 Days (June 1-7, 2016):
The updated growing degree day map (GDD) (Base 5ºC, March 1 – June 5, 2016) is below:
While the growing degree day map (GDD) (Base 10ºC, March 1 – June 5, 2015) is below:
The maps above are all produced by Agriculture and Agri-Food Canada. Growers may wish to bookmark the AAFC Drought Watch Maps for the growing season.
Wind trajectory data processing by AAFC-Saskatoon Staff began in April. Reverse Trajectories track arriving air masses back to their point of origin while Forward Trajectories predict favourable winds expected to arrive across the Canadian Prairies. THE WEEK OF June 6, 2016: Nothing to report this week!
Wind trajectory data processing by AAFC-Saskatoon Staff began in April. Reverse Trajectories track arriving air masses back to their point of origin while Forward Trajectories predict favourable winds expected to arrive across the Canadian Prairies.
THE WEEK OF June 6, 2016: Nothing to report this week!
Across the prairies, meteorological conditions were similar to long term average values for the period of May 22-29, 2016. The average temperature was 11.2 °C and was similar to the previous seven days. For the second week in a row temperatures were warmer in Manitoba and eastern Saskatchewan than western Saskatchewan and Alberta.
This week’s rainfall was generally greater than long term average amounts. The region northeast of Edmonton and locations within southeastern Manitoba reported significant rainfall amounts while lower amounts were reported for southern Alberta and most of Saskatchewan. The map below shows the Accumulated Precipitation the past 7 days (i.e., May 22-29, 2016):
The map below reflects the Accumulated Precipitation for the Growing Season so far for the prairie provinces (i.e., April 1-May 30, 2016):
Compared to last week, soil moisture levels were predicted improve across most of the prairies:
The west was cooler compared to the east in terms of overnight temperatures over the last week. The map below shows the Lowest Temperatures the Past 7 Days (May 24-30, 2016) across the prairies:
The map below shows the Highest Temperatures the Past 7 Days (May 24-30, 2016):
The updated growing degree day map (GDD) (Base 5ºC, March 1 – May 29, 2016) is below:
While the growing degree day map (GDD) (Base 10ºC, March 1 – May 29, 2015) is below:
The maps above are all produced by Agriculture and Agri-Food Canada. Growers may wish to bookmark the AAFC Drought Watch Maps for the growing season.
Grasshoppers (Acrididae) –This past week, warm conditions conditions in Saskatchewan were predicted to result in enhanced development.
For the week of May 29, 2016, the predicted mean embryological development was 87% and indicates that grasshopper hatch will continue to progress over the next week to ten days. The model predicted that 23% of the hatch is complete (compared to 13% predicted last week). Approximately 15% of the population was predicted to be in the first instar and 7% in the second instar.
The following image showing various stages of the clearwinged grasshopper is provided below – note that adults have wings extending the length of the abdomen whereas nymphs lack wings but develop wing buds that will eventually mature to wings.
If fields are near one of Environment Canada’s radar stations, consider accessing weather radar maps in video format that show either the past 1 OR 3 hours of spatio-temporal maps of precipitation events. These maps can help growers review where and how much precipitation fell nearby.
Screen shots of Environment Canada’s webpages are below for reference and red text and arrows have been added to help you navigate.
THE WEEK OF MAY 30, 2016: Wind trajectory data processing by AAFC-Saskatoon Staff began in April. Reverse Trajectories track arriving air masses back to their point of origin while Forward Trajectories predict favourable winds expected to arrive across the Canadian Prairies for the week of May 30, 2016: Reverse trajectories (RT) Mexico and southwest USA – Gainsborough SK and Carman MB continue to have RT’s that originate across southwestern USA and Mexico this week.
The following are RTs originating from the Pacific Northwest of the USA:
THE WEEK OF MAY 30, 2016: Wind trajectory data processing by AAFC-Saskatoon Staff began in April. Reverse Trajectories track arriving air masses back to their point of origin while Forward Trajectories predict favourable winds expected to arrive across the Canadian Prairies for the week of May 30, 2016: Reverse trajectories (RT) – Mexico and southwest USA Gainsborough SK and Carman MB continue to have RT’s that originate across southwestern USA and Mexico this week.
Reverse Trajectories originating from Mexico and southwest USA between April 1-May 30, 2016:
Forward trajectories (FT) No forward trajectories from southwestern USA so far this week.
THE WEEK OF MAY 24, 2016: Wind trajectory data processing by AAFC-Saskatoon Staff began in April. Reverse Trajectories track arriving air masses back to their point of origin while Forward Trajectories predict favourable winds expected to arrive across the Canadian Prairies for the week of May 24, 2016:
Reverse trajectories (RT) – Mexico and southwest USA Compared to 2015, the number of reverse trajectories crossing the prairies is greater in 2016. Since April 1, there have been 18 prairie locations that have had RT’s originating from southwest USA. This compares with 12 for the same time last year.
Reverse Trajectories originating from Mexico and southwest USA between April 1-May 24, 2016:
Across the prairies, meteorological conditions were similar to long term average values for May 16-23, 2016. The average temperature was 11.1 °C and was much warmer than the previous seven days (8.7 °C) and was 1 °C warmer than the average temperature. Temperatures were generally warmer in Manitoba and eastern Saskatchewan than western Saskatchewan and Alberta.
This past week, many Albertan locations reported significant rainfall amounts while minimal amounts were reported for Saskatchewan and Manitoba.
The map below shows the Accumulated Precipitation the past 7 days (i.e., May 16-23, 2016) which fell as both rain and snow in the west:
The map below reflects the Accumulated Precipitation for the Growing Season so far for the prairie provinces (i.e., April 1-May 24, 2016):
Compared to last week, soil moisture levels were predicted improve across most of Alberta. Lower soil moisture values were predicted across most of Saskatchewan.
Again cooler temperatures put newly emerging crops at risk. The map below shows the Lowest Temperatures the Past 7 Days (May 18-24, 2016) across the prairies:
The map below shows the Highest Temperatures the Past 7 Days (May 18-24, 2016):
The updated growing degree day map (GDD) (Base 5ºC, March 1 – May 23, 2016) is below:
While the growing degree day map (GDD) (Base 10ºC, March 1 – May 23, 2016) is below:
The maps above are all produced by Agriculture and Agri-Food Canada. Growers may wish to bookmark the AAFC Drought Watch Maps for the growing season.
Across the prairies, meteorological conditions for the period May 8-15, 2016, were similar to long term average values for the first half of May.
The average temperature was 8.7 °C (12 °C last week) and was 0.7 °C warmer than the average temperature for May 8-15.
This past week, rainfall amounts were minimal across most of Alberta and southern Manitoba. Most of Saskatchewan received normal or above normal rainfall. This week rainfall amounts greater than 30 mm were reported for a number of locations across southern Saskatchewan.
The 30-day rainfall amounts were similar to long term average values.
Compared to last week, soil moisture levels were predicted to improve across most of Saskatchewan. Low soil moisture values were predicted across central and northern Alberta.
Unfortunately, there were some cool temperatures just as seedlings were emerging….. The map below reflects the Lowest Temperatures occurring over the past 7 days across the prairies.
Whereas the map below reflects the Highest Temperatures occurring over the past 7 days across the prairies.
The maps above are all produced by Agriculture and Agri-Food Canada. Growers may wish to bookmark the AAFC Drought Watch Maps for the growing season.
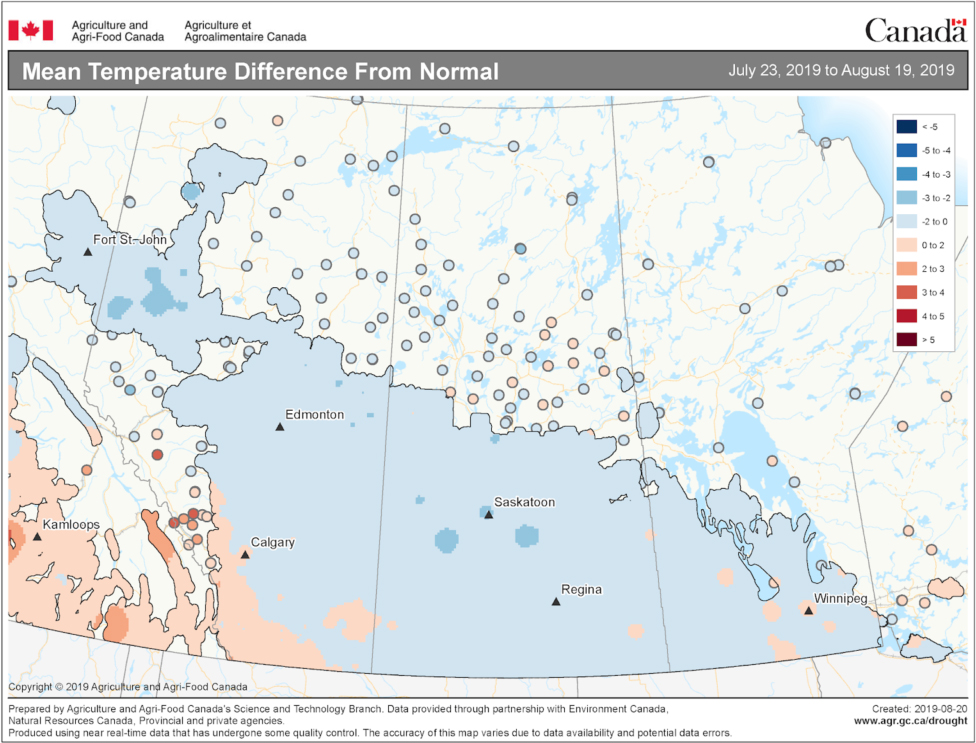
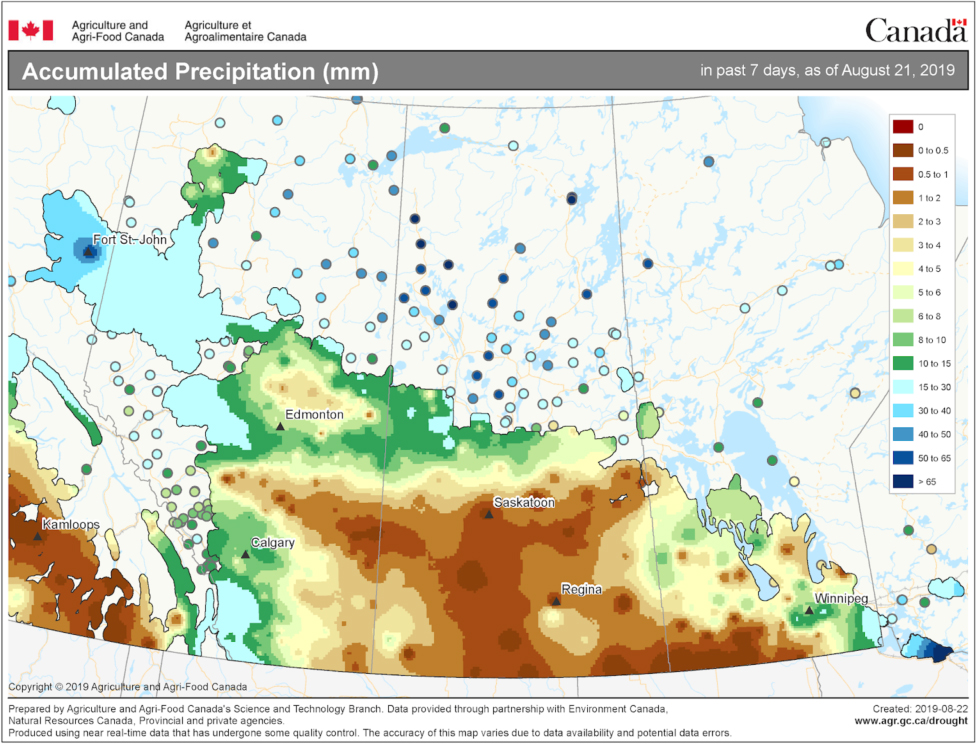
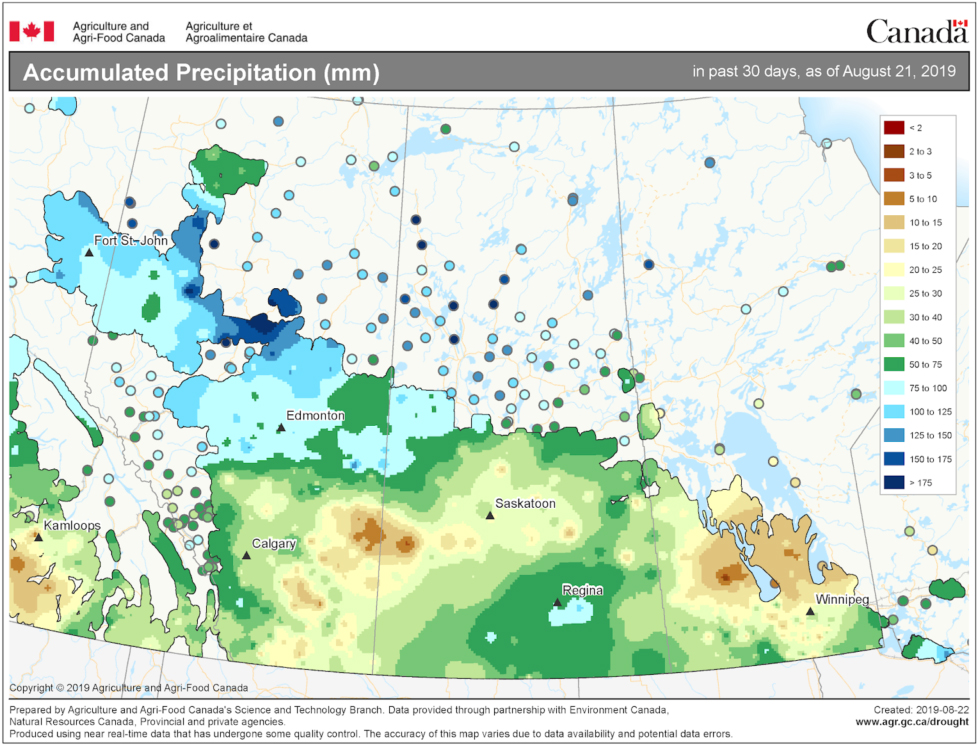
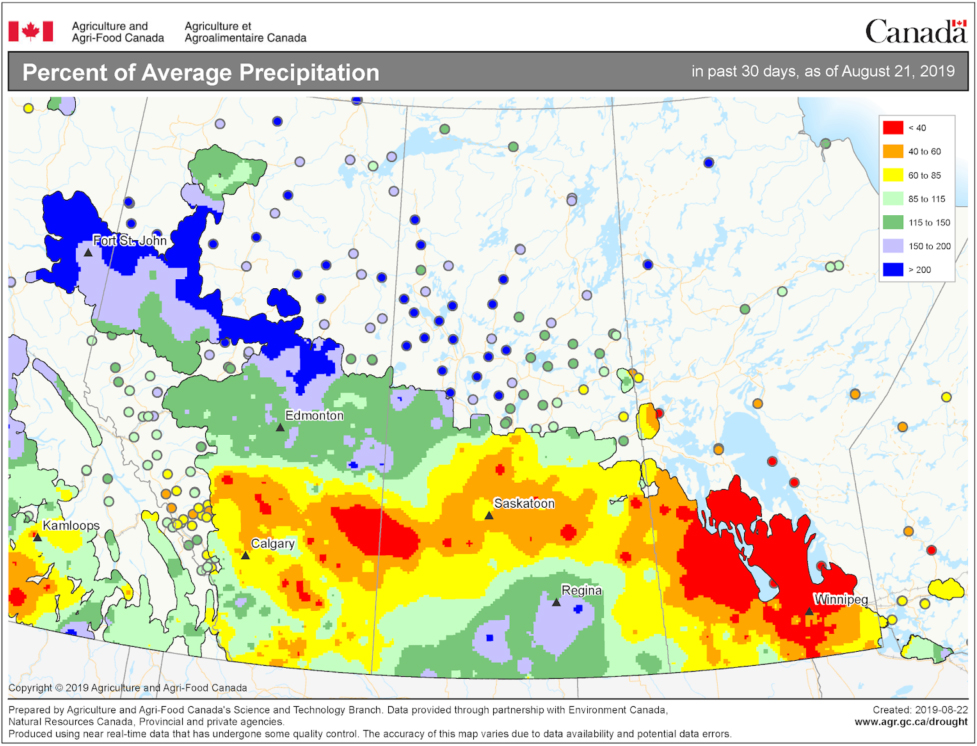
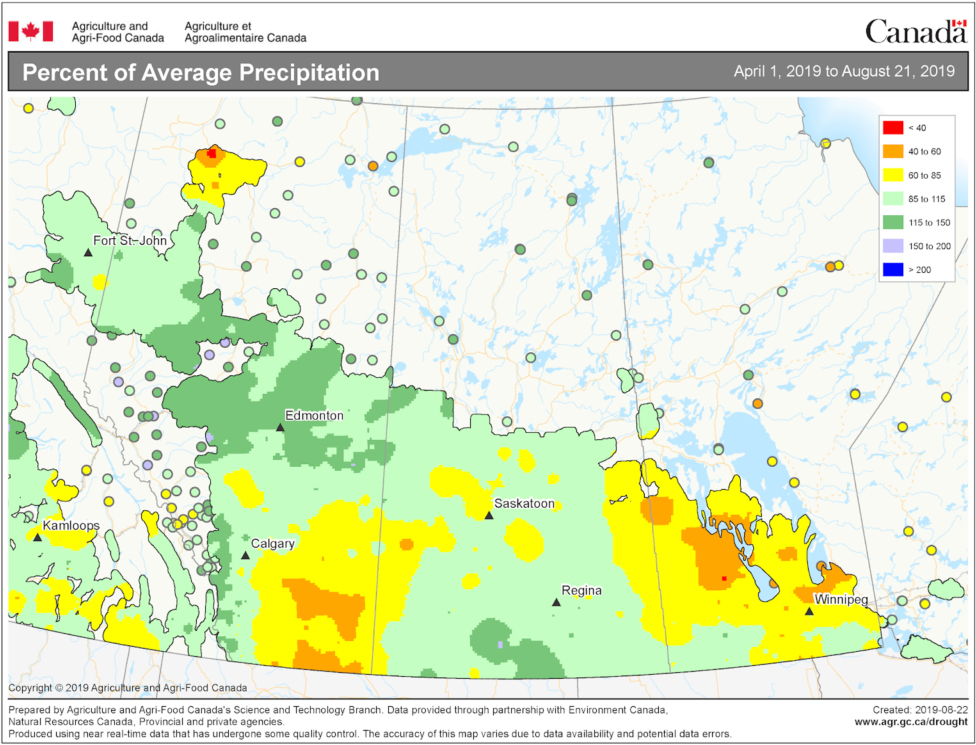
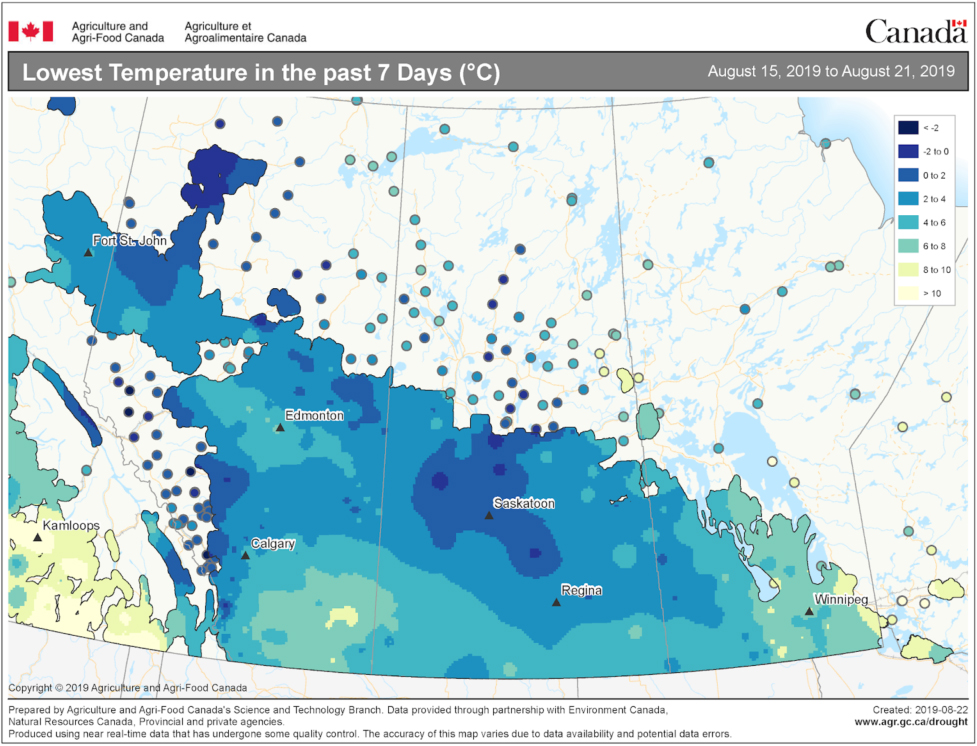
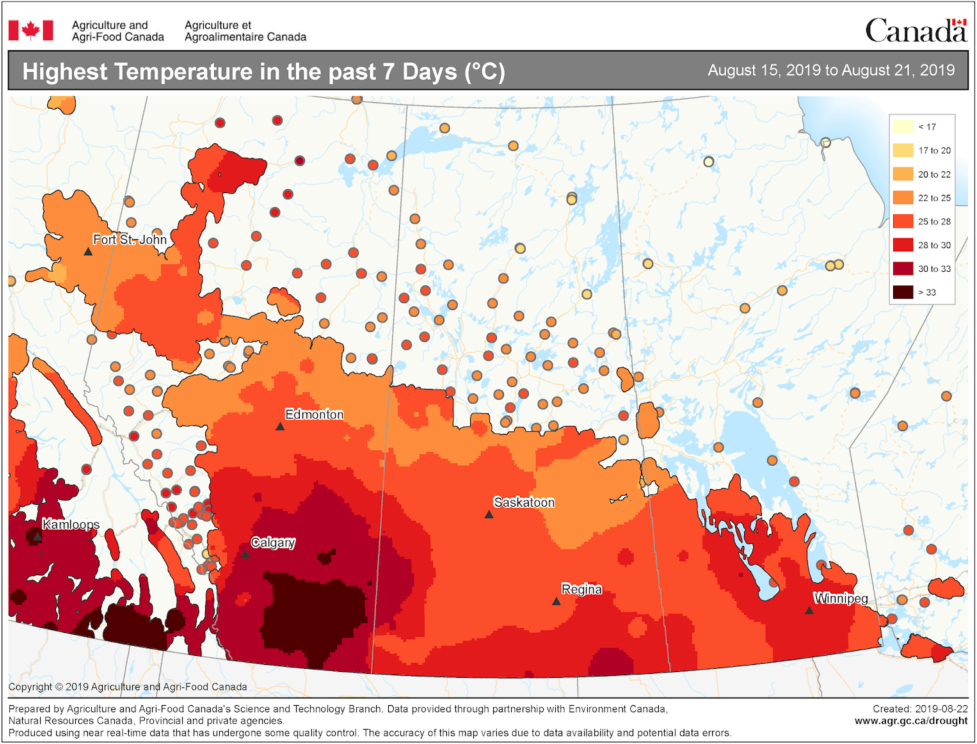
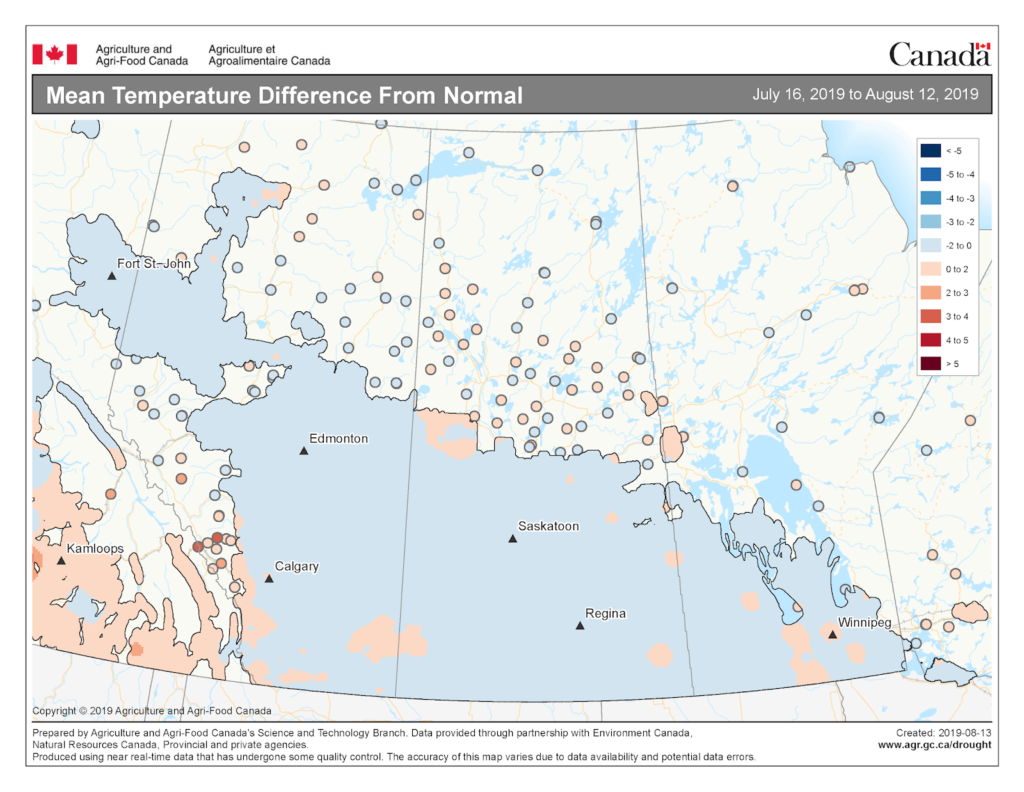
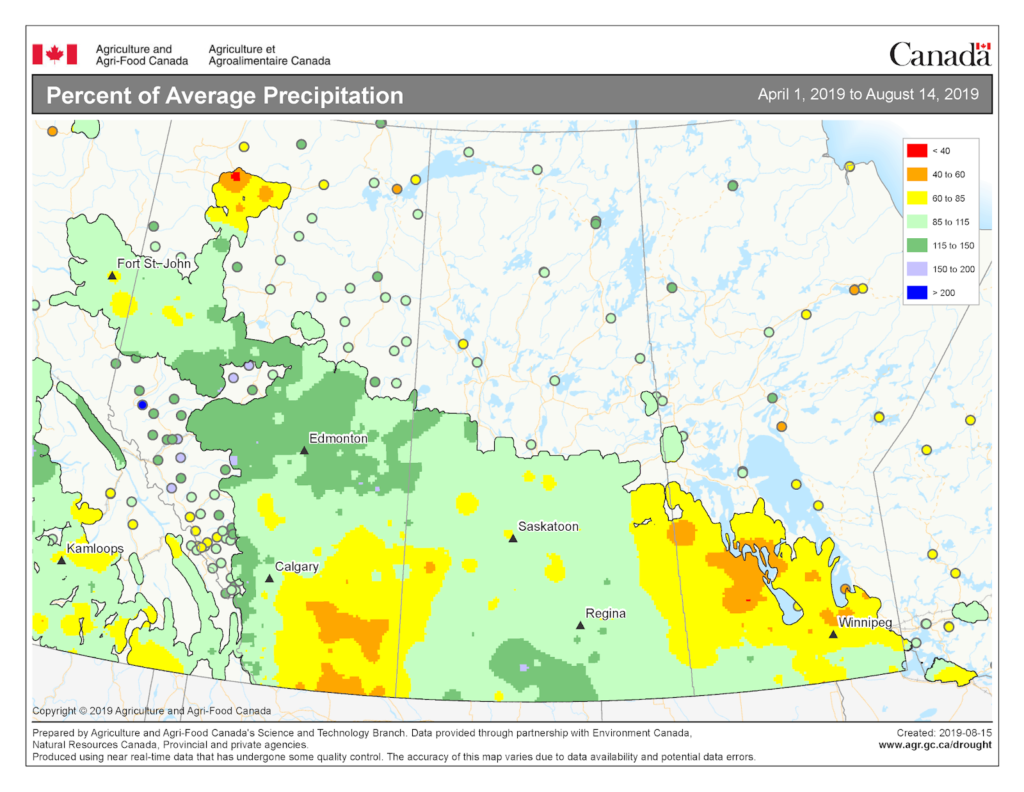
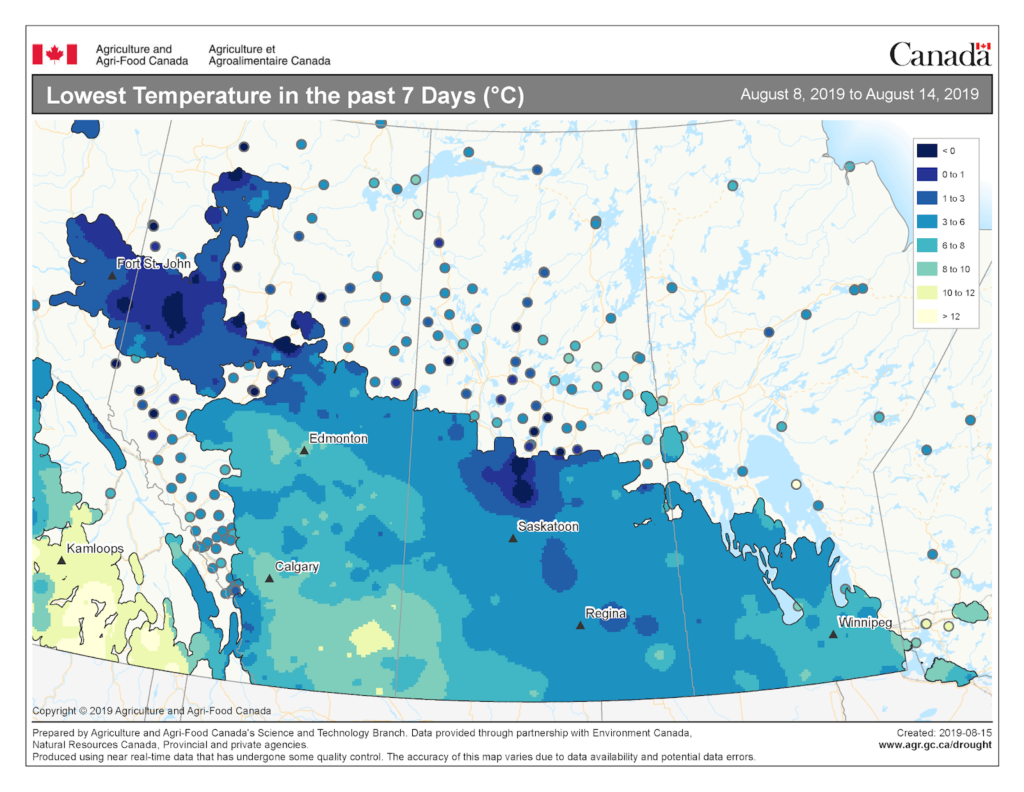
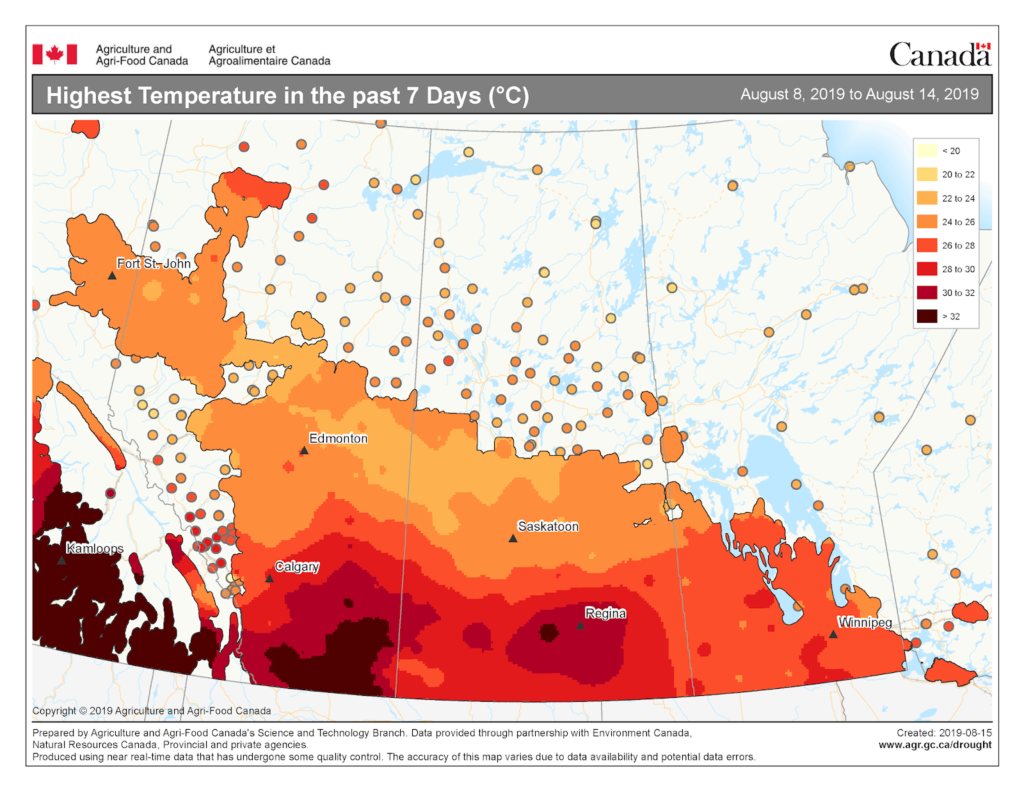
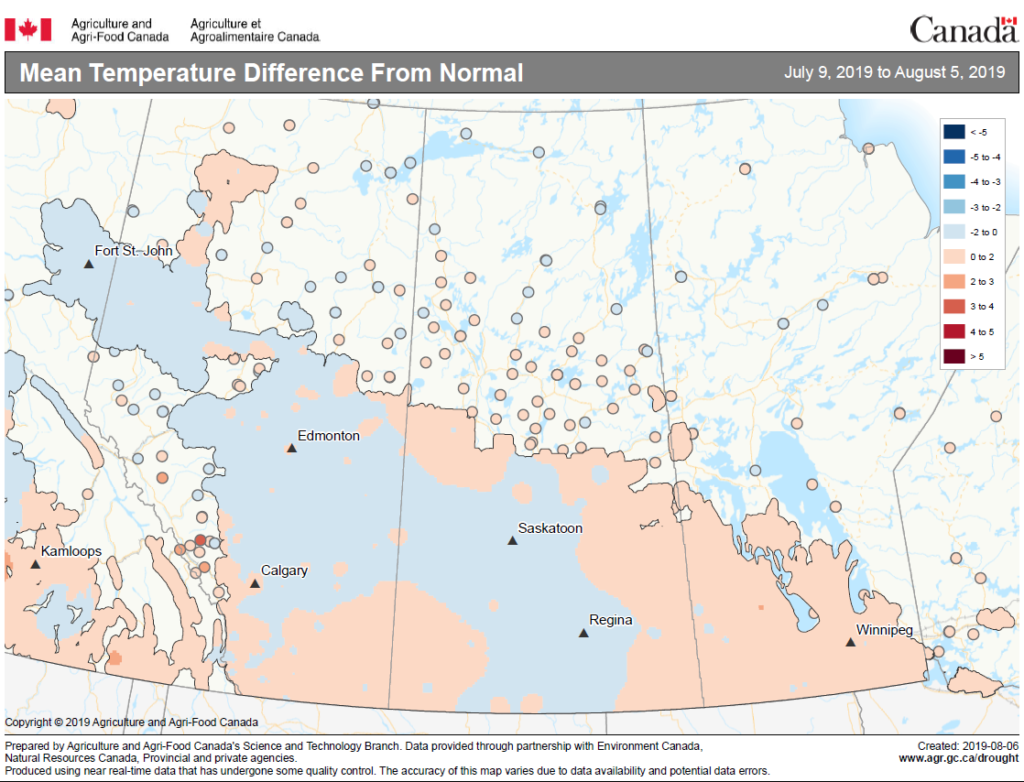
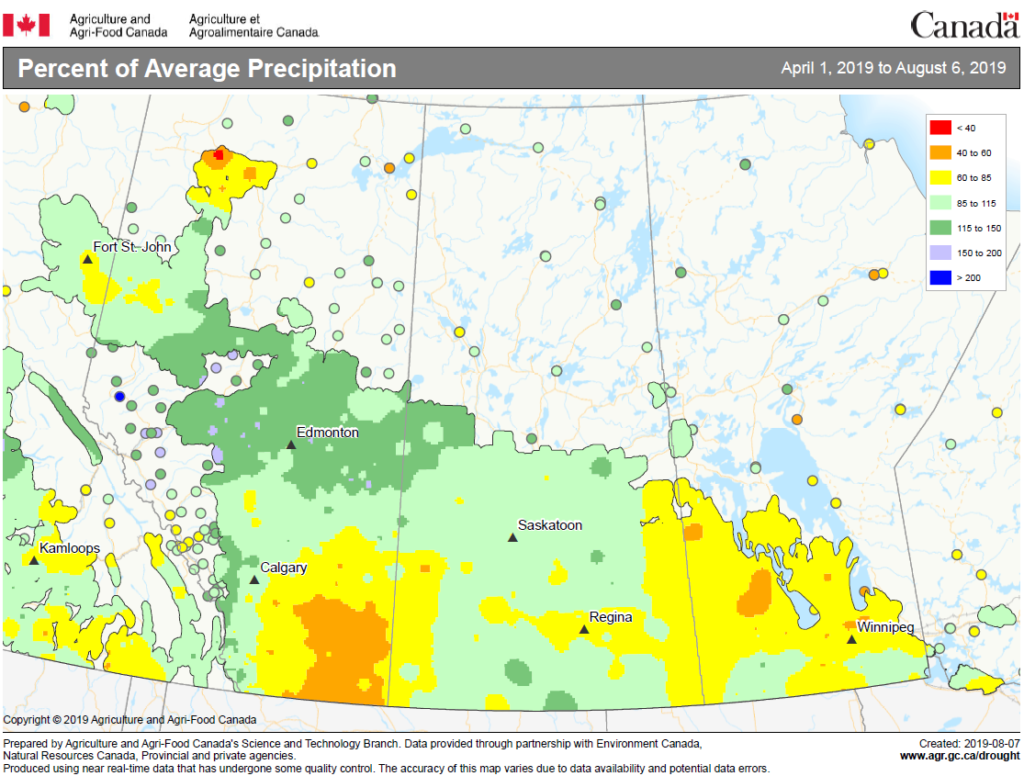
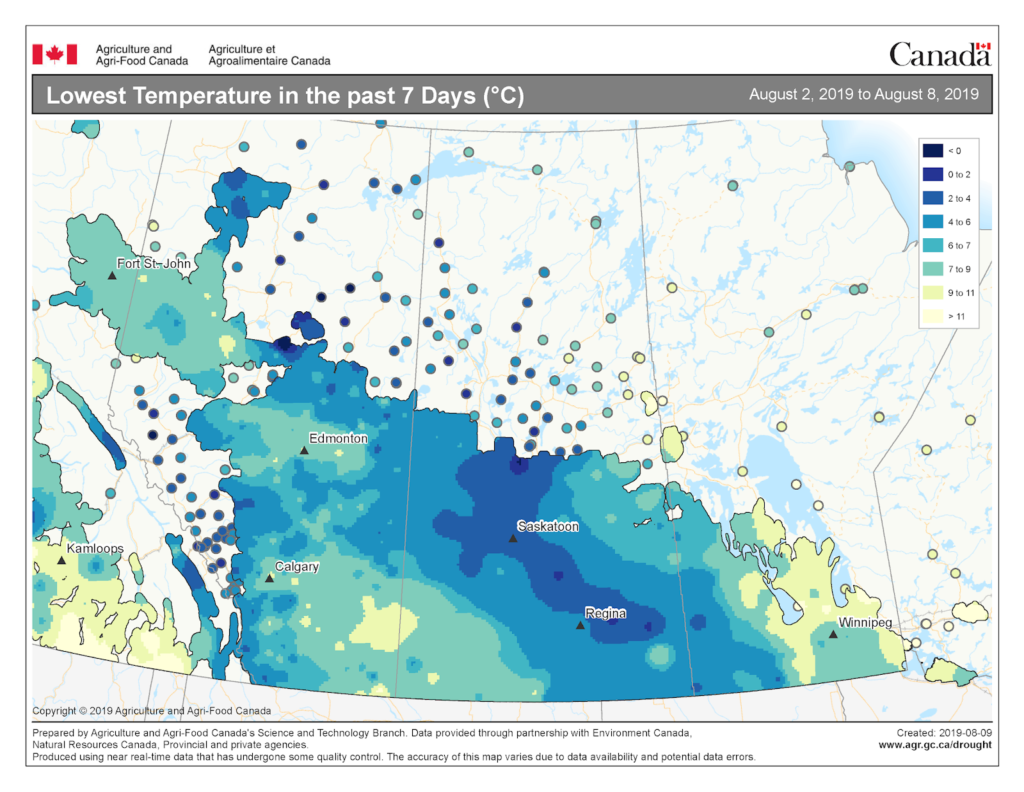
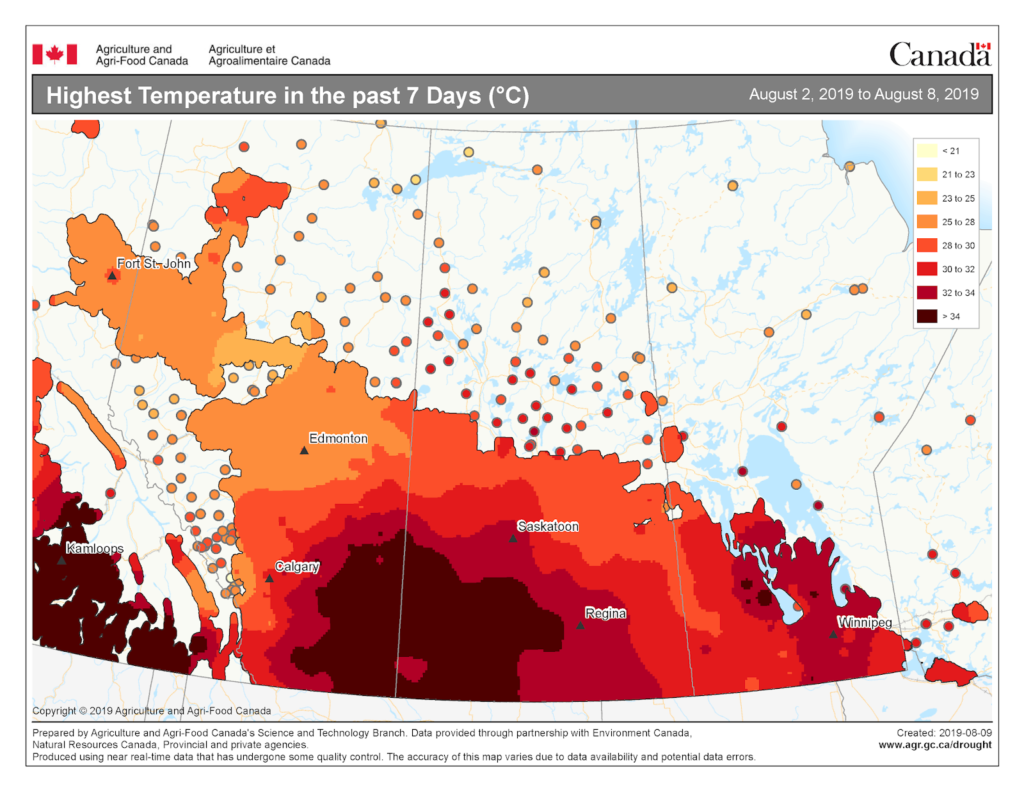
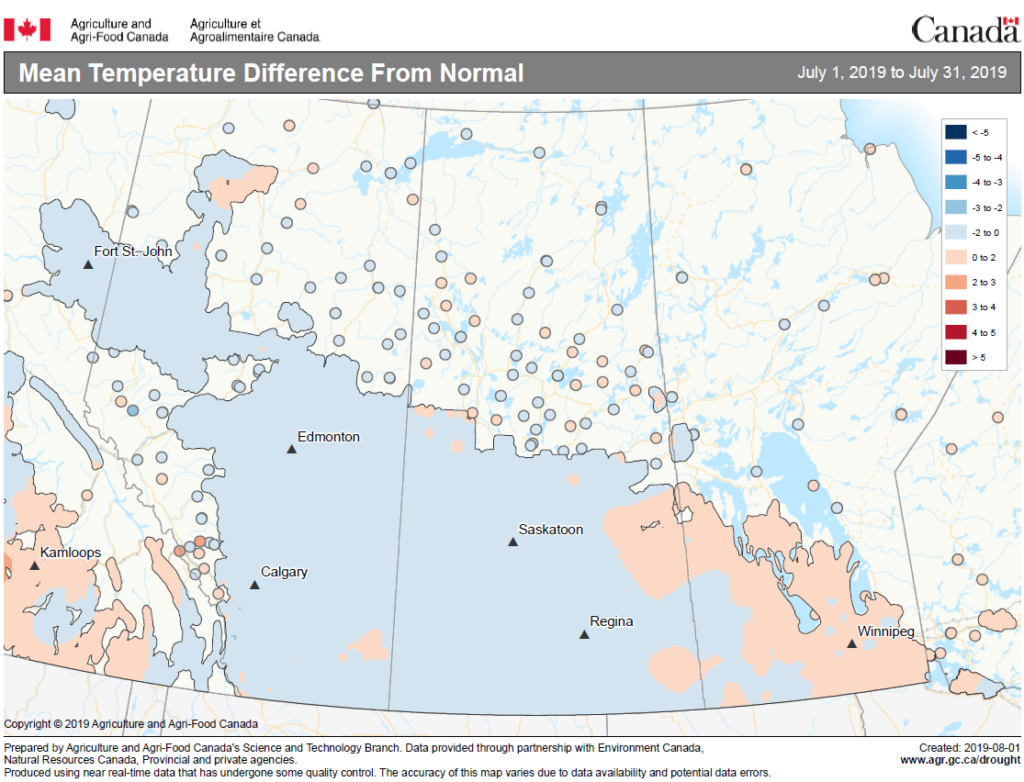
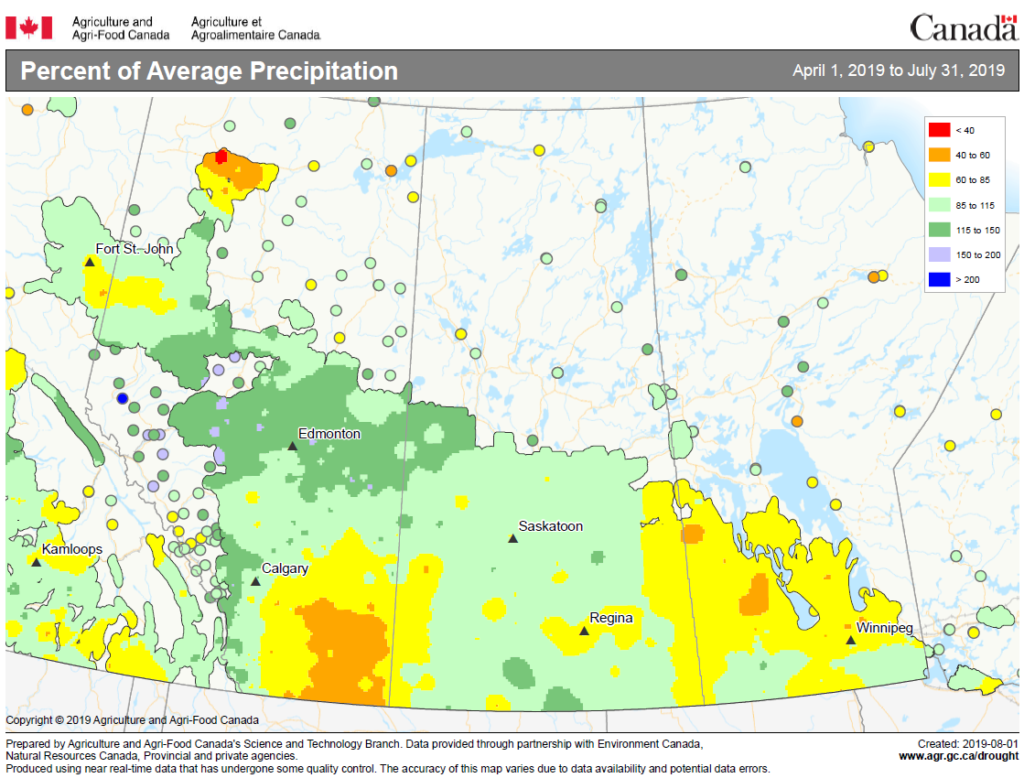
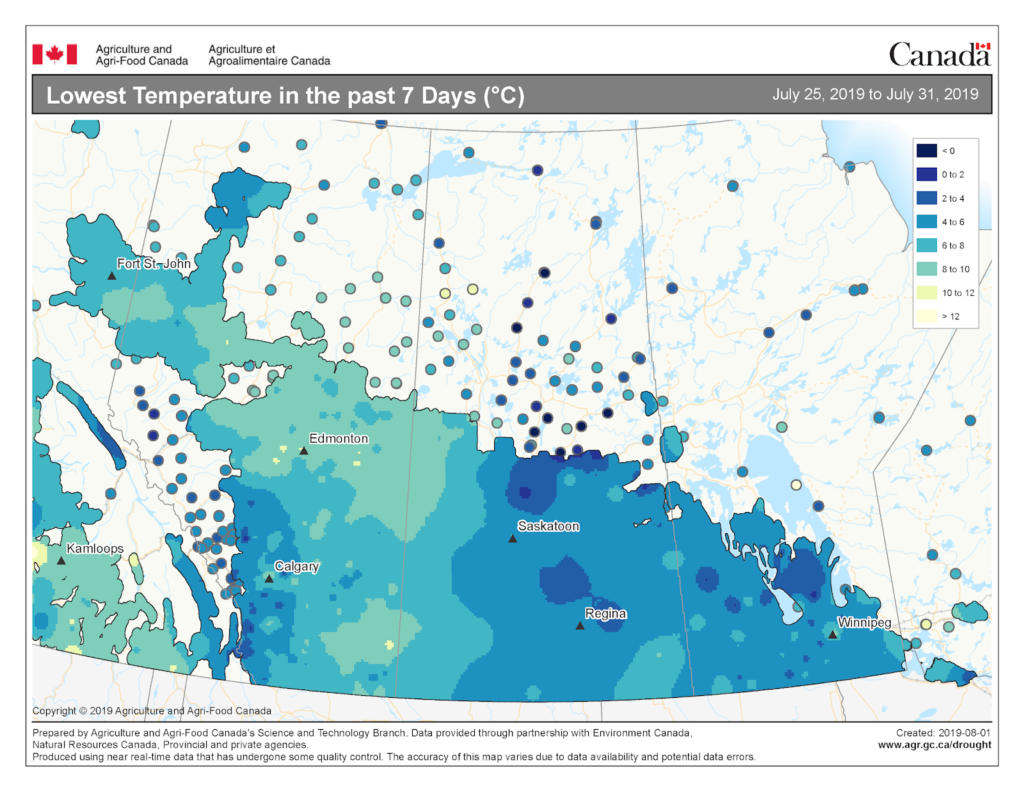
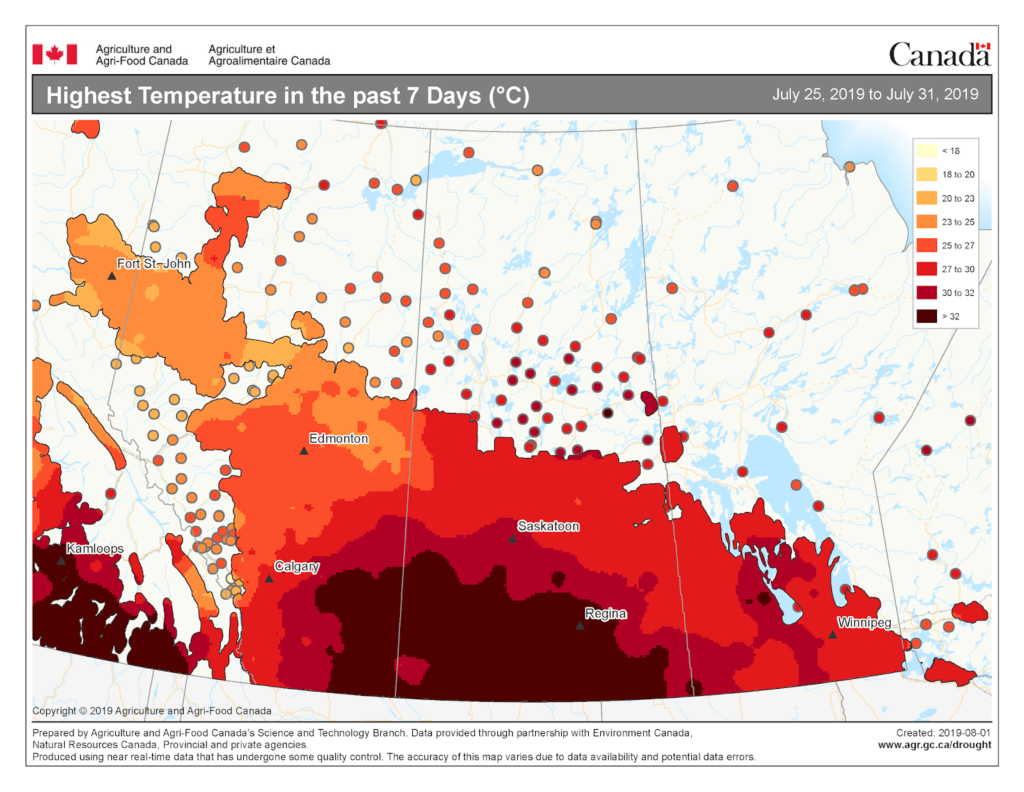
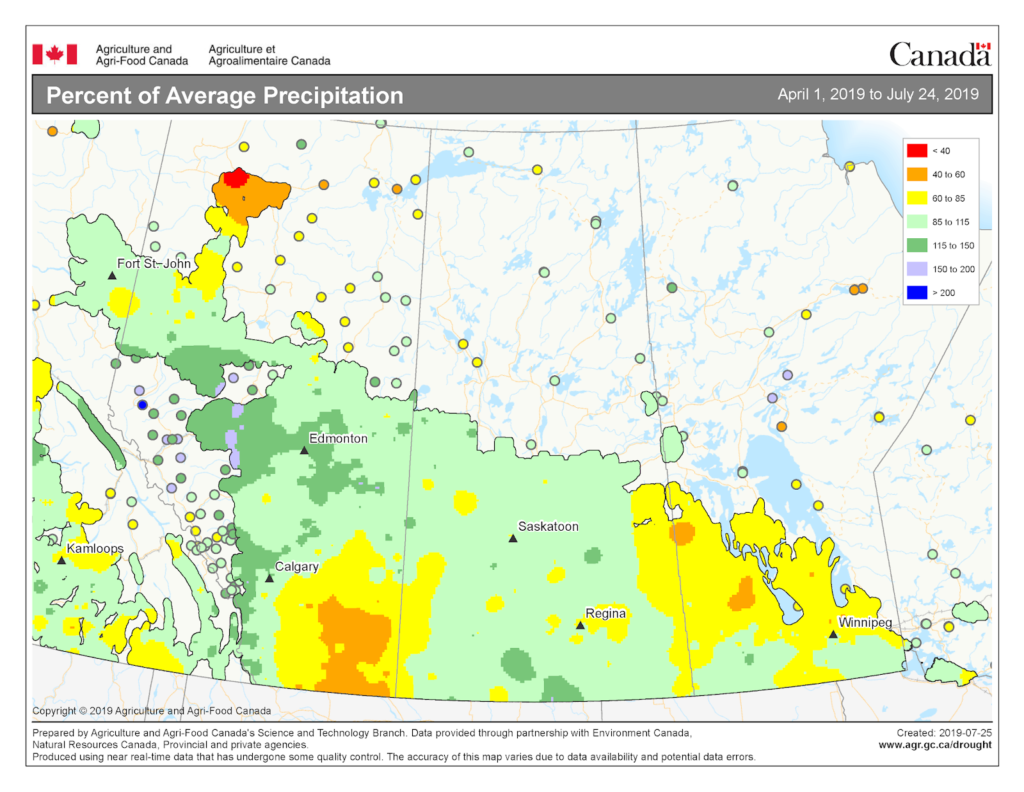
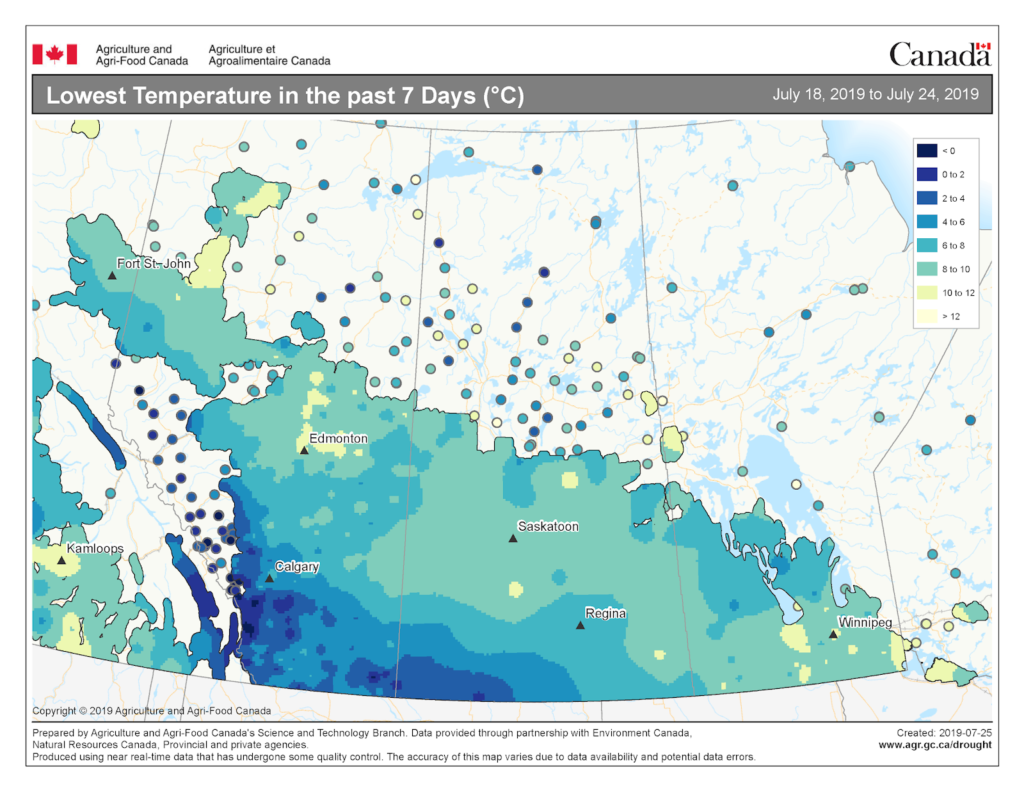
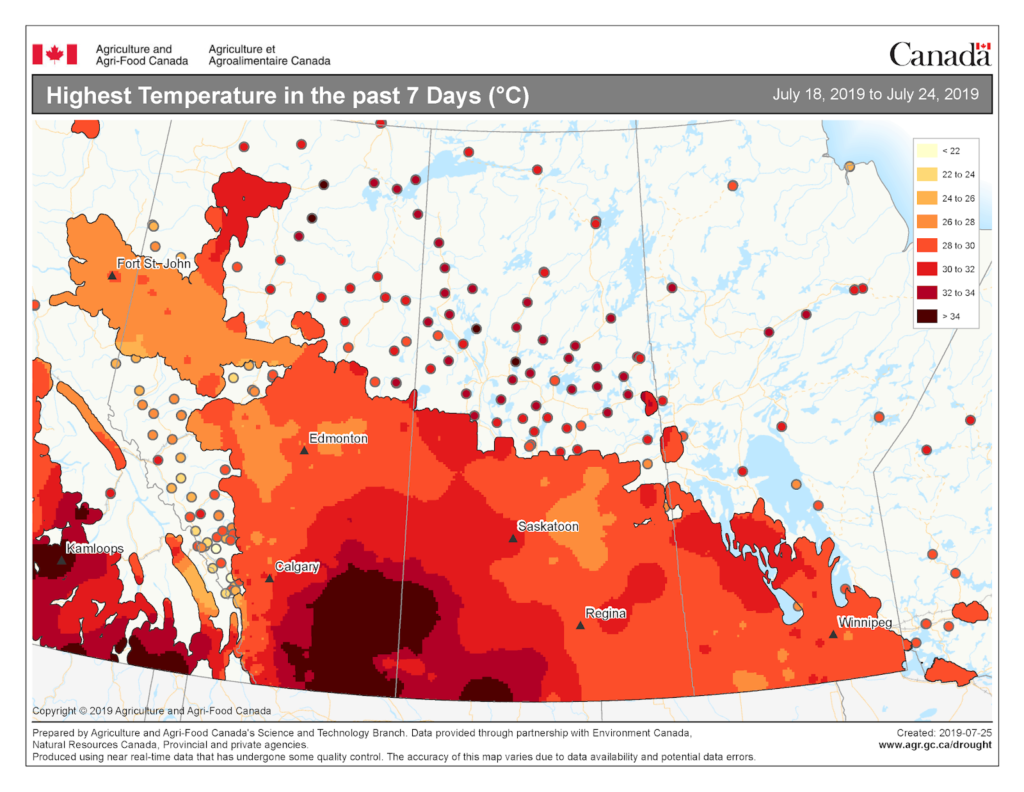
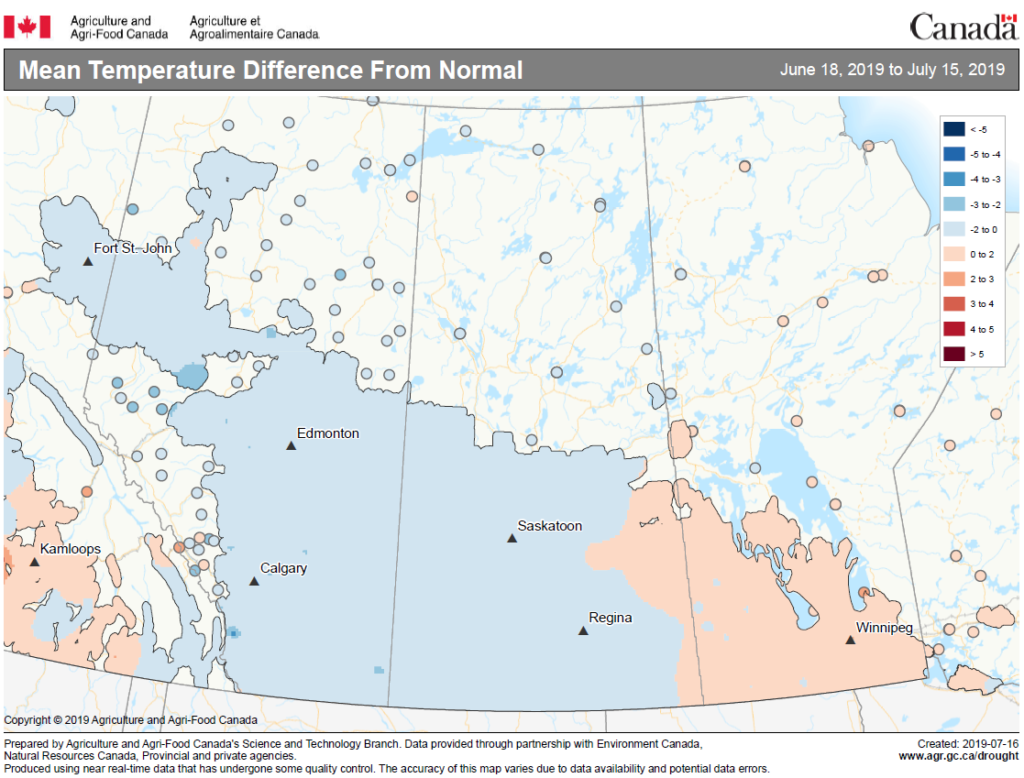
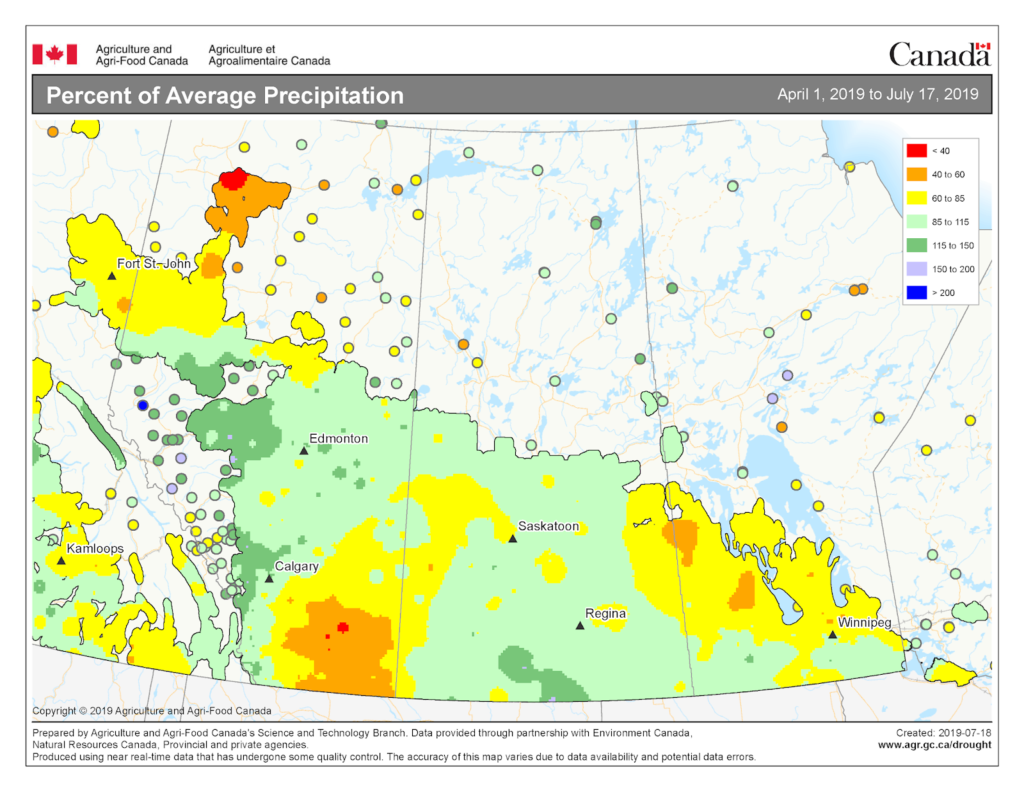
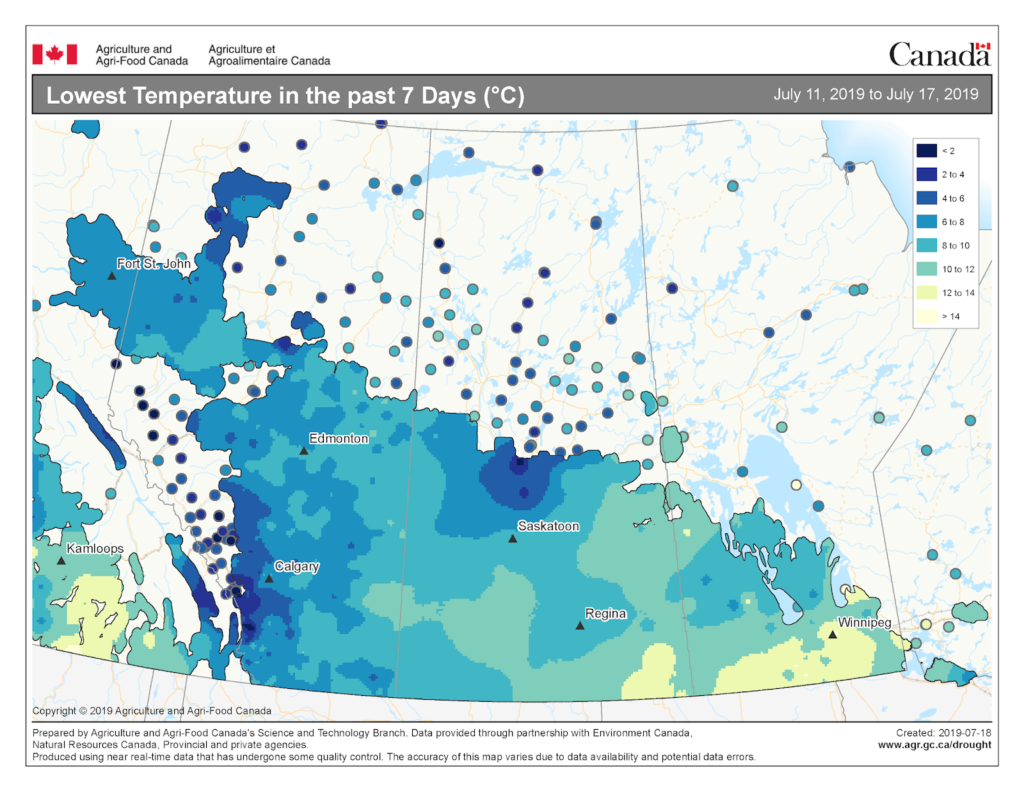
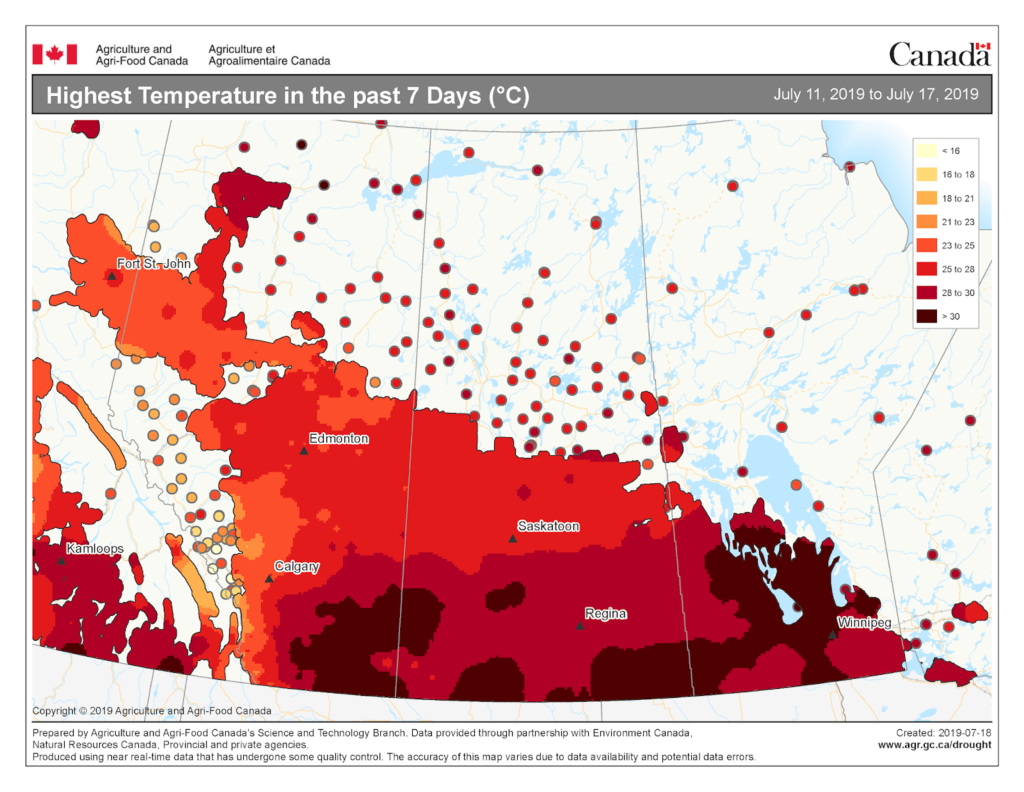
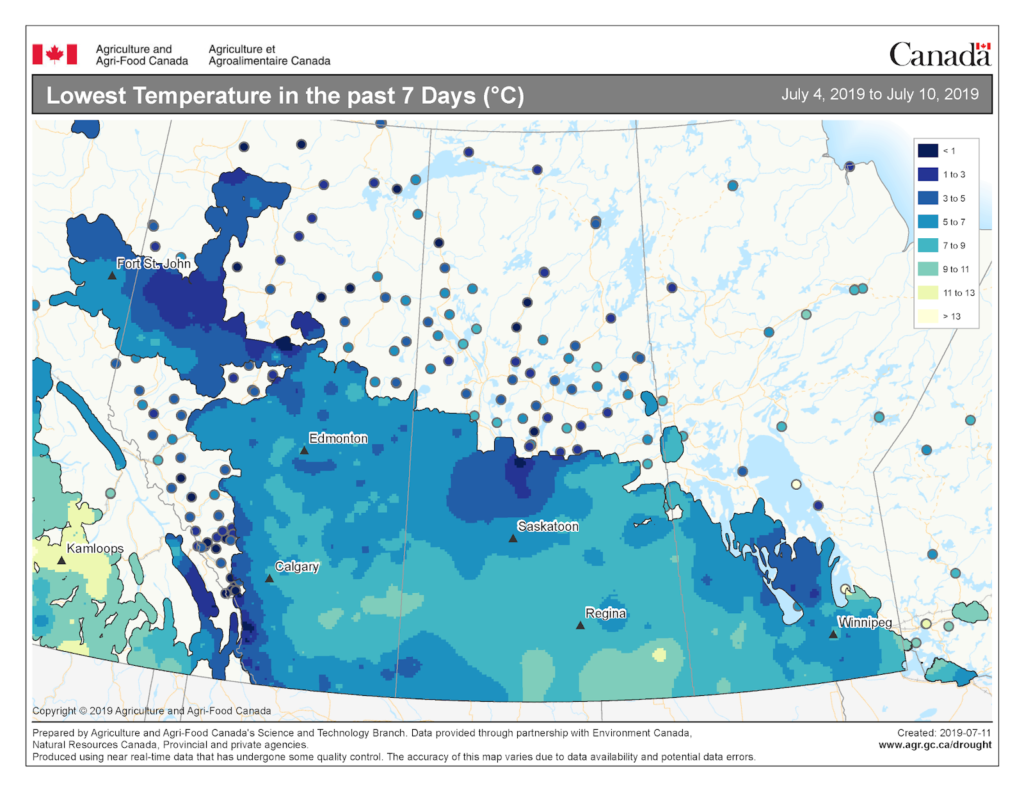
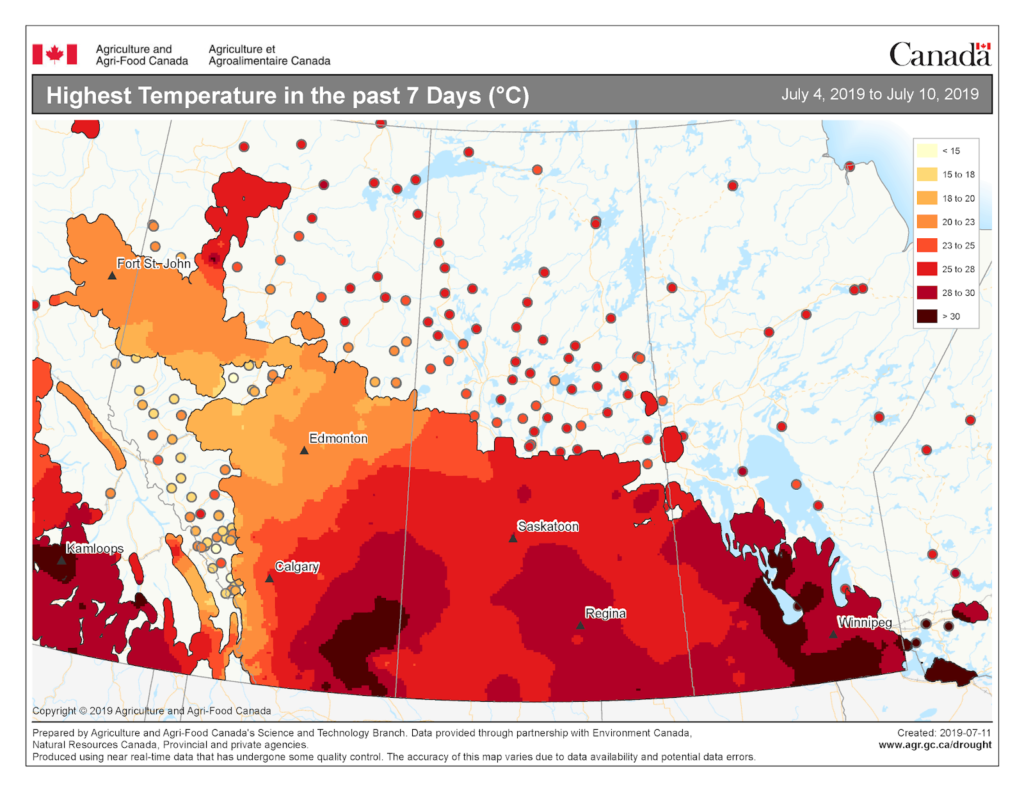
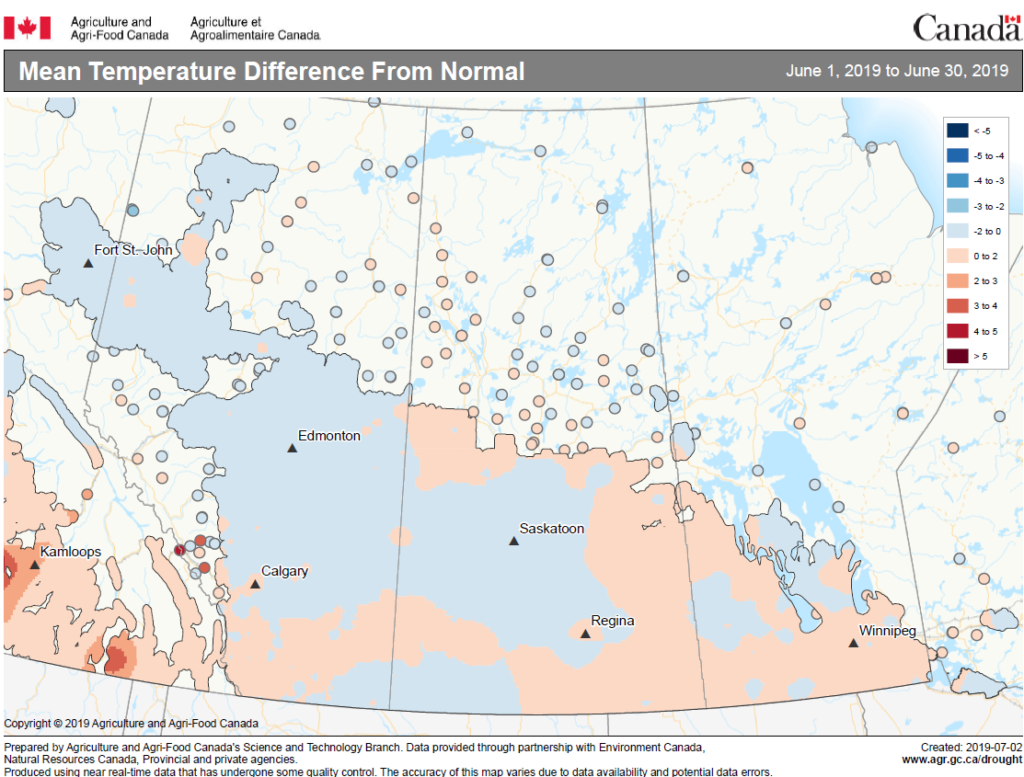
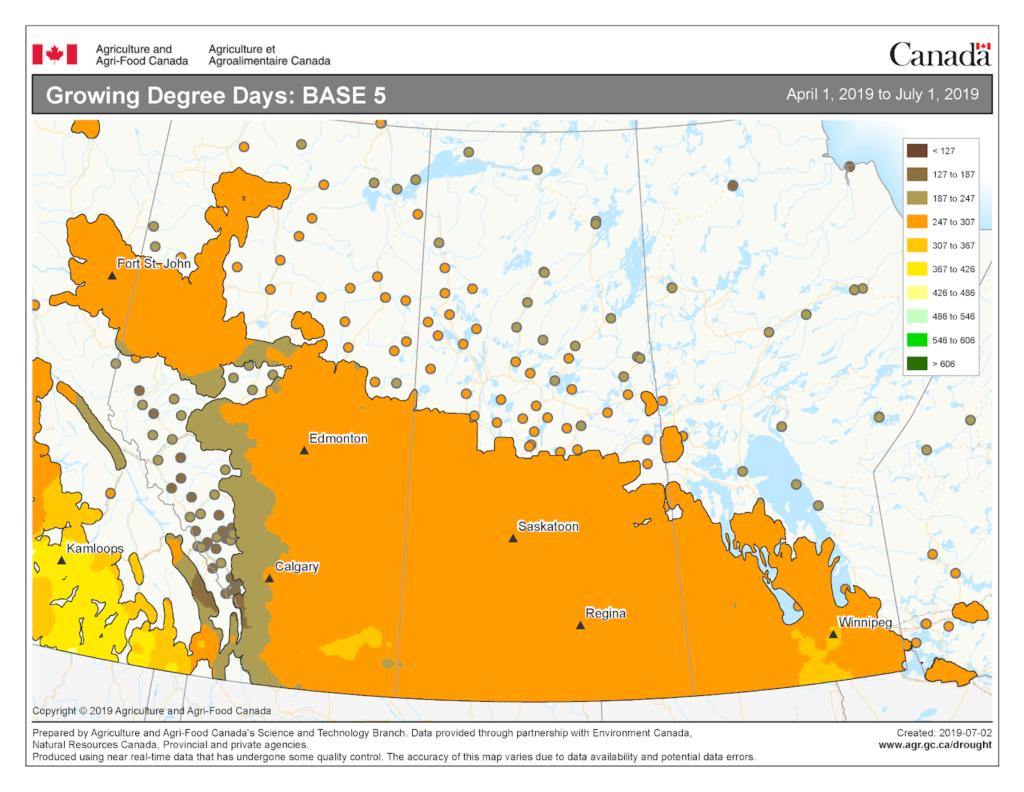
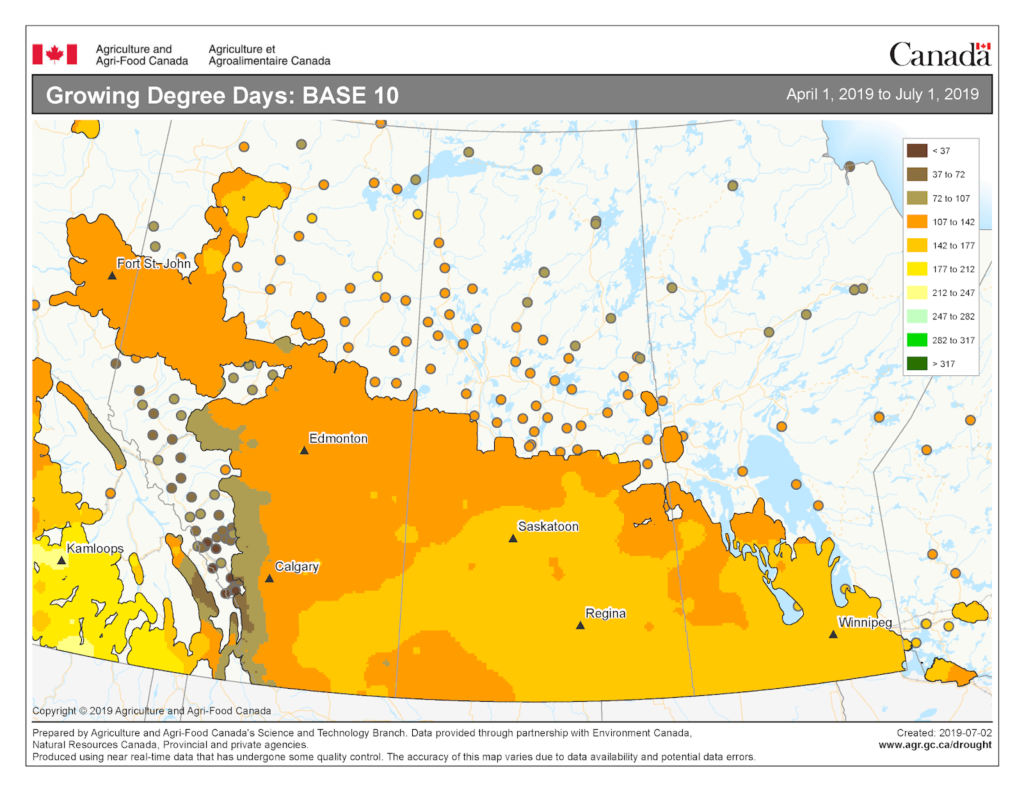
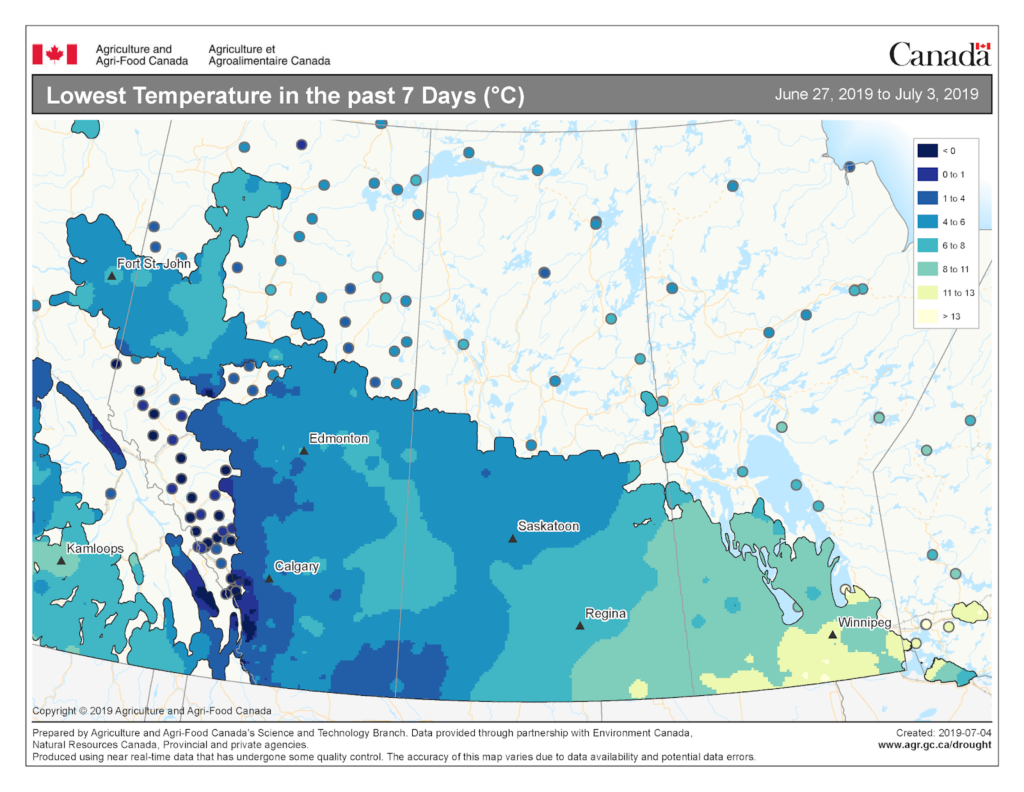
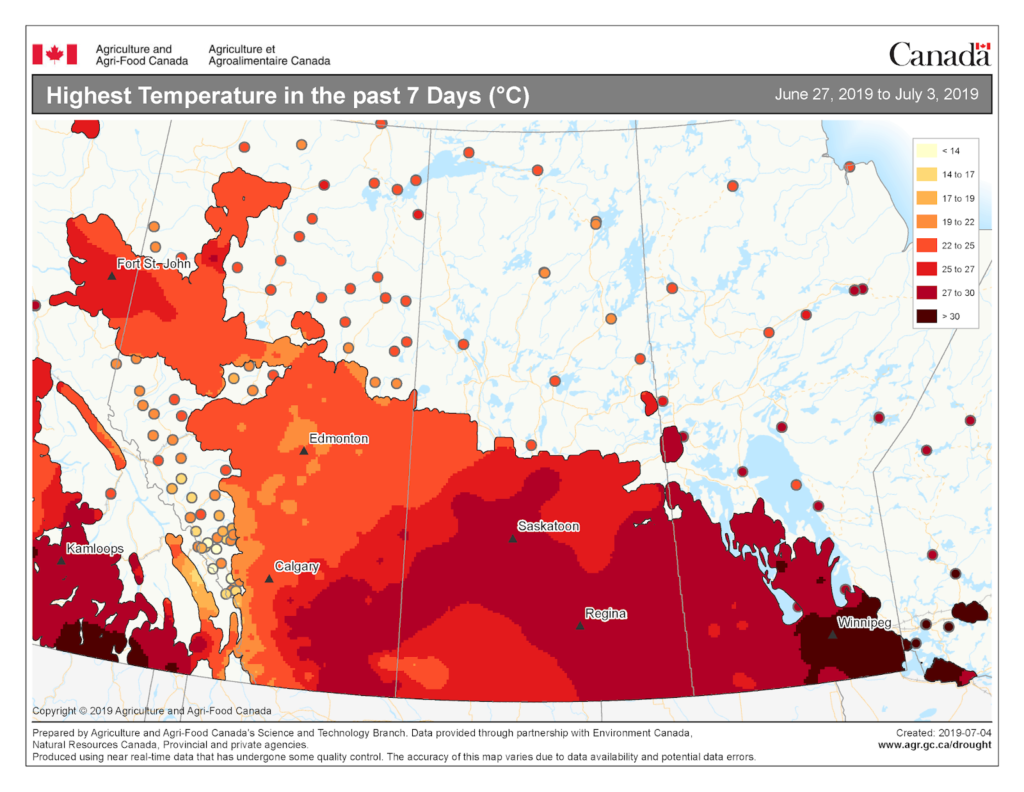
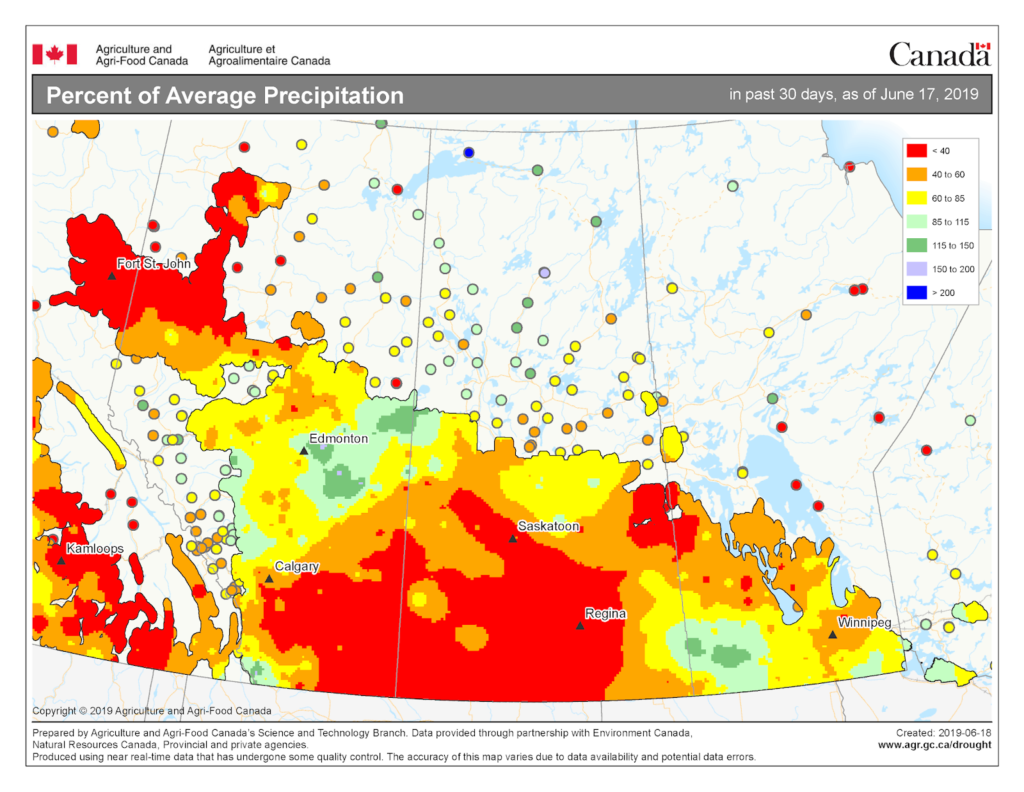
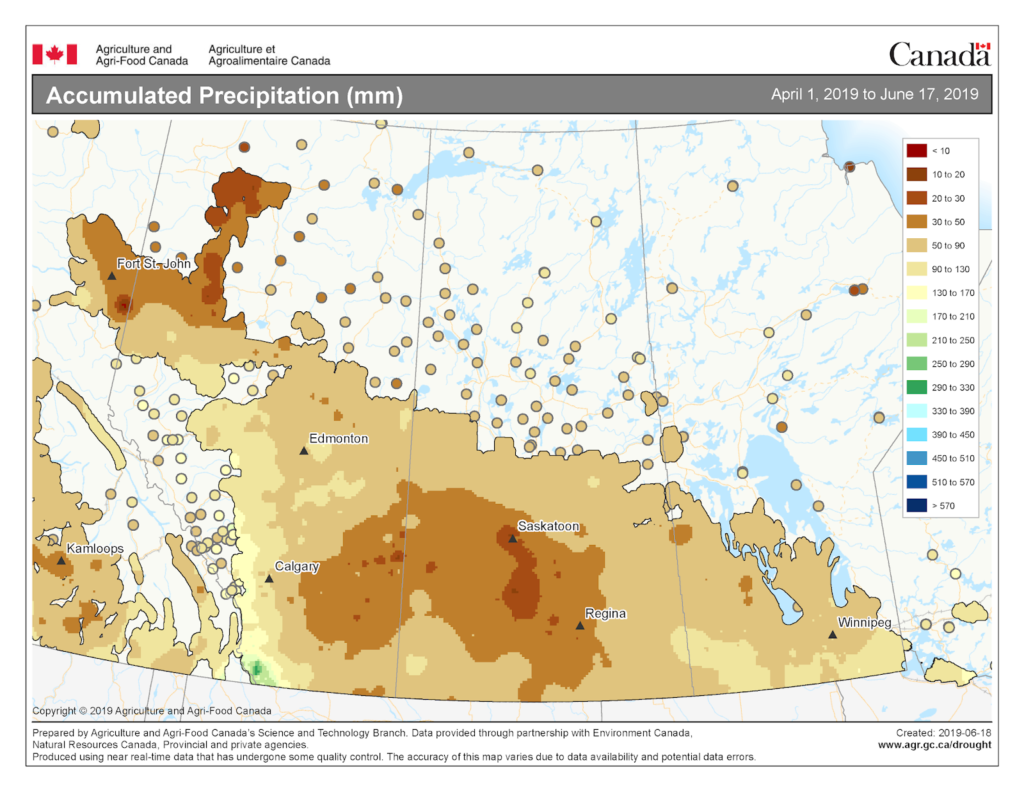
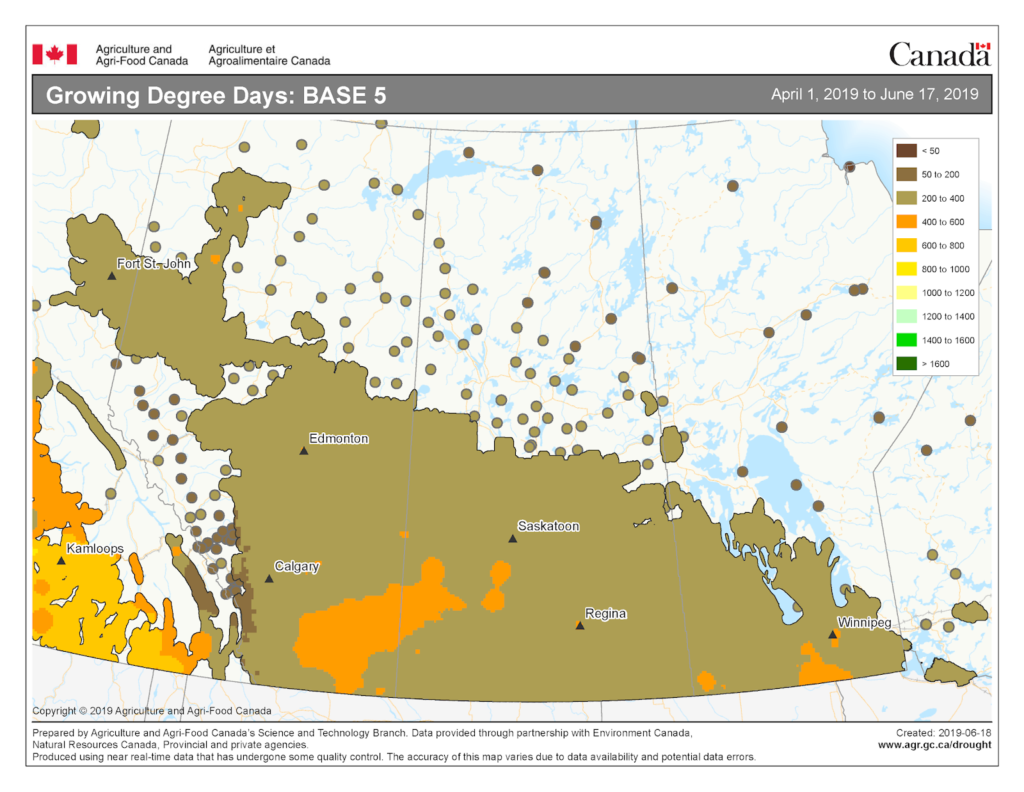
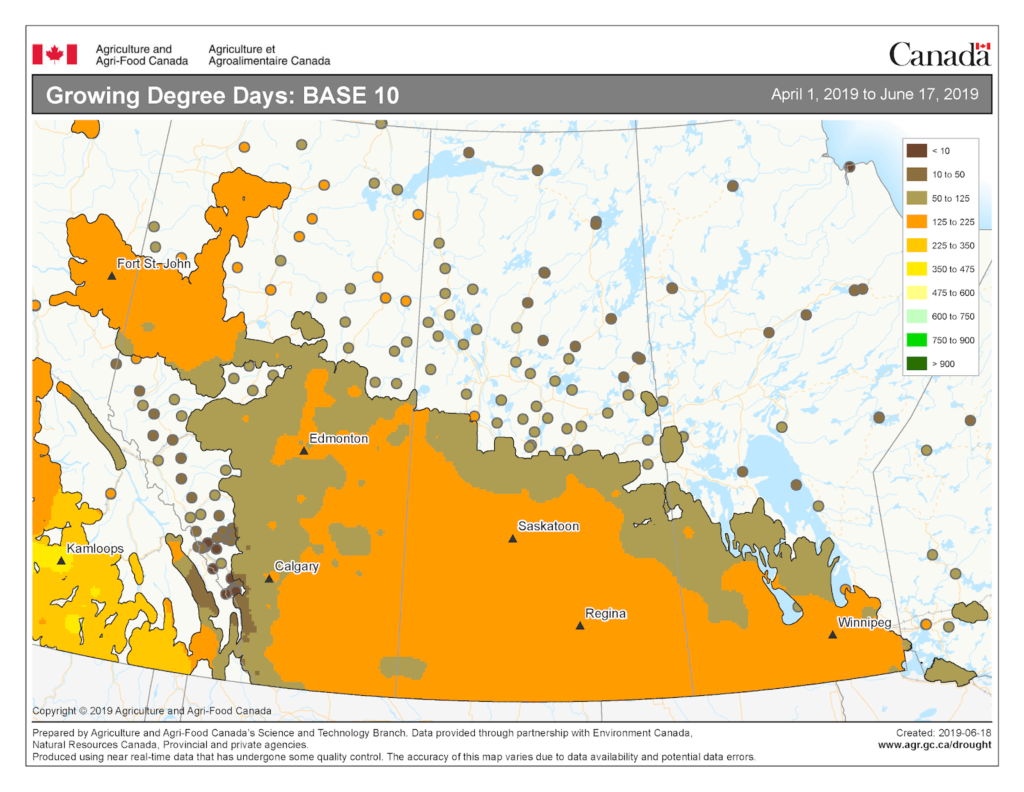
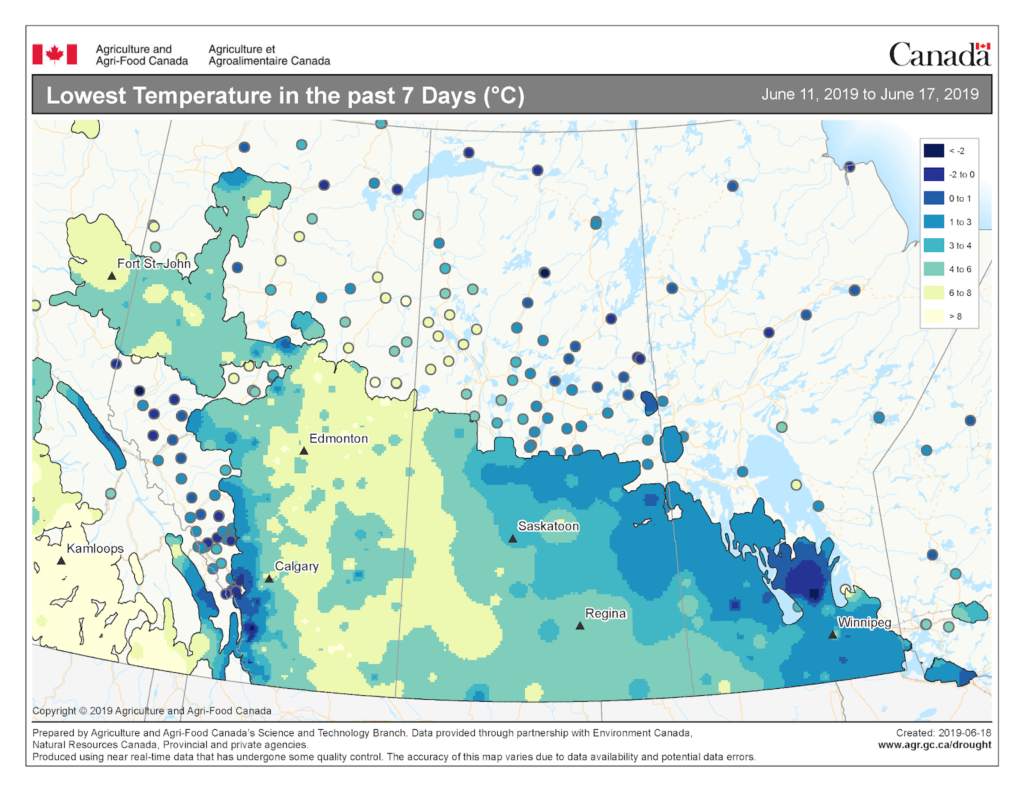
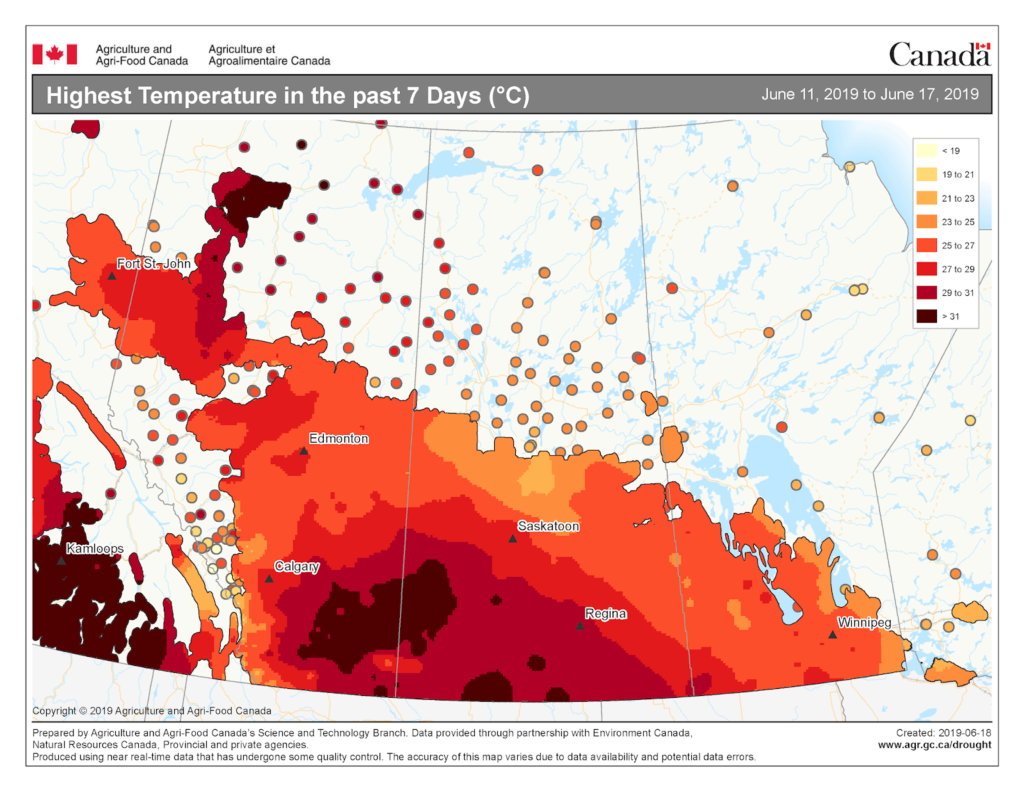
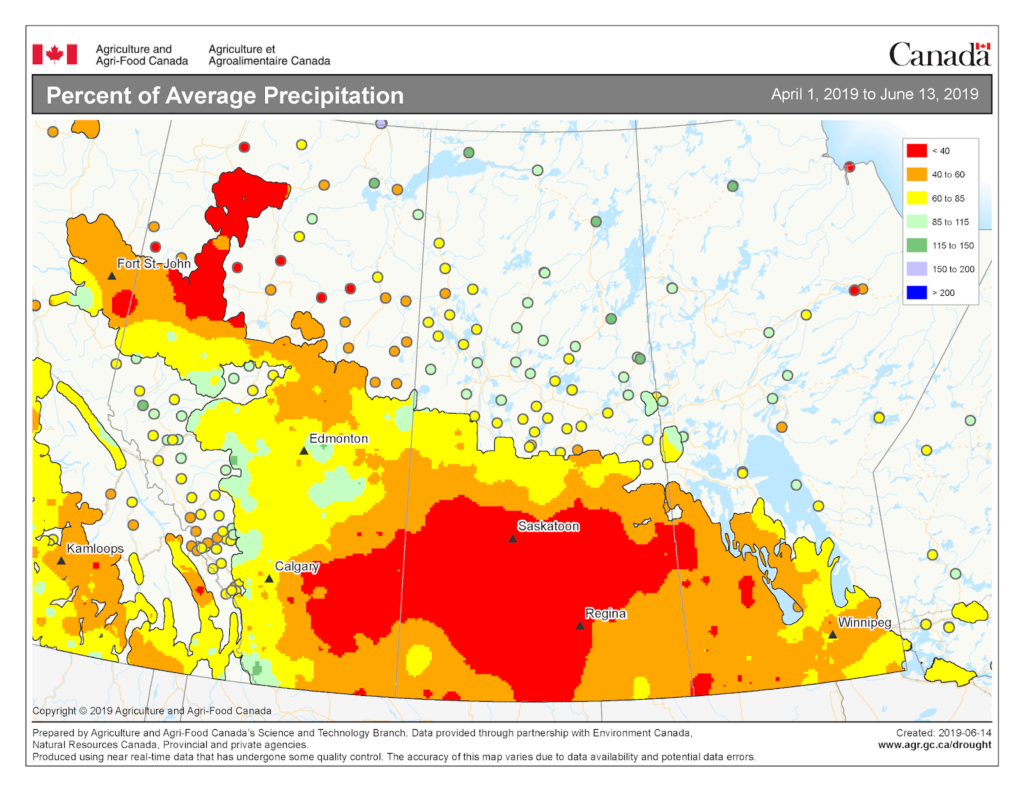
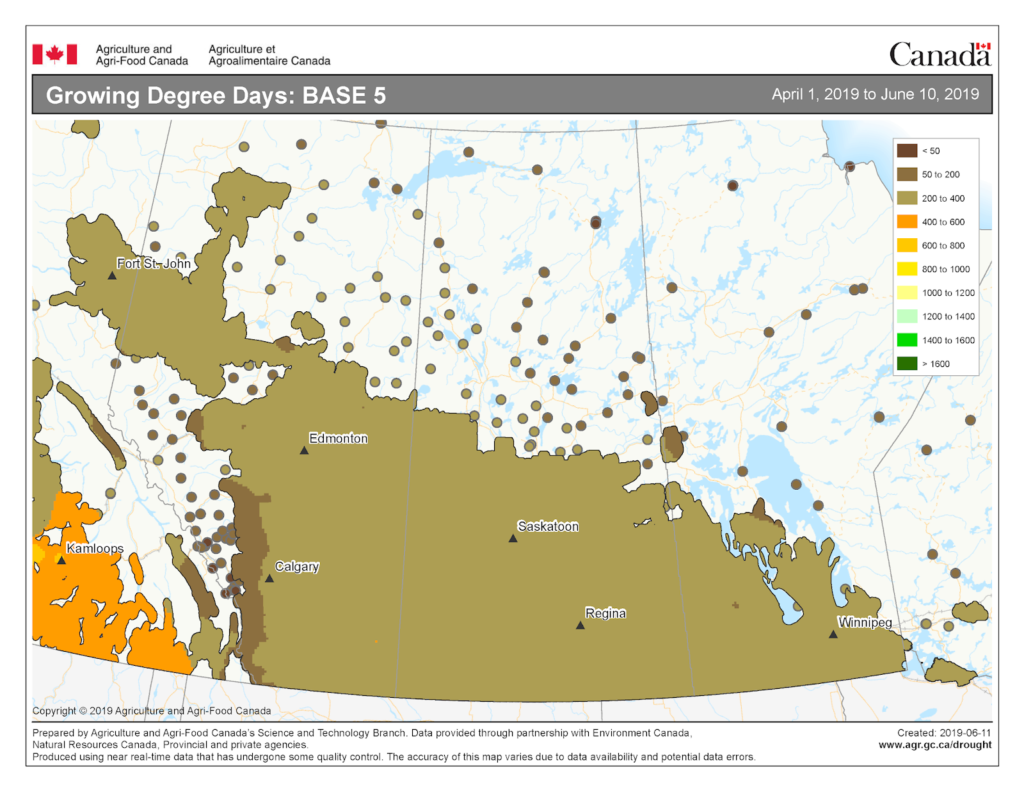

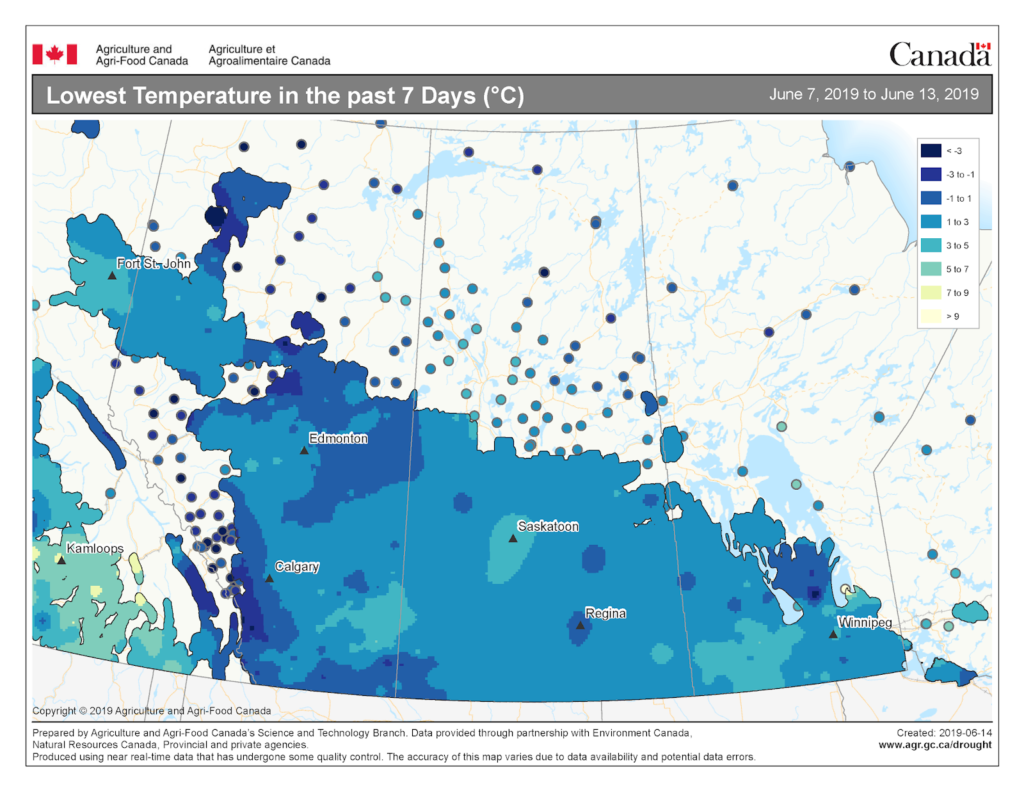
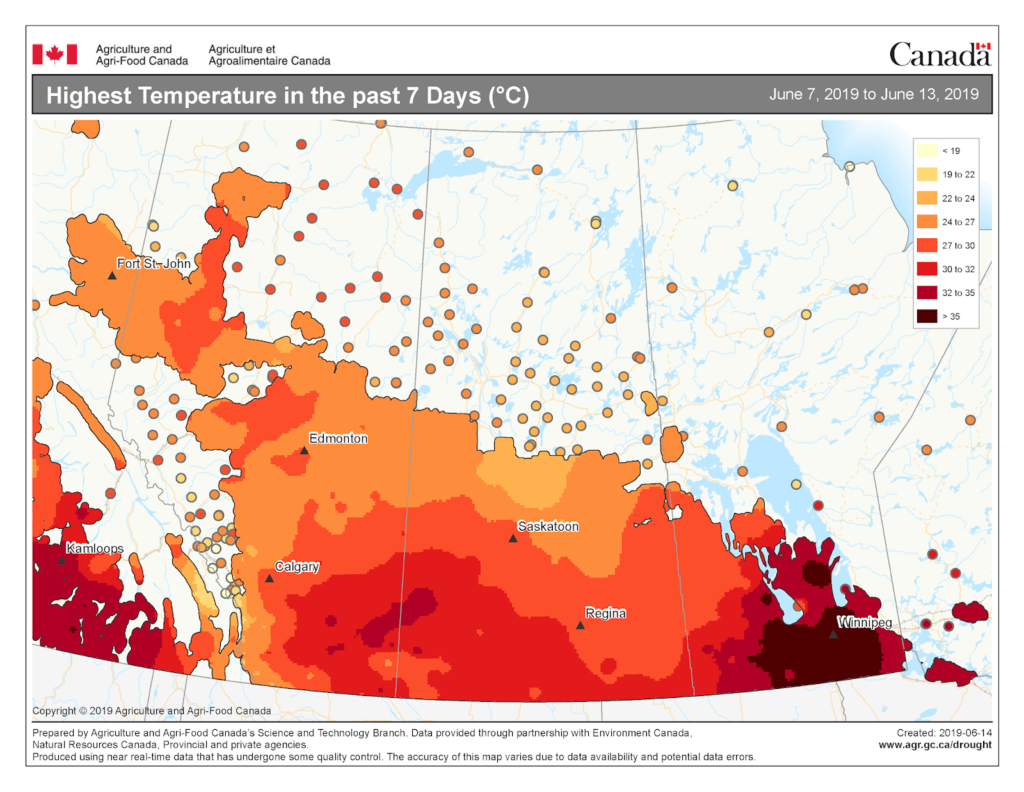
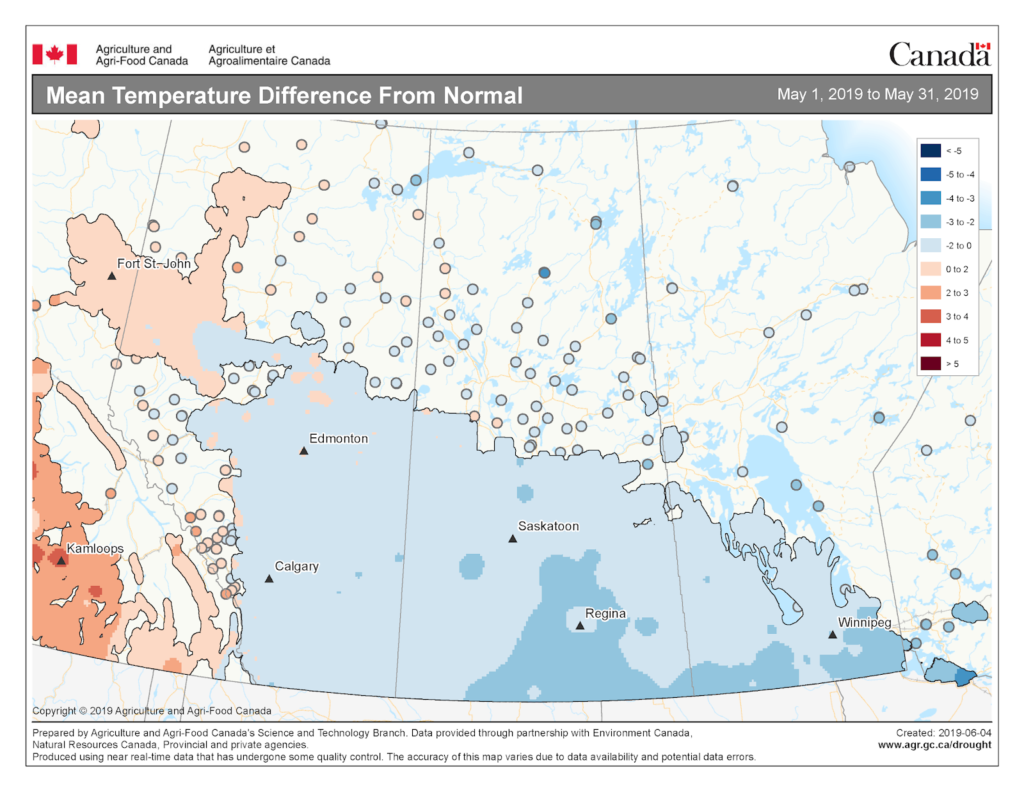
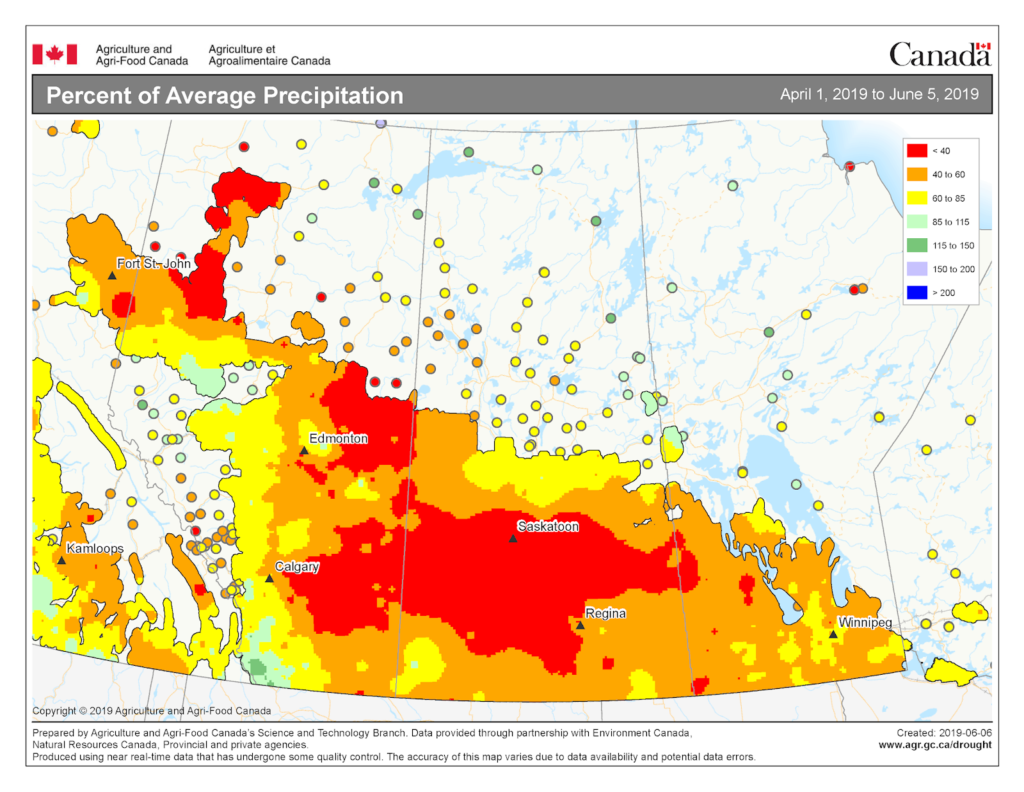
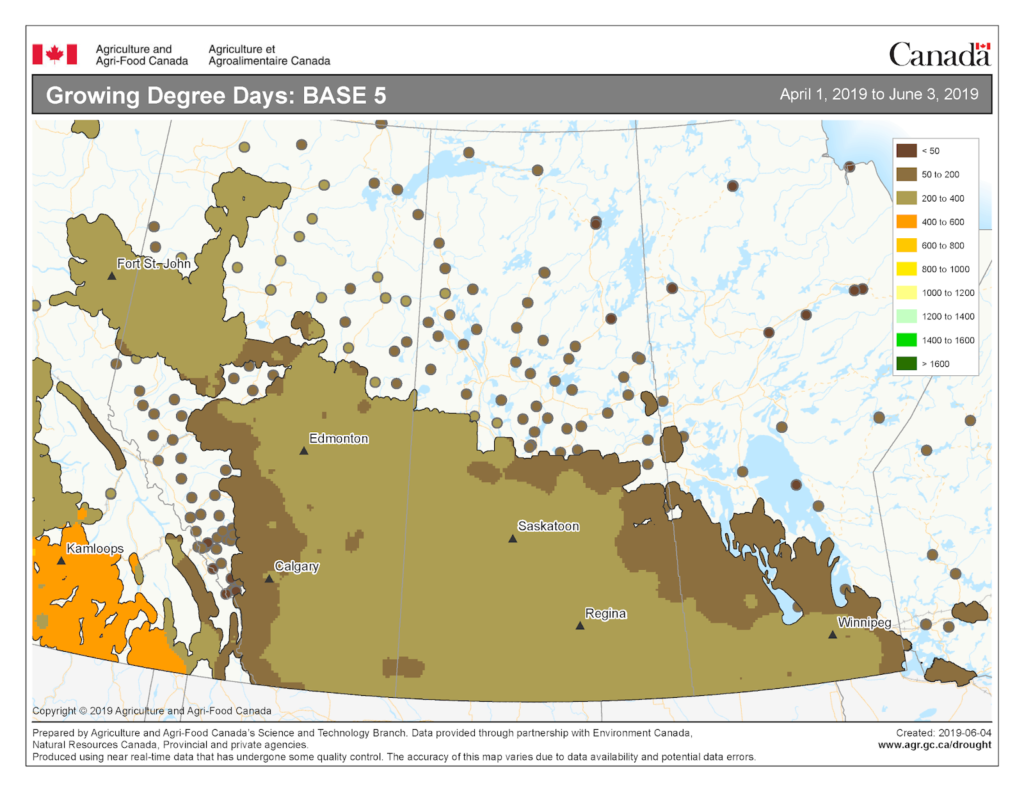
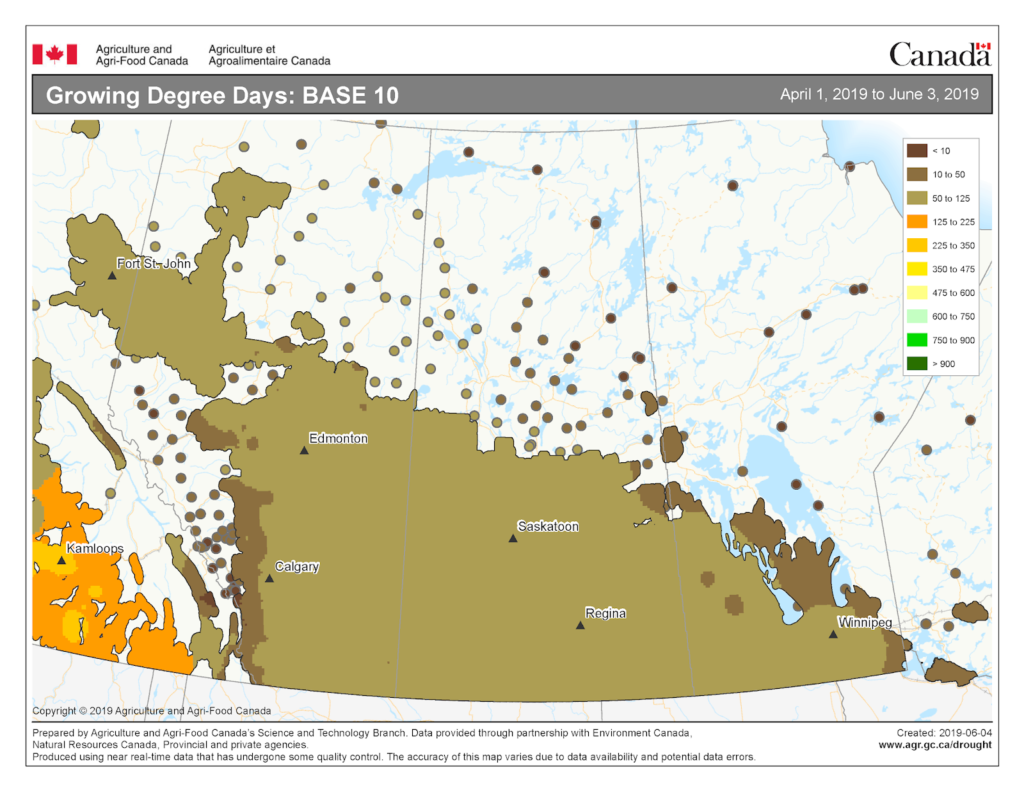
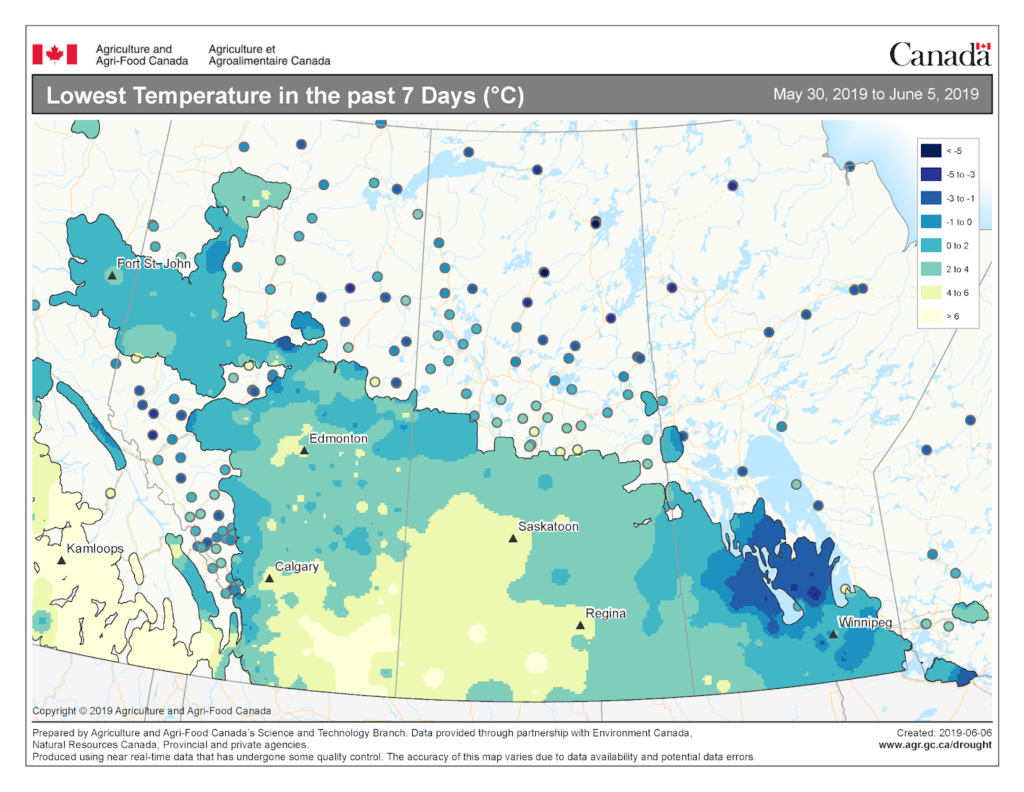
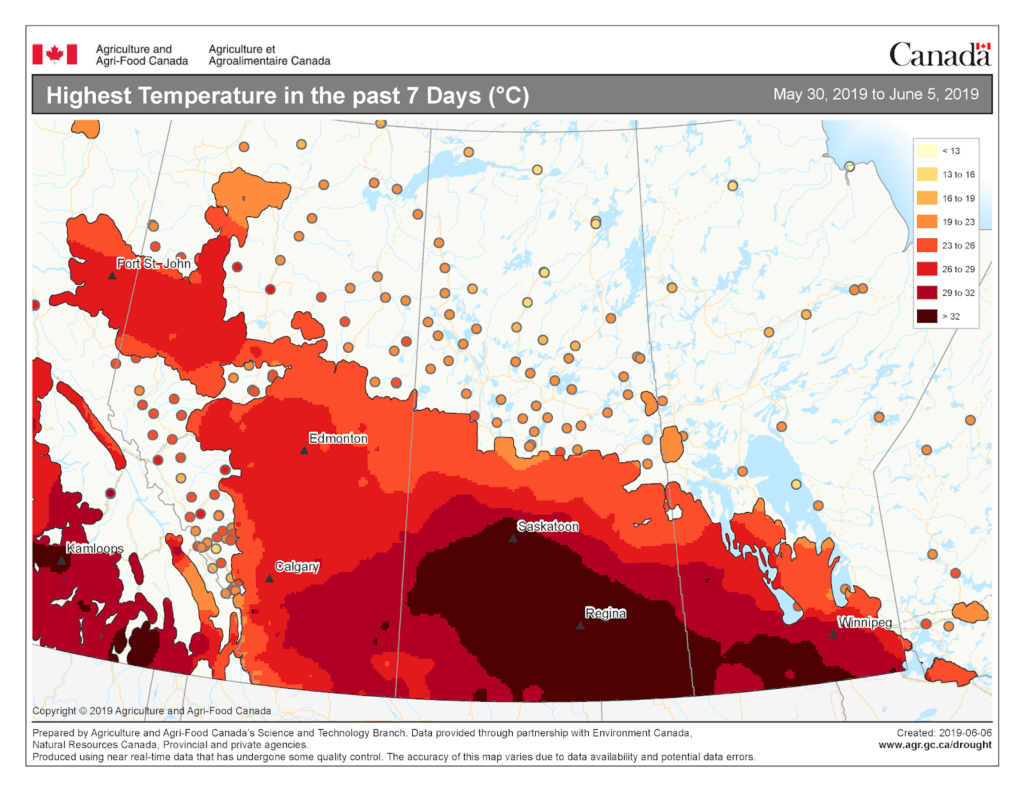
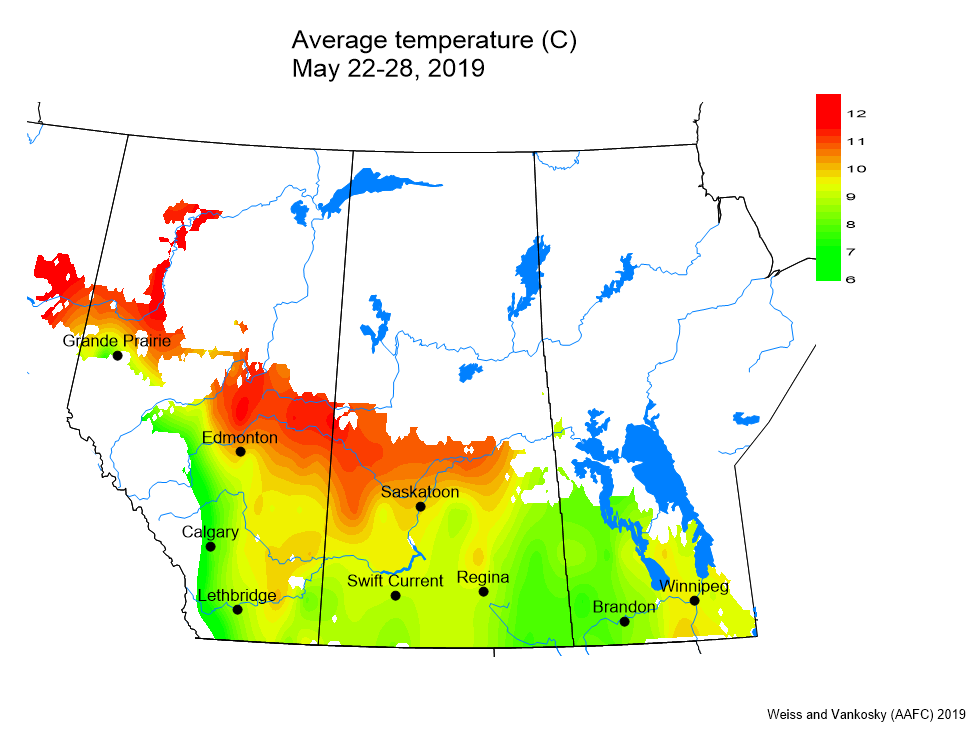
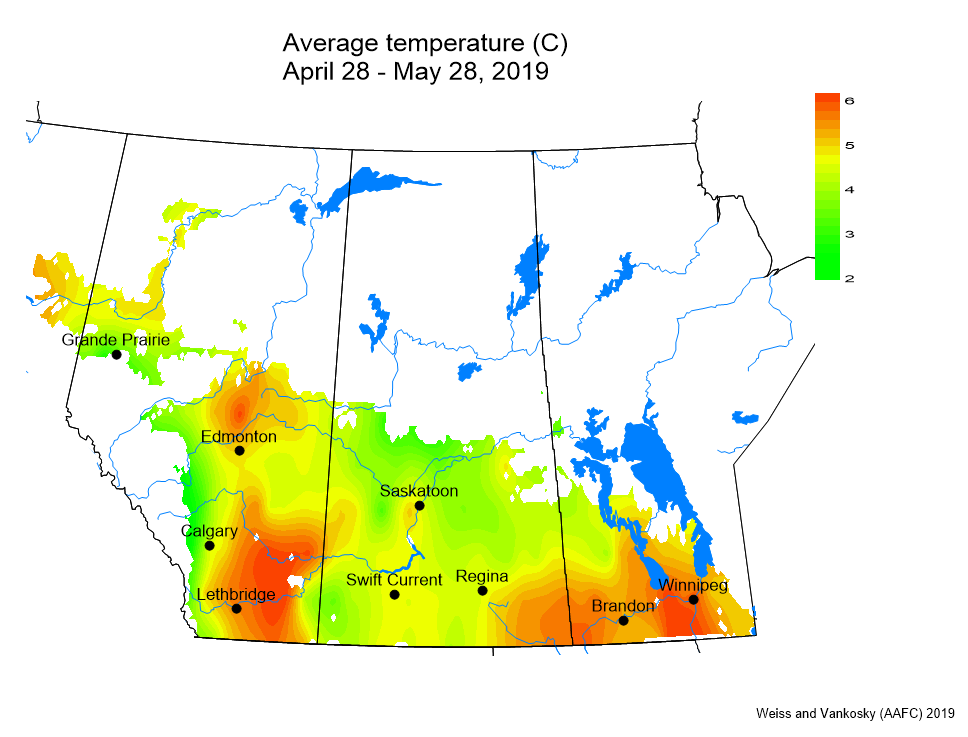
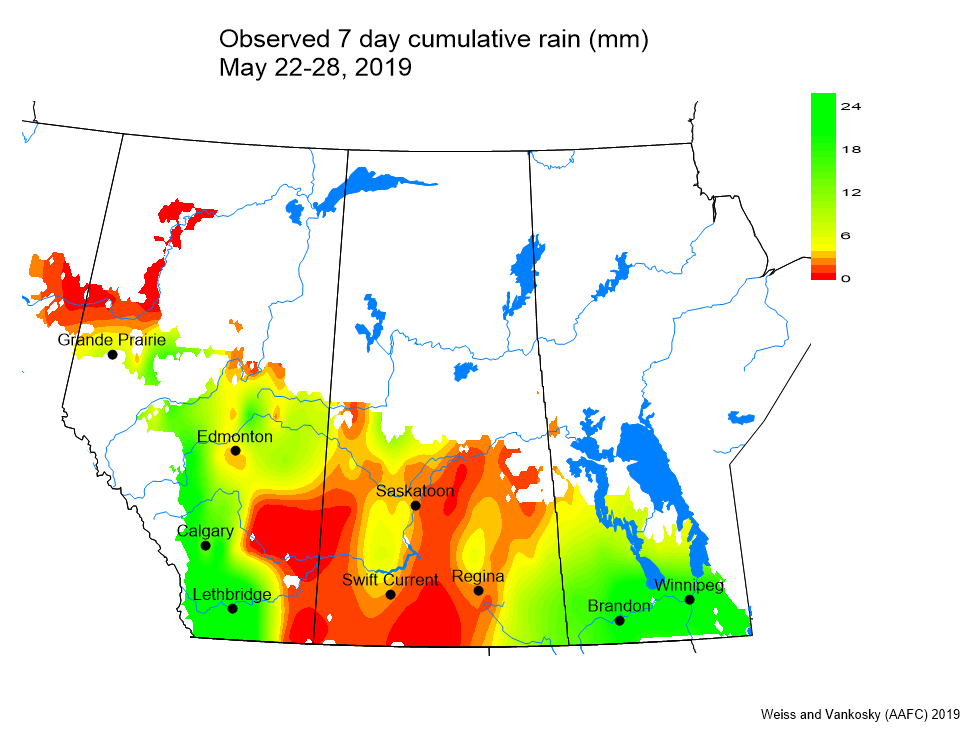
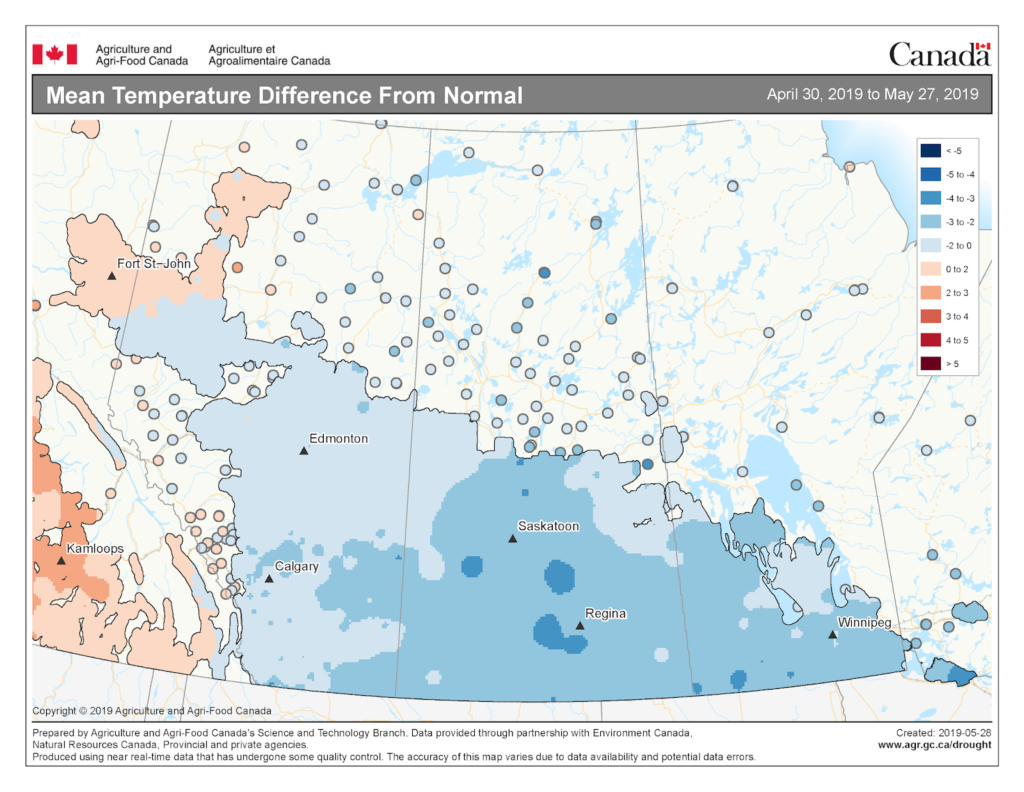
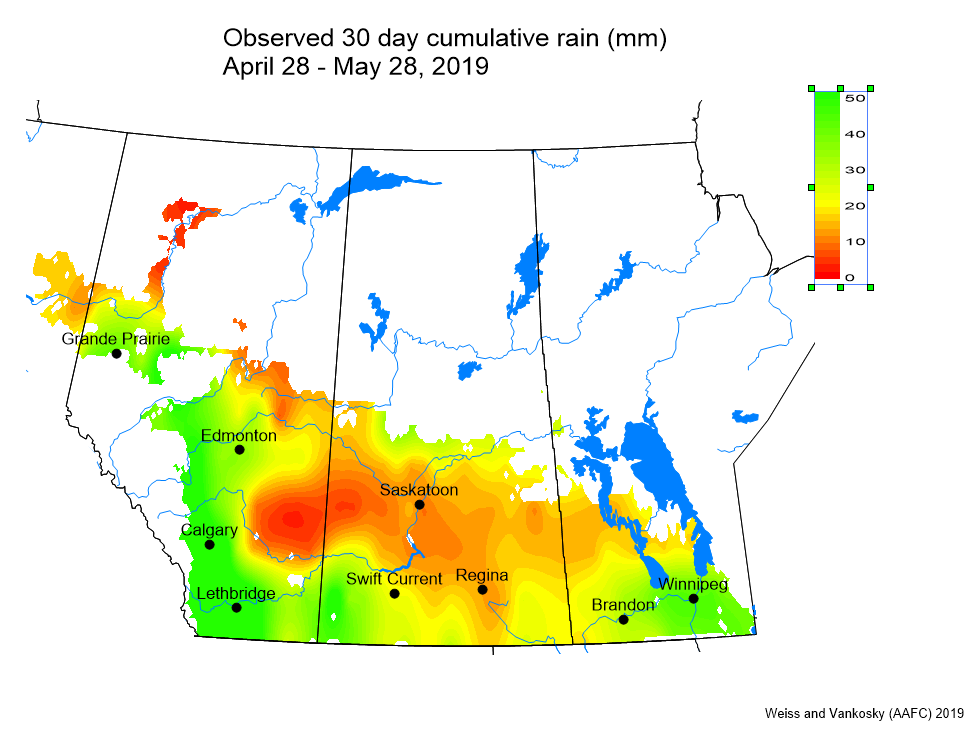
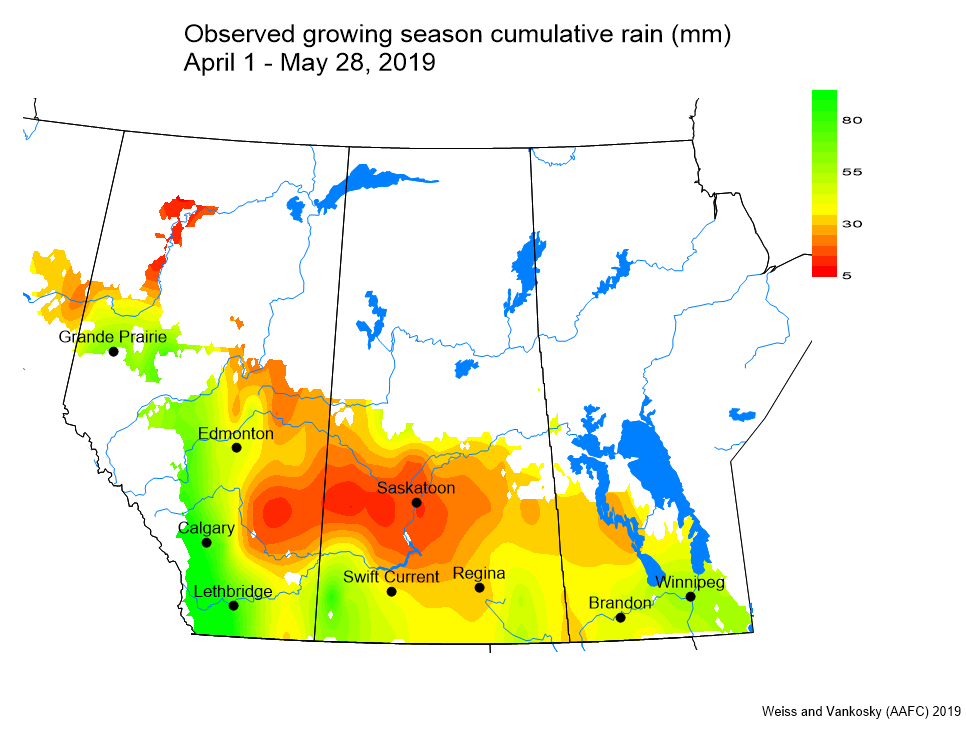
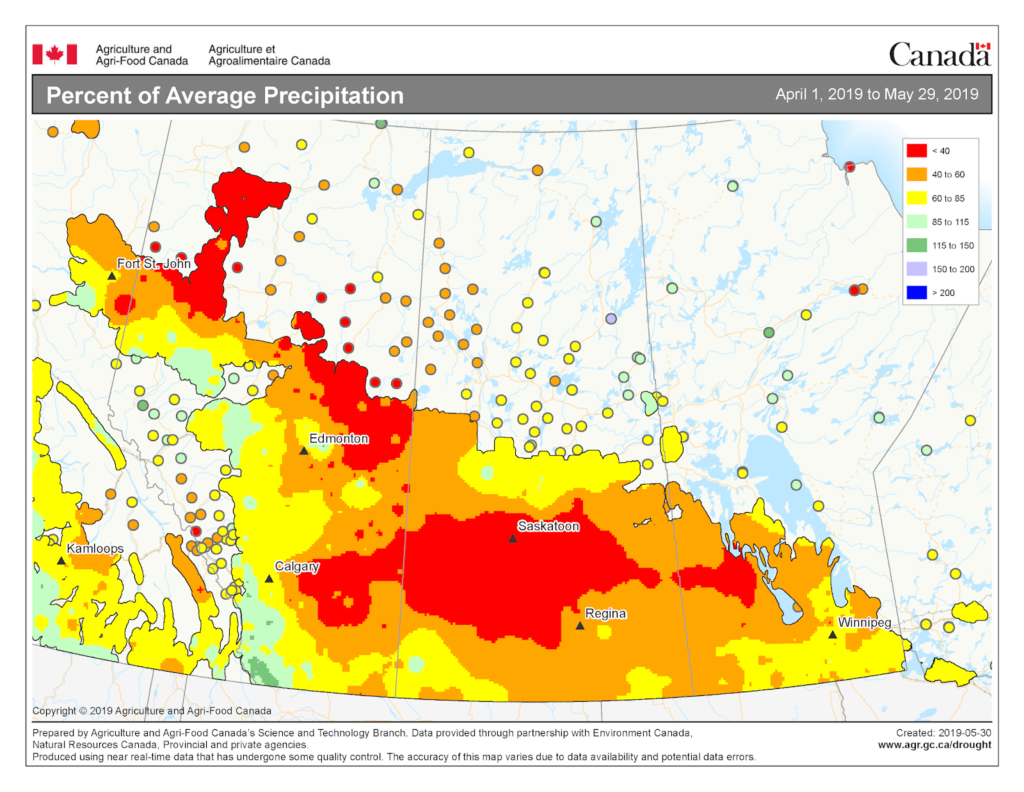
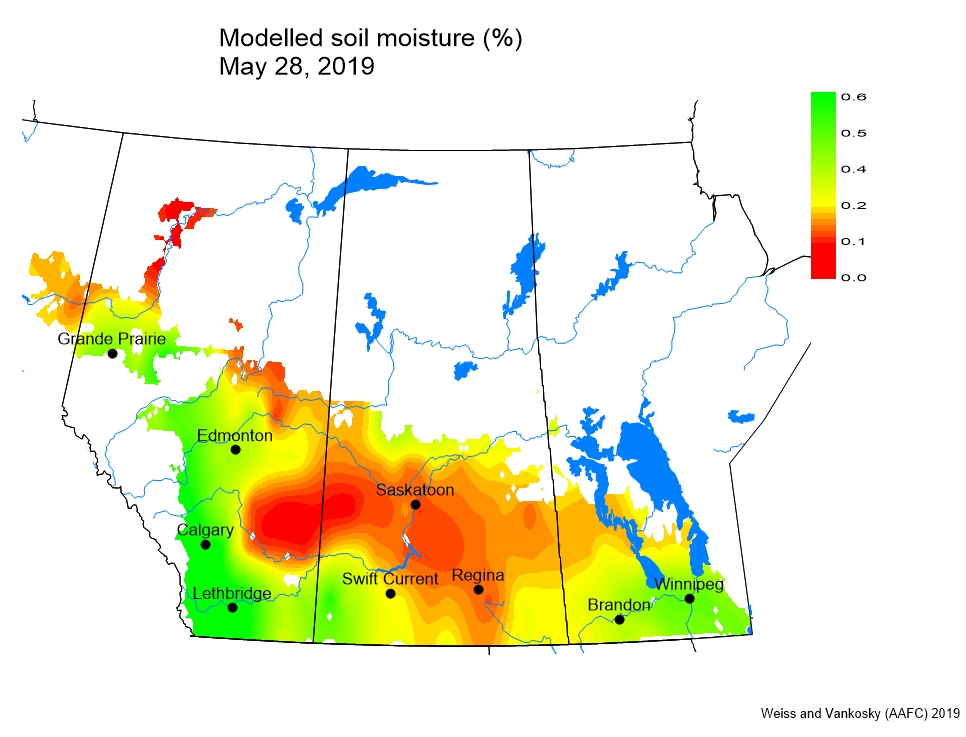
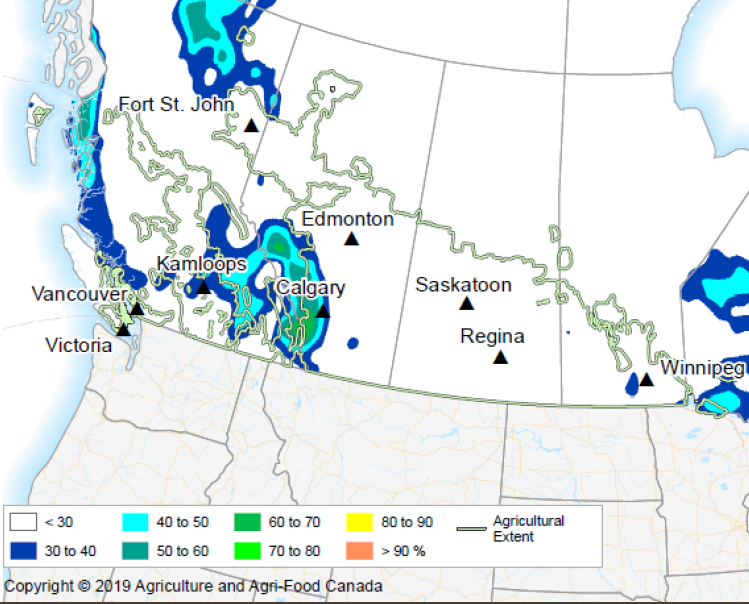

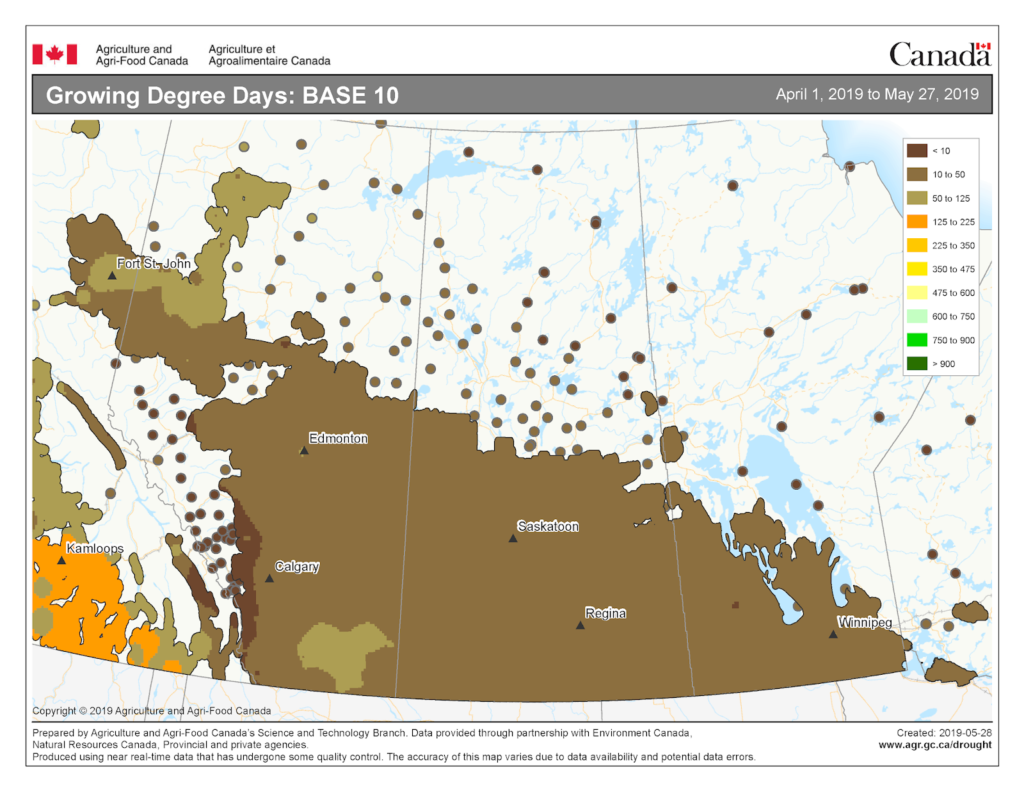
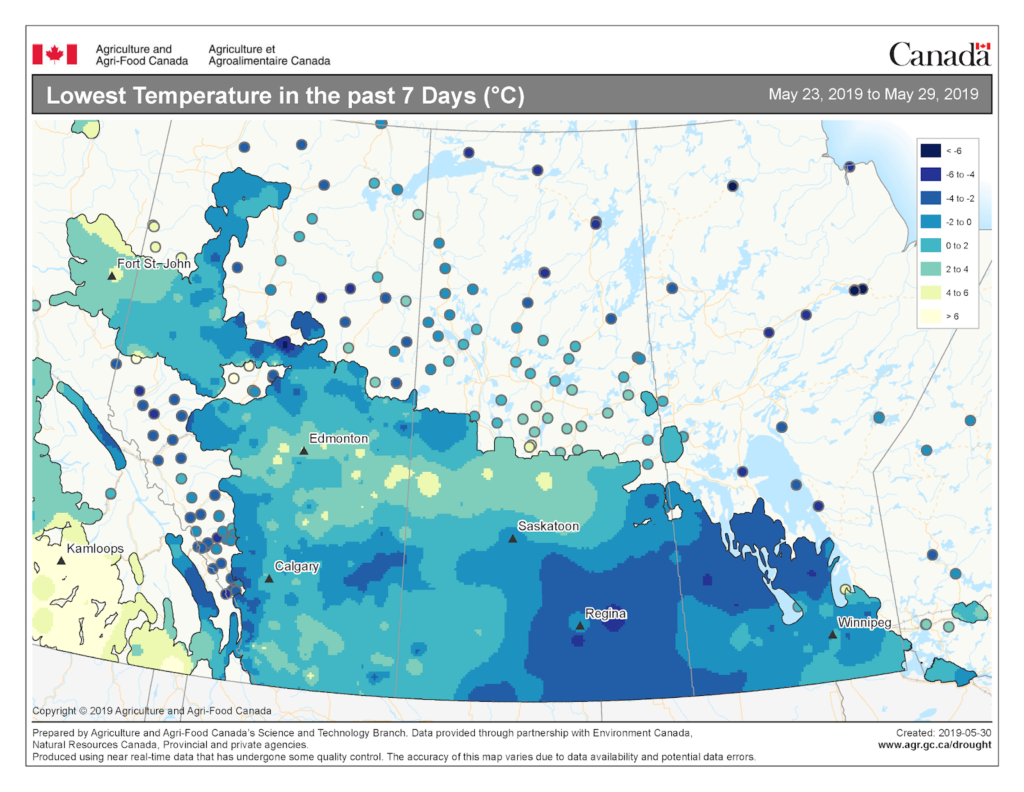
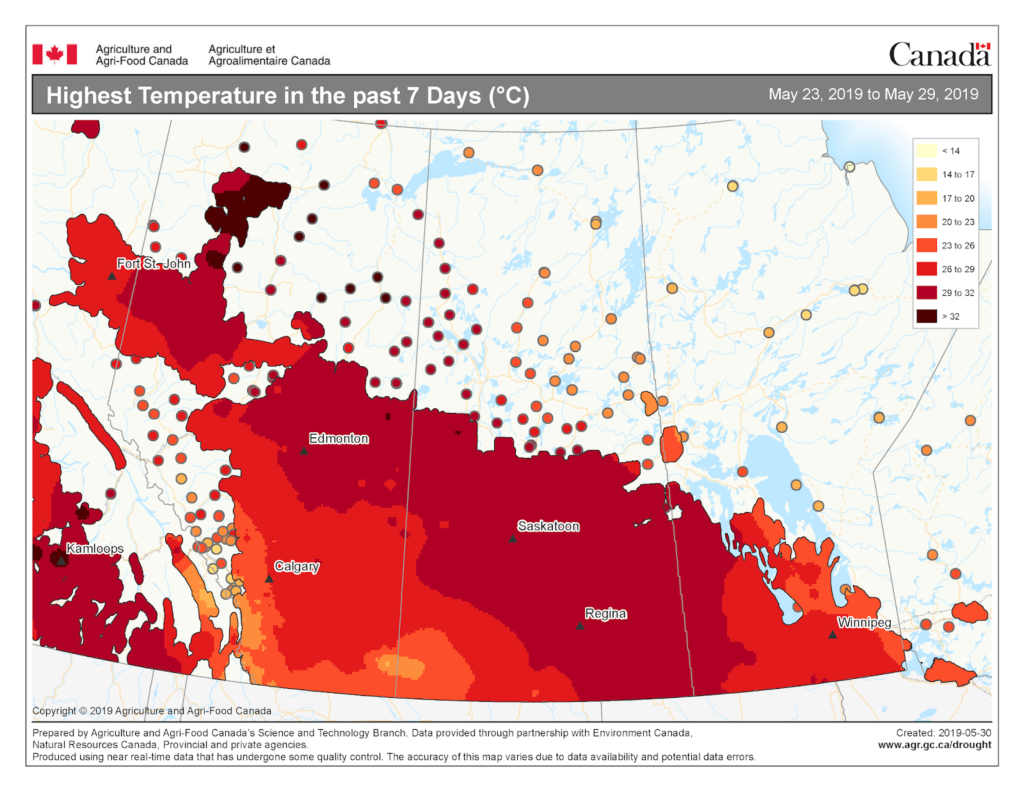
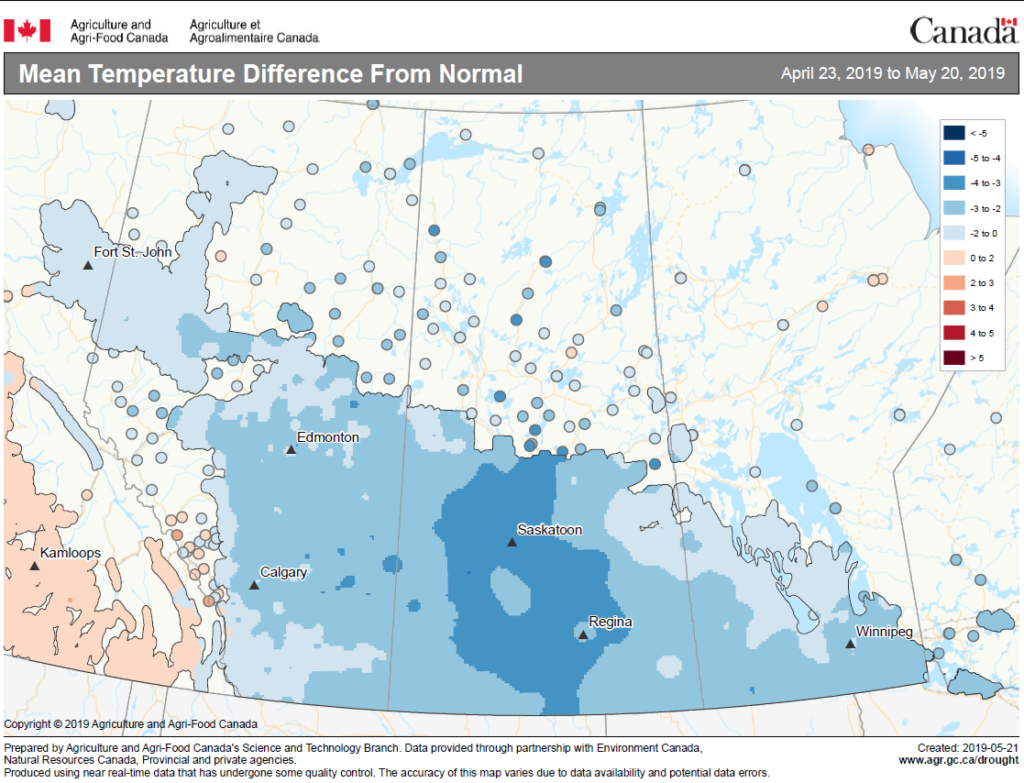
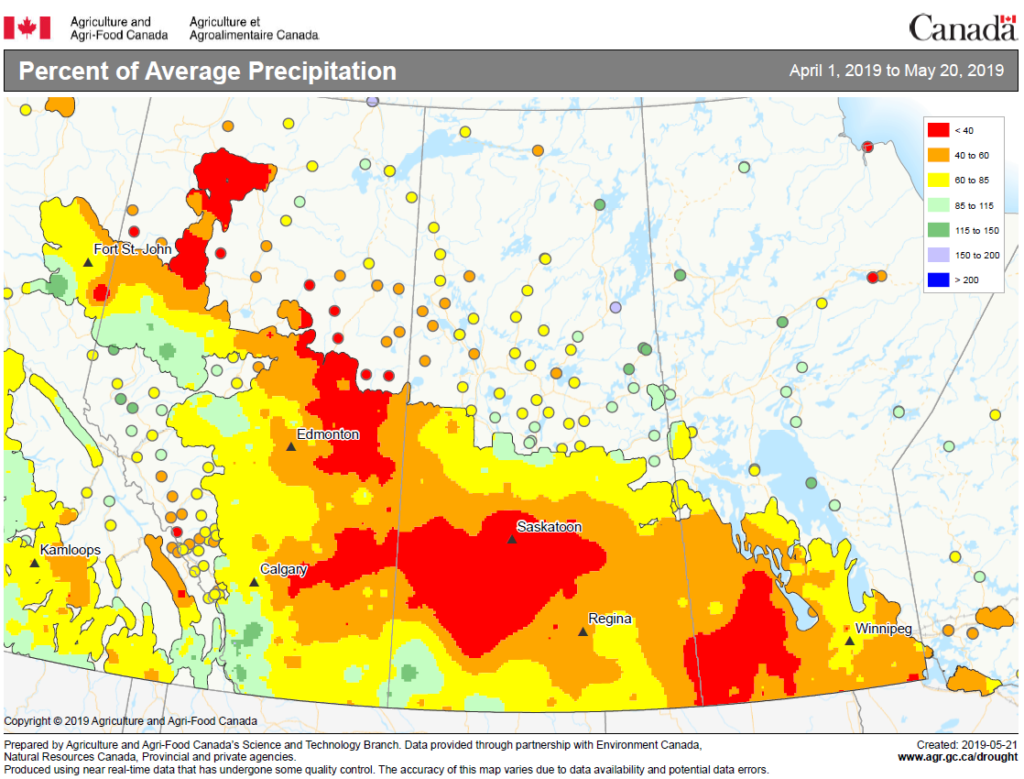
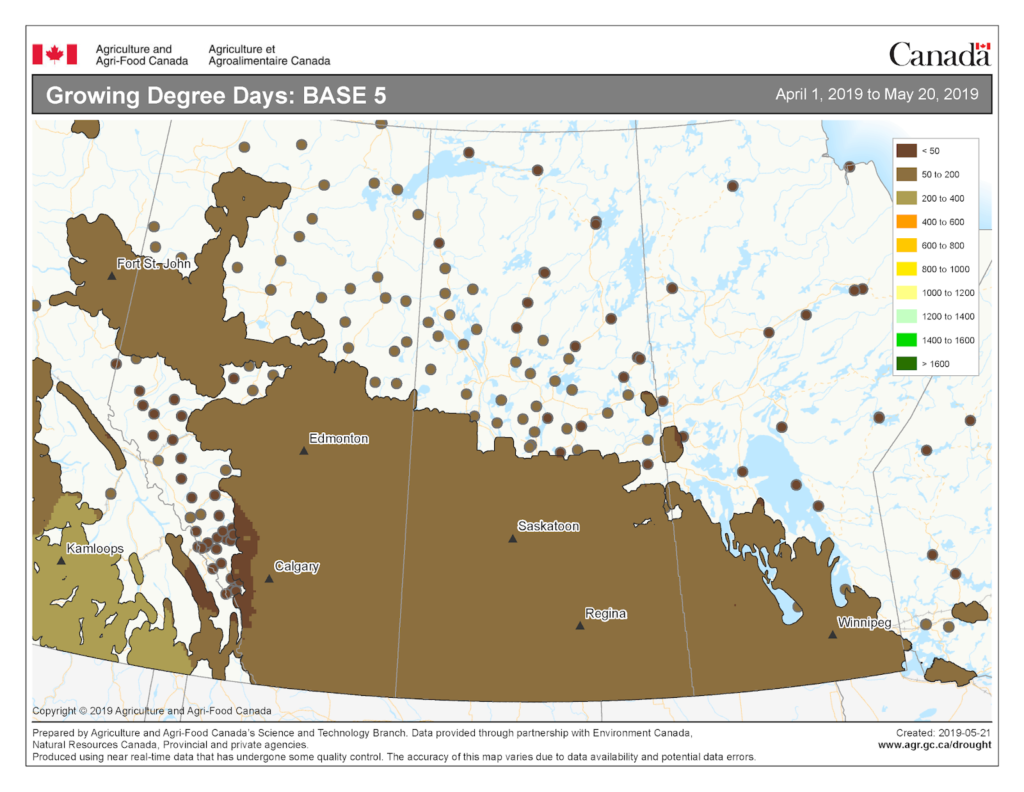
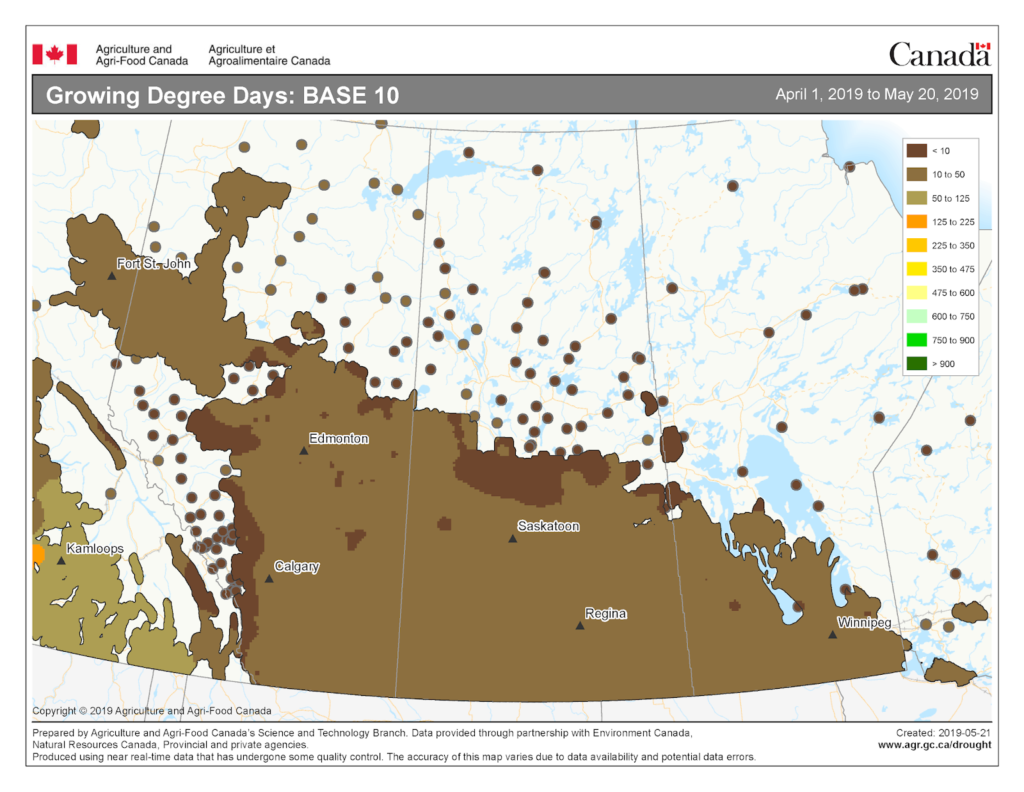
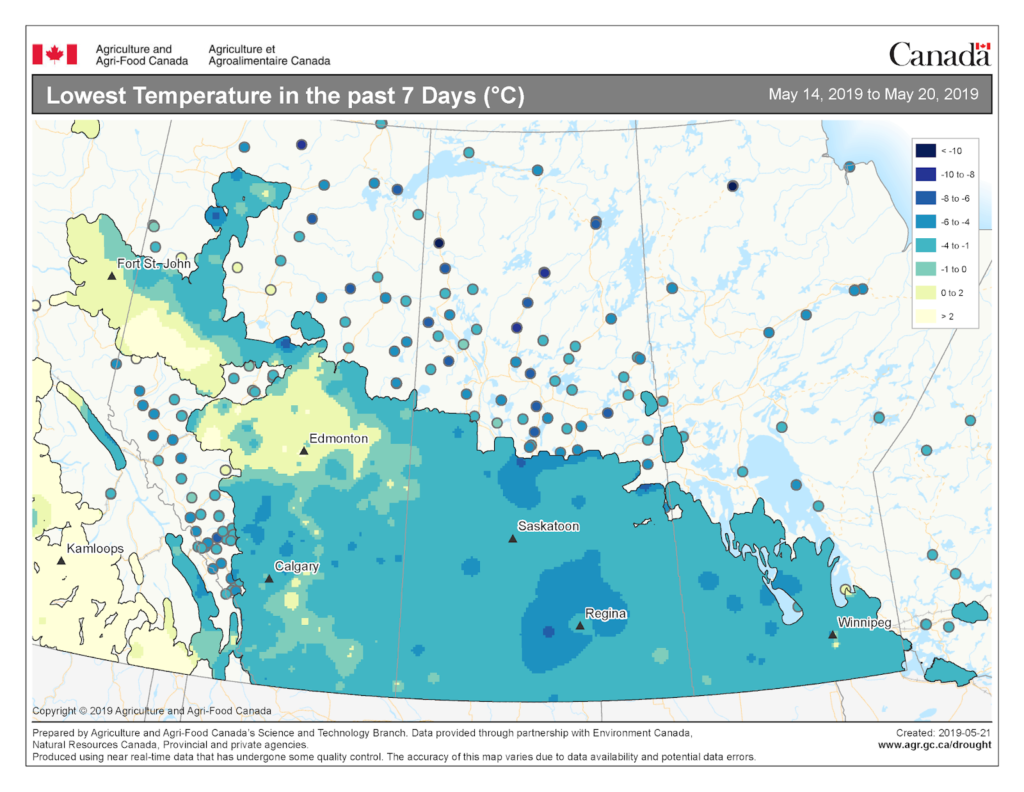
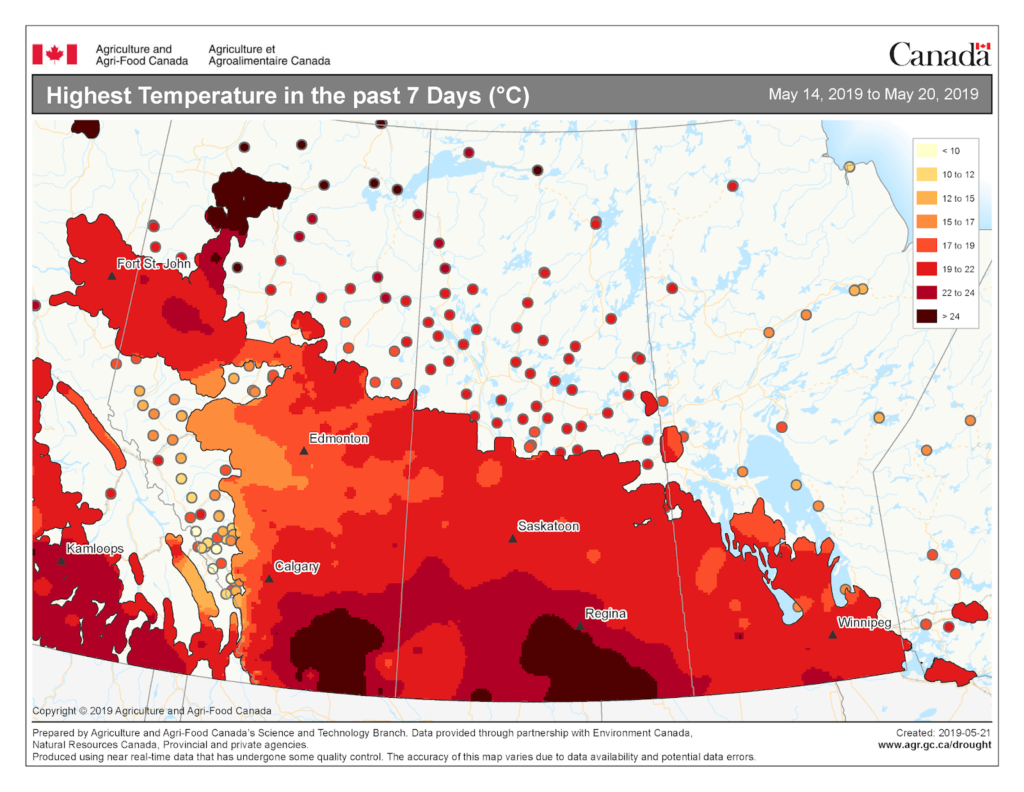
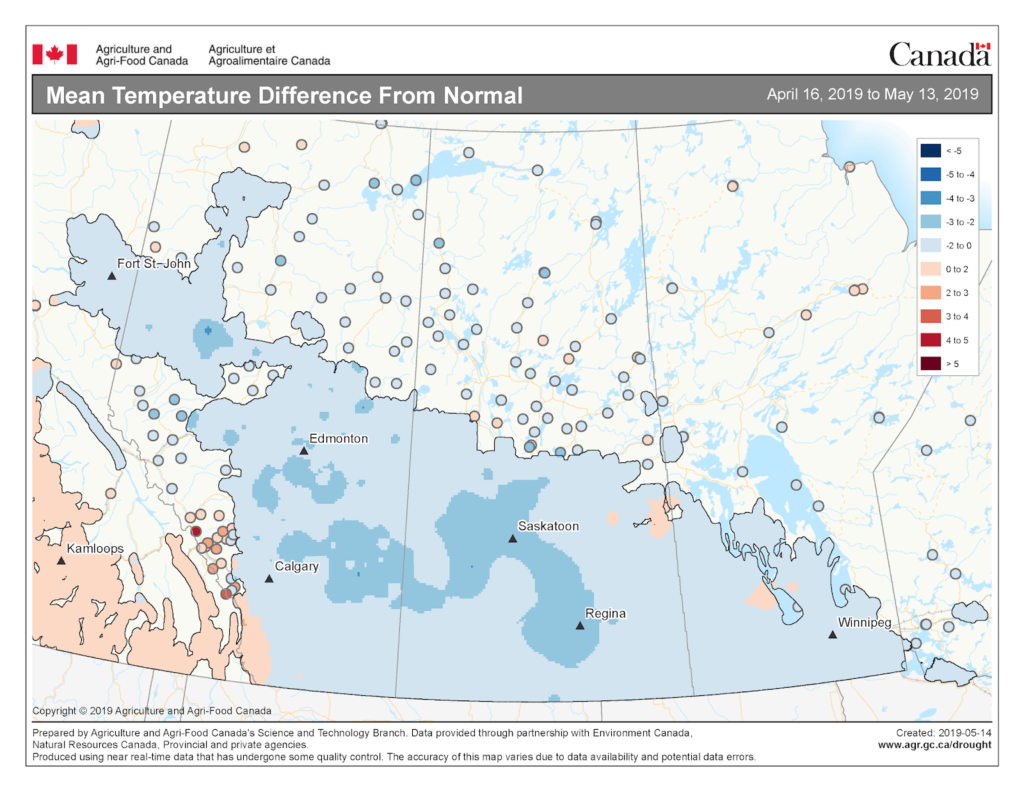
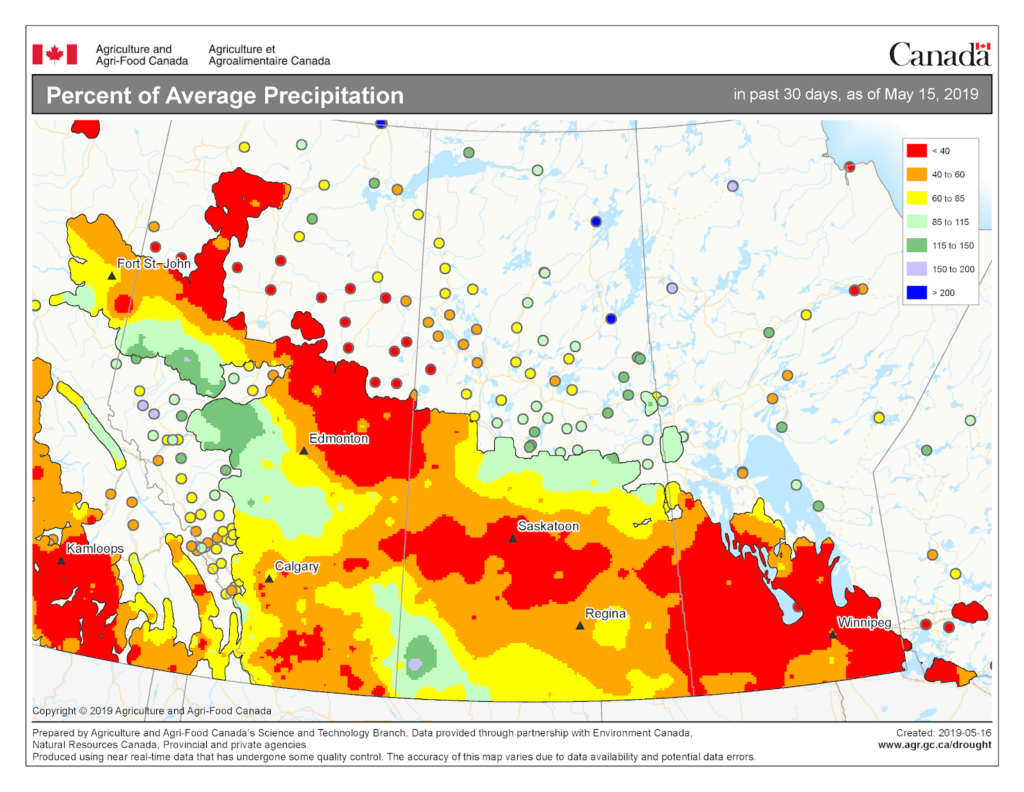
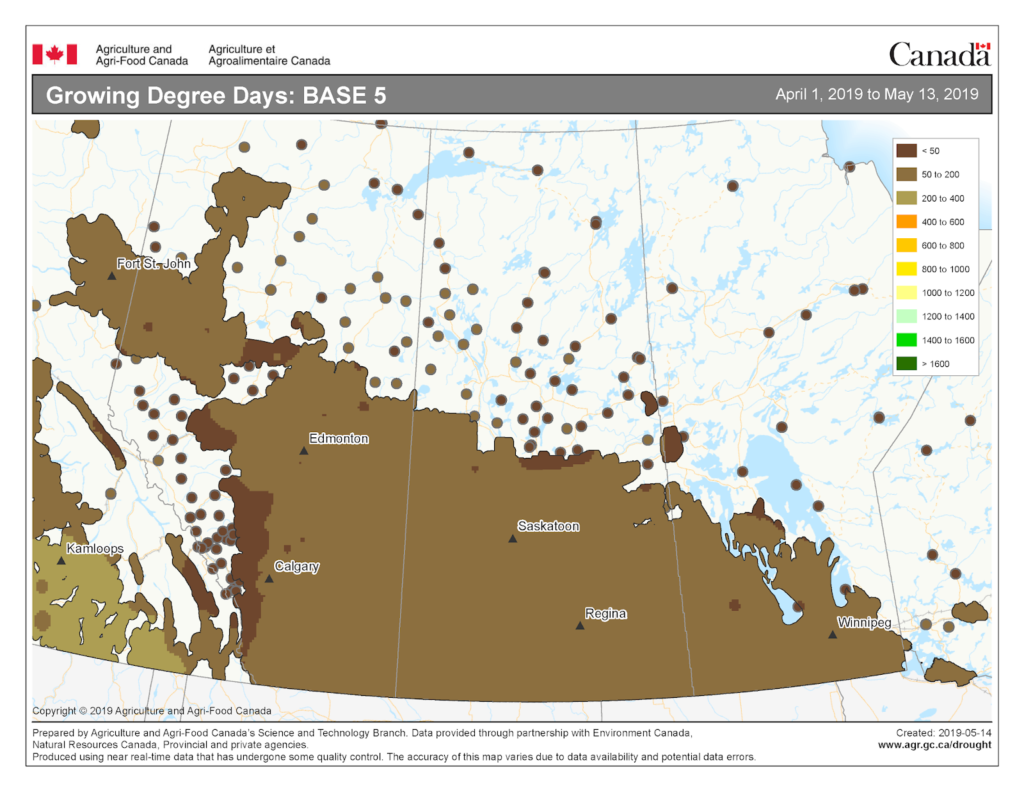

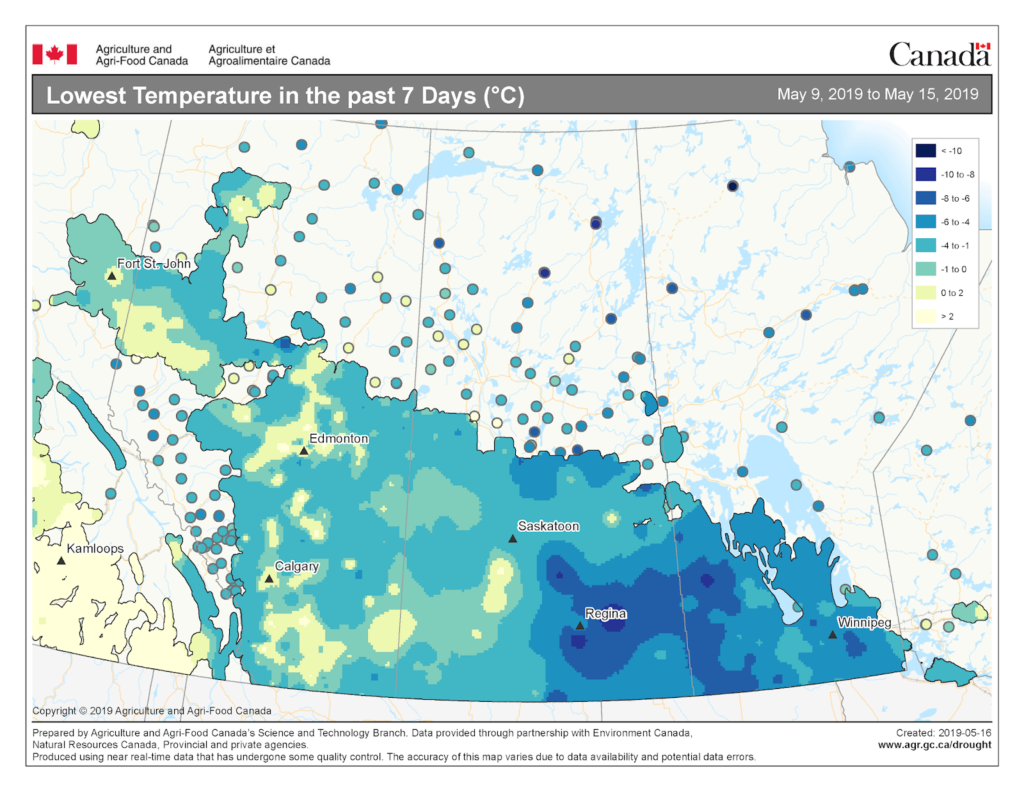
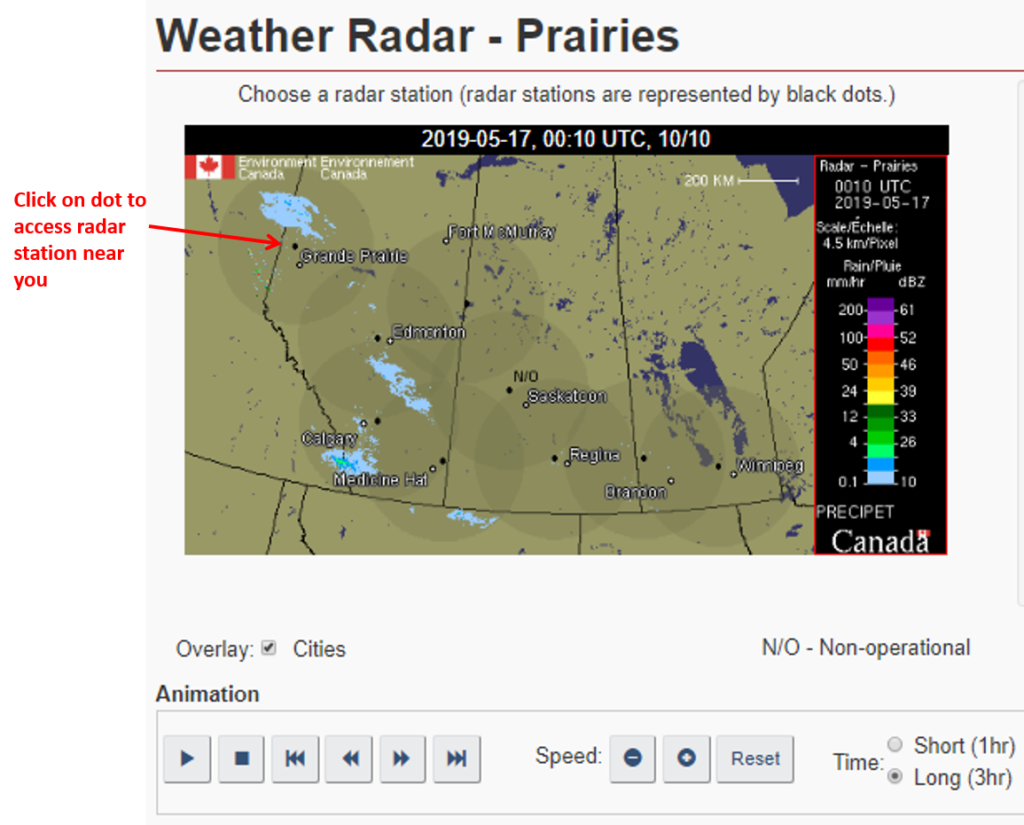
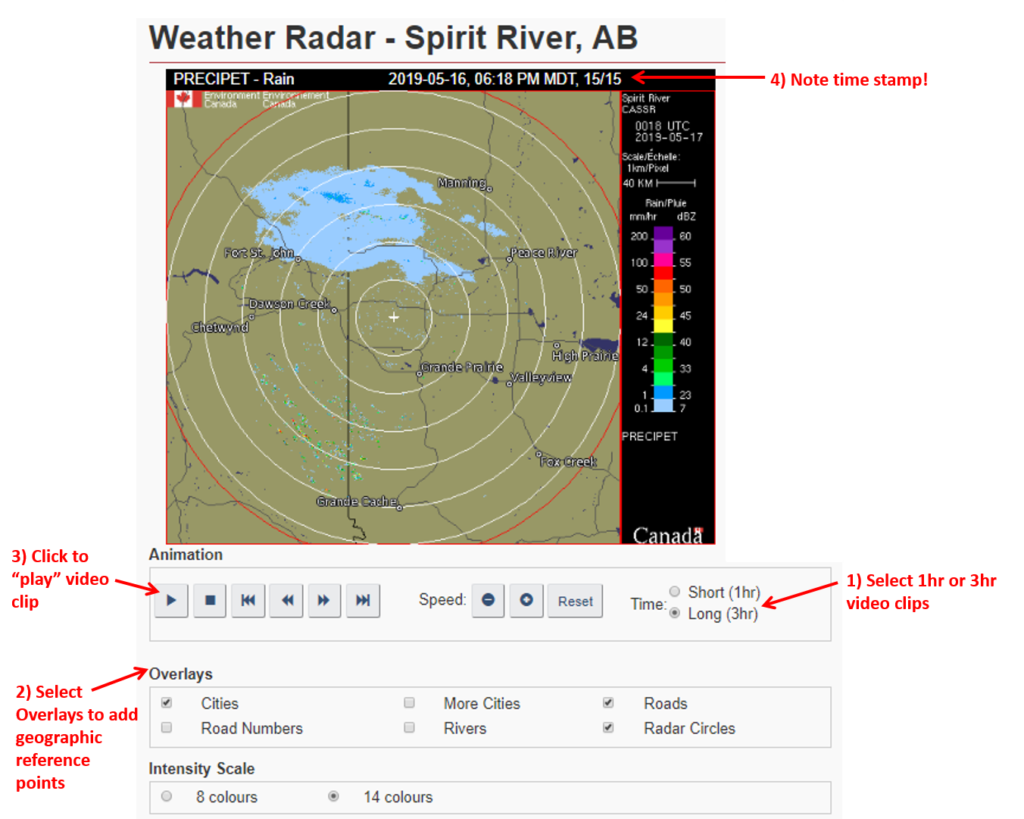
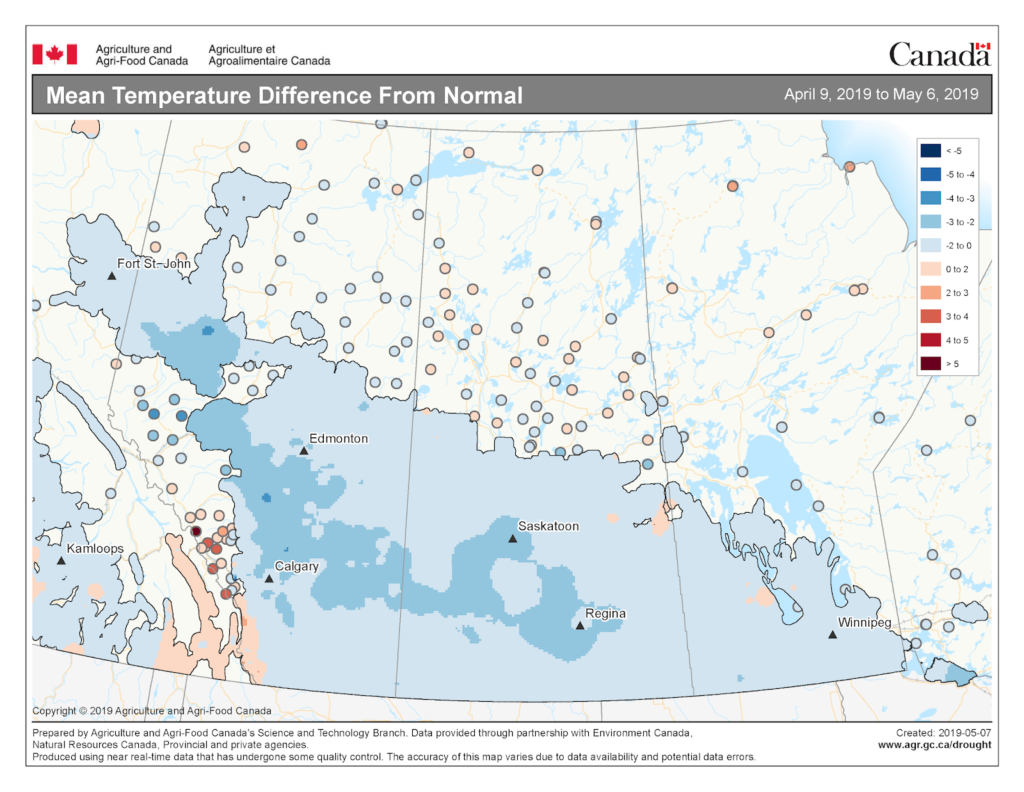
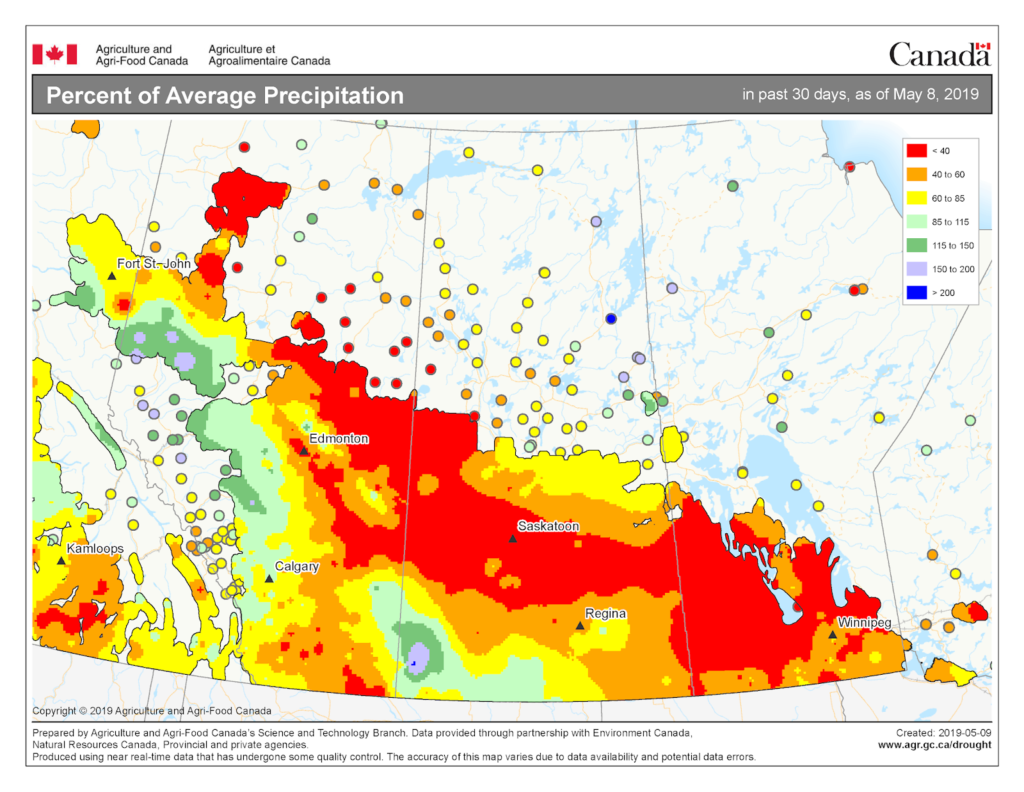
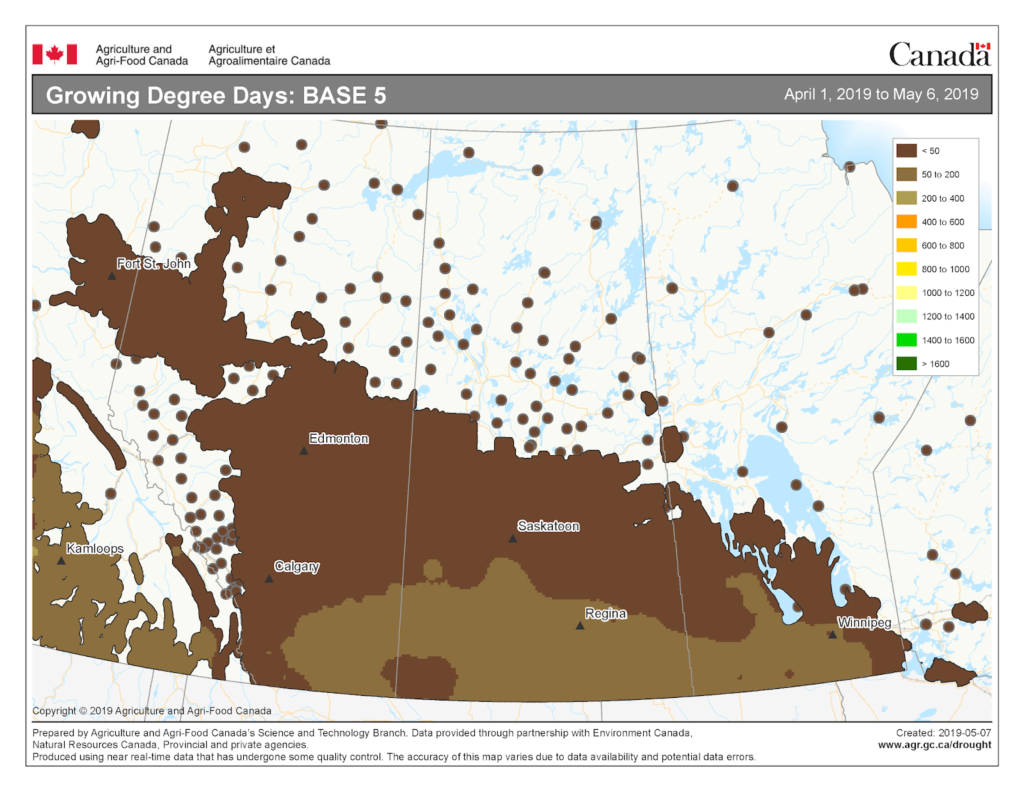

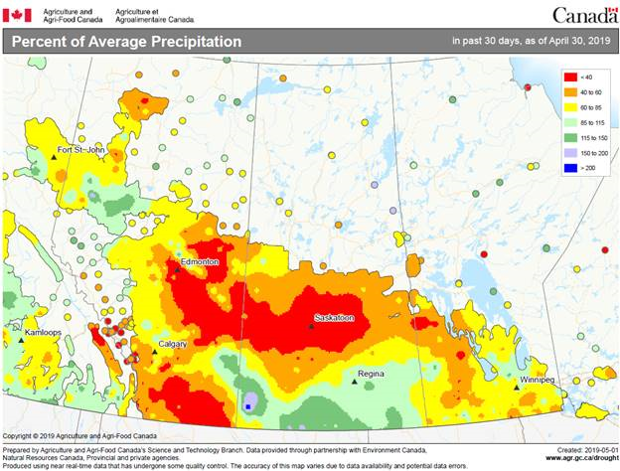
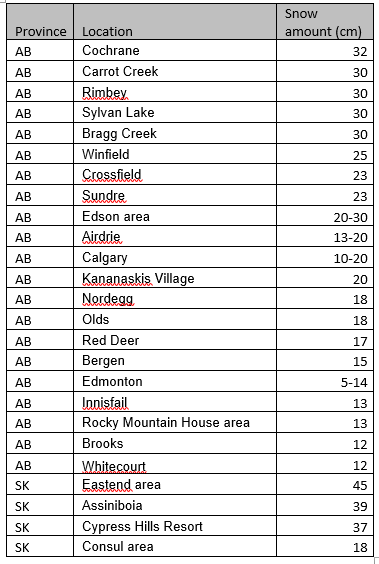
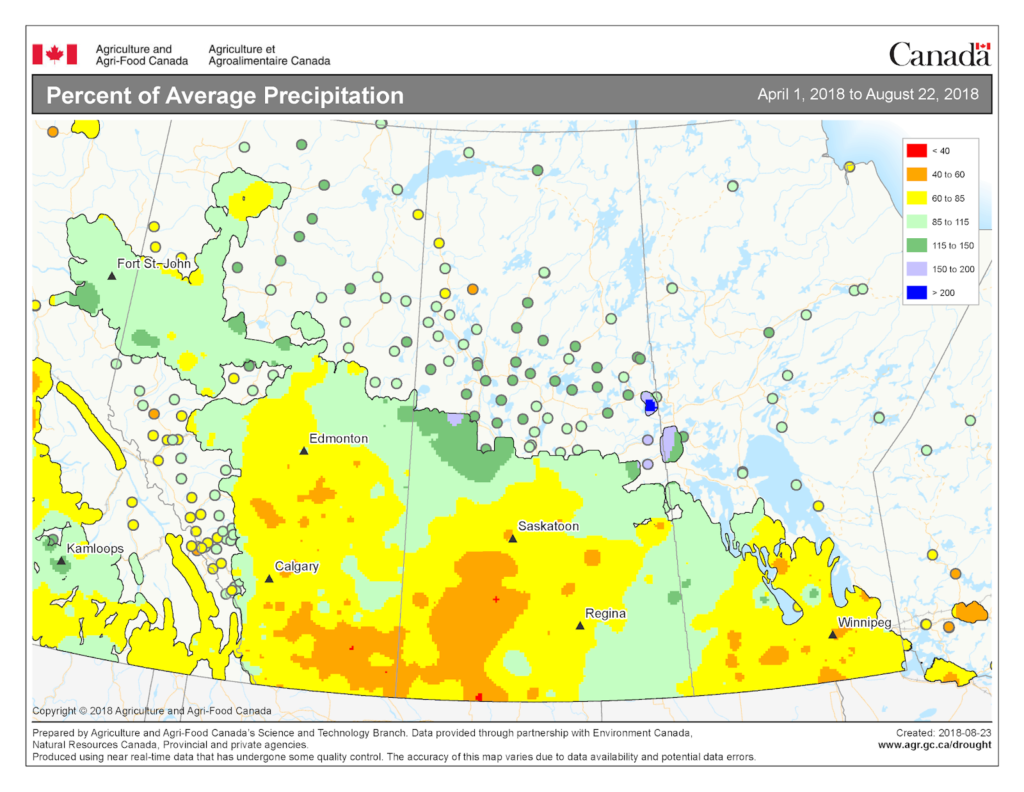
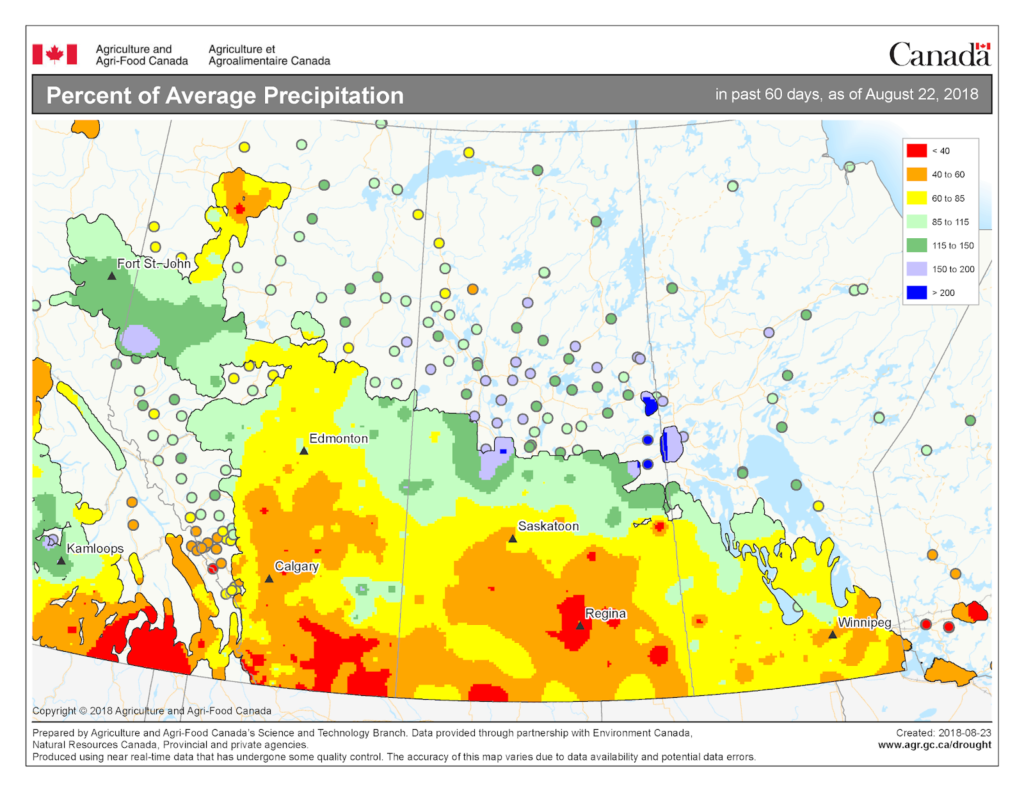
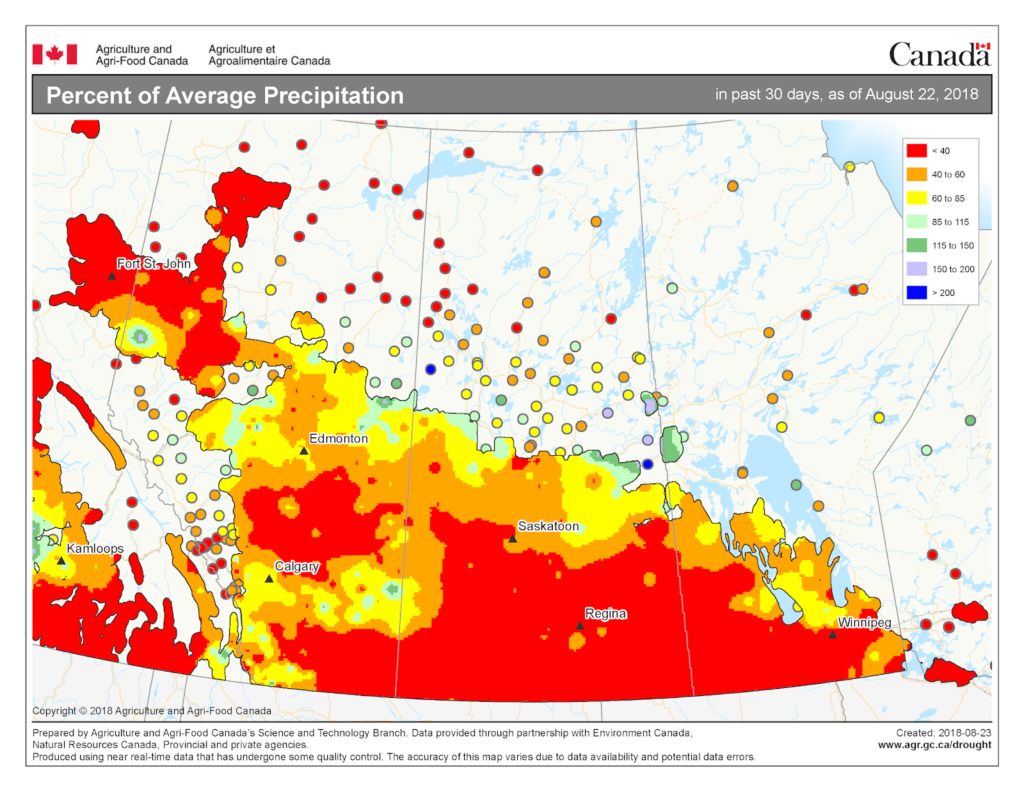
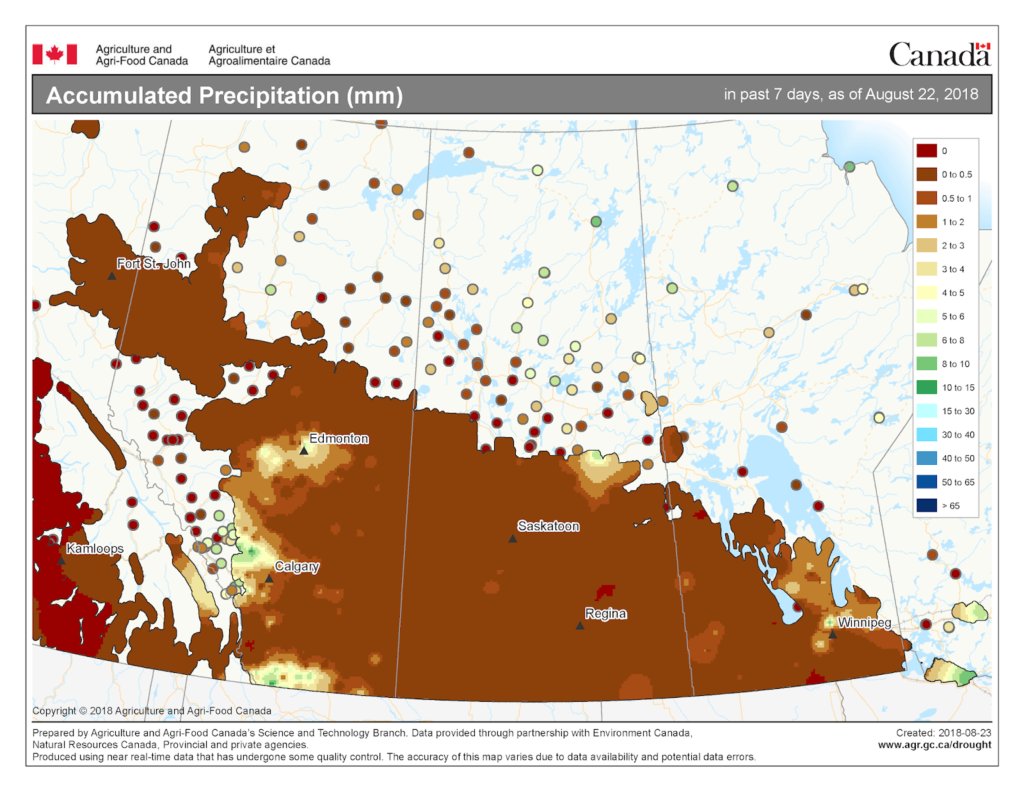
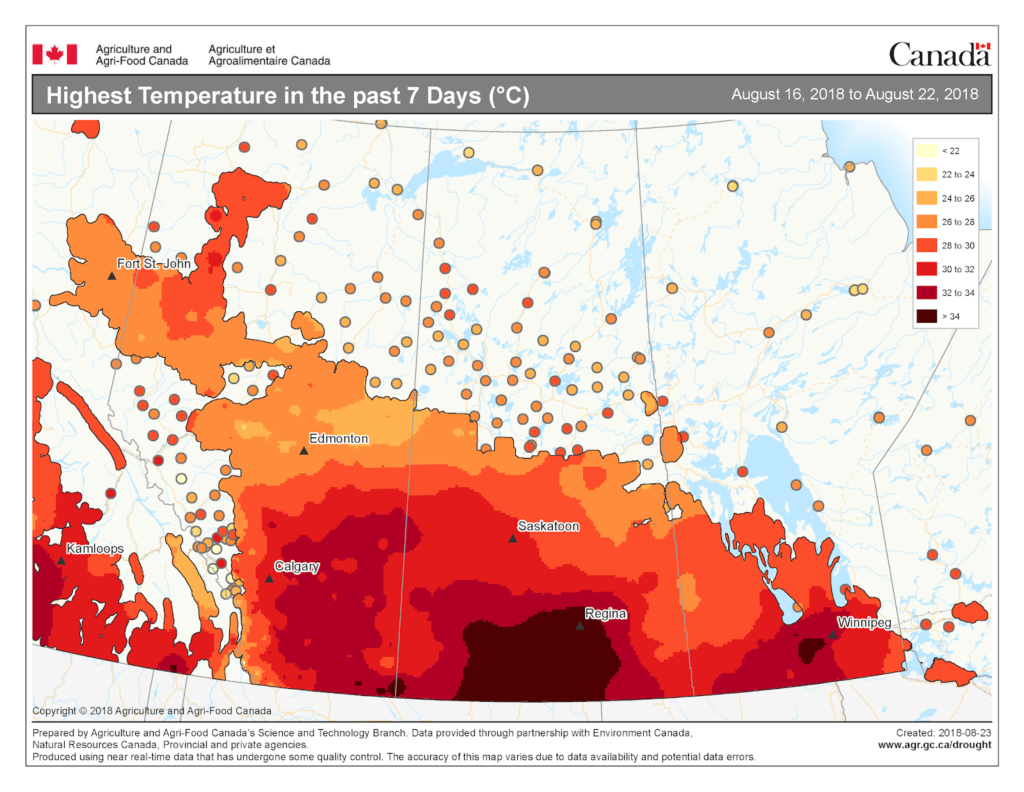
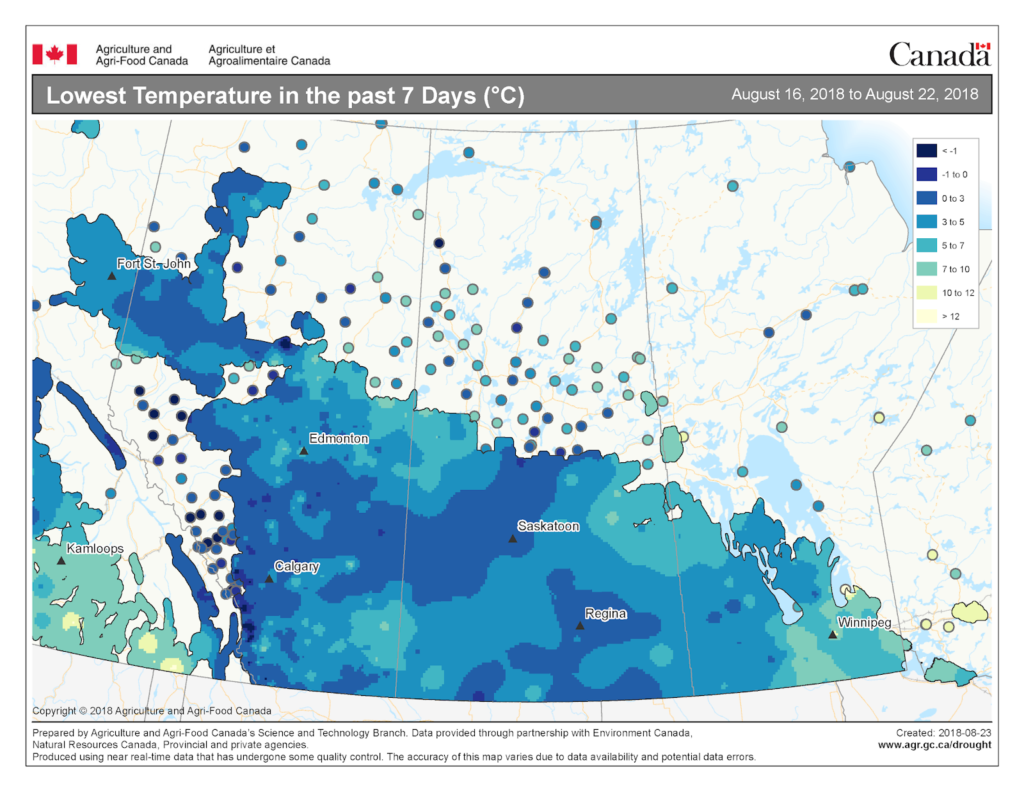
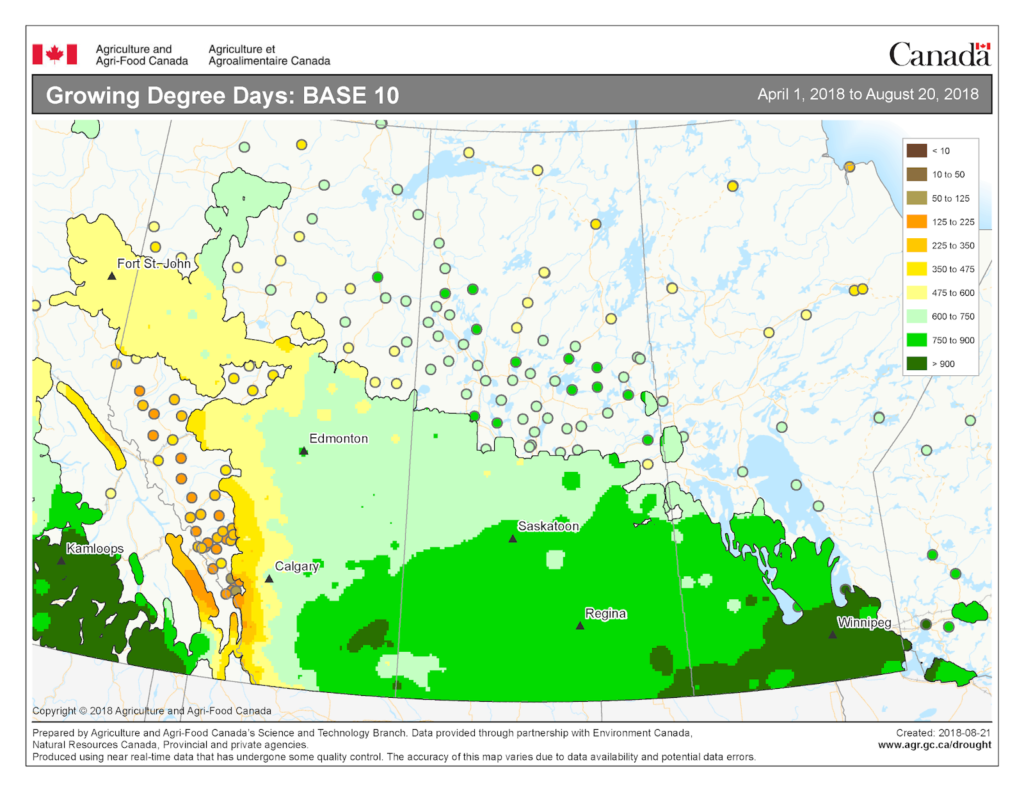
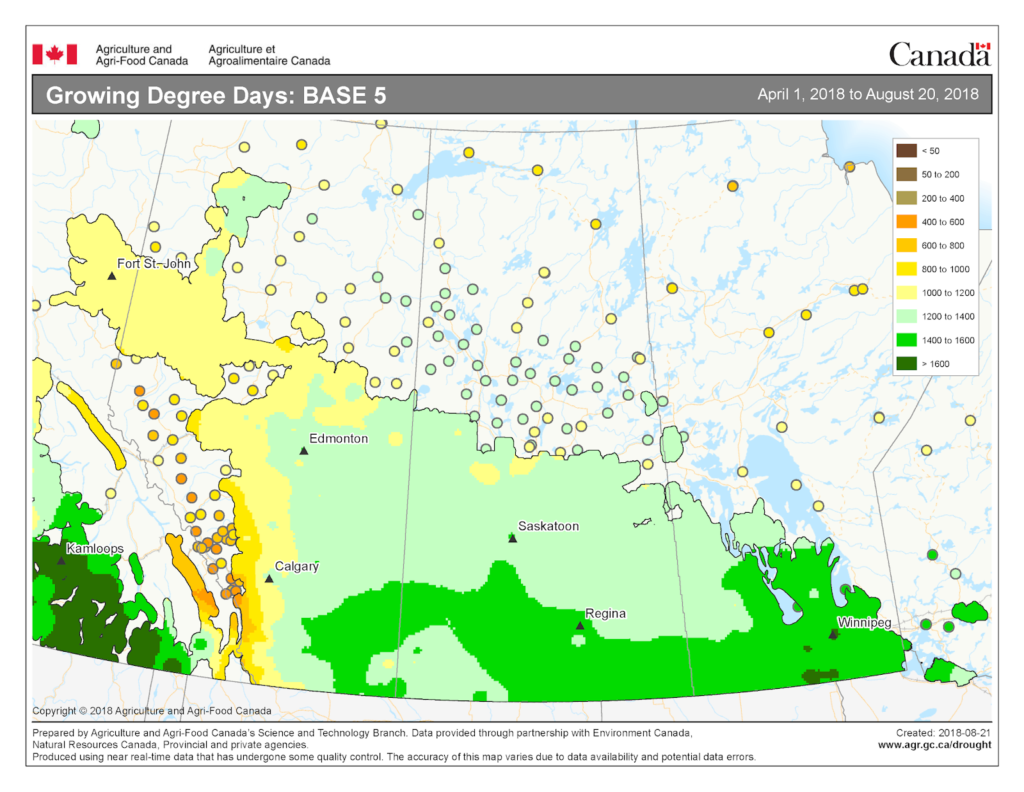
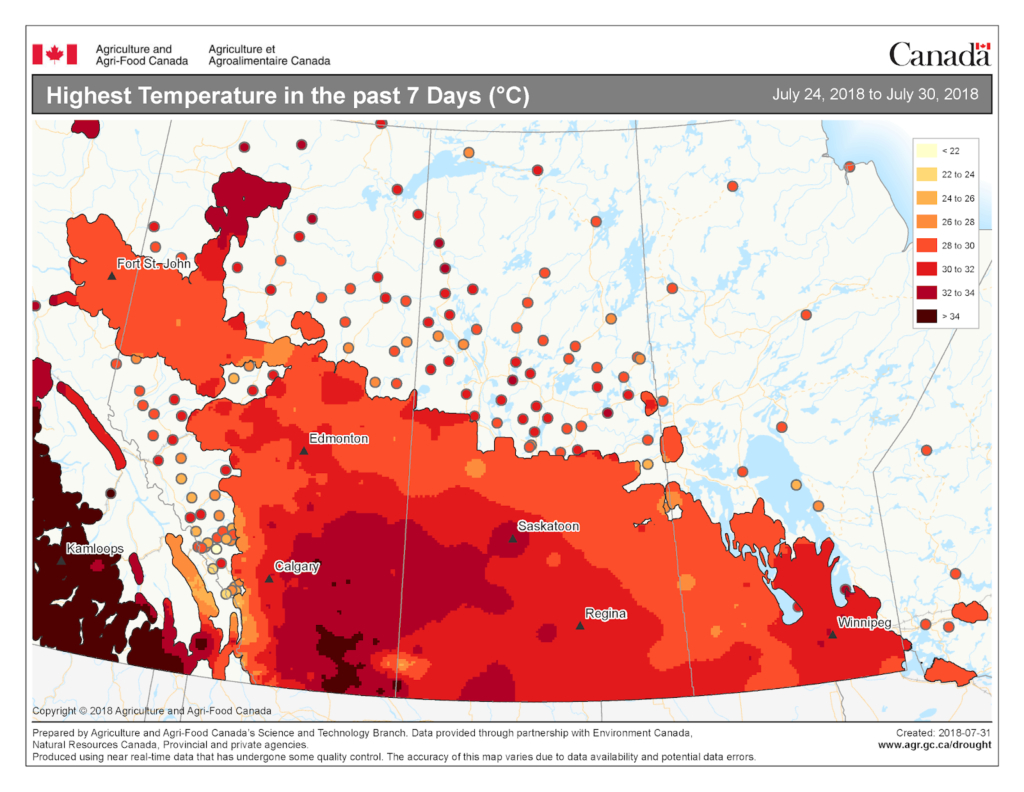
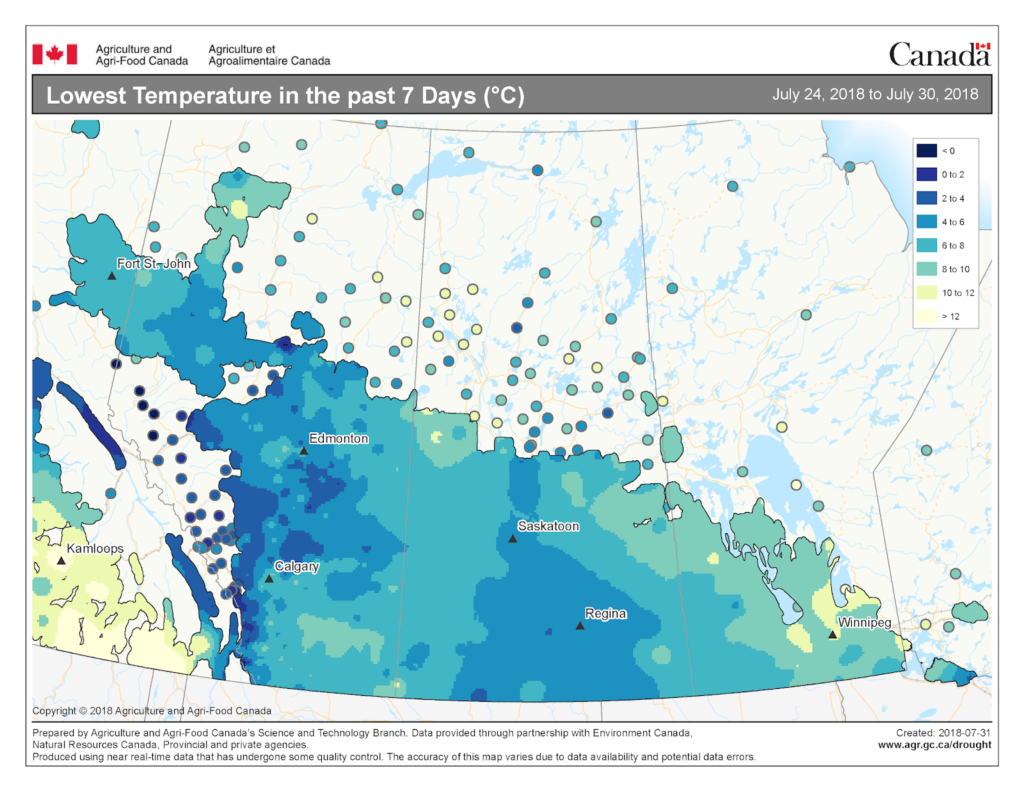
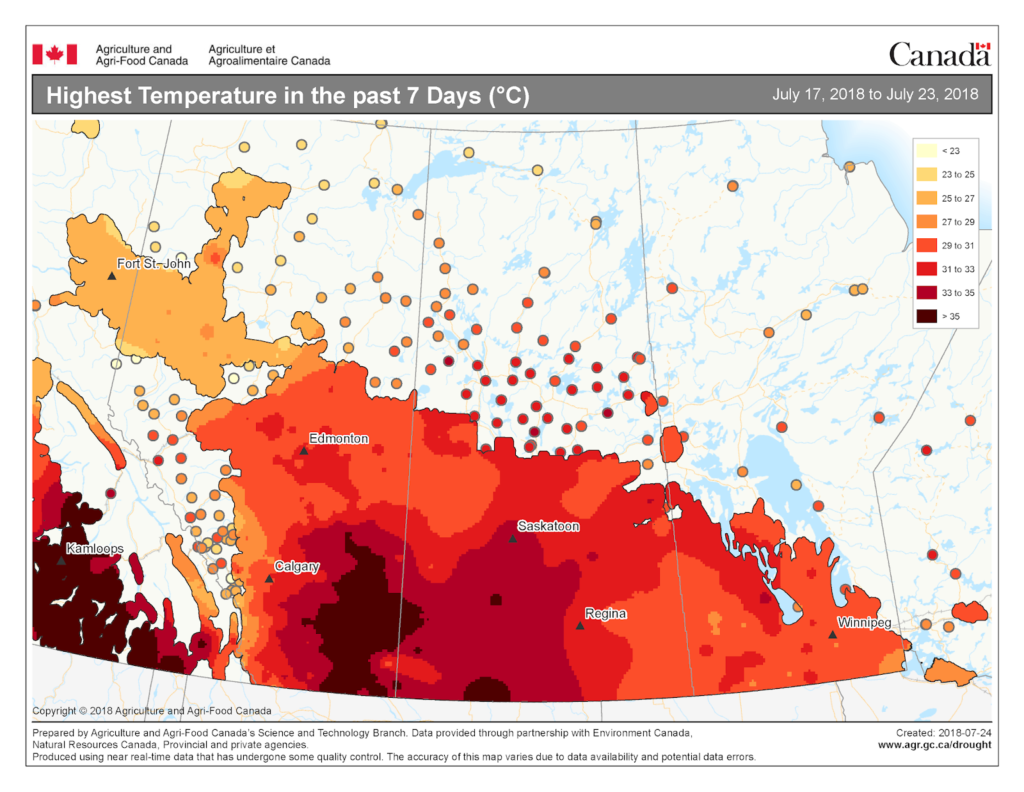
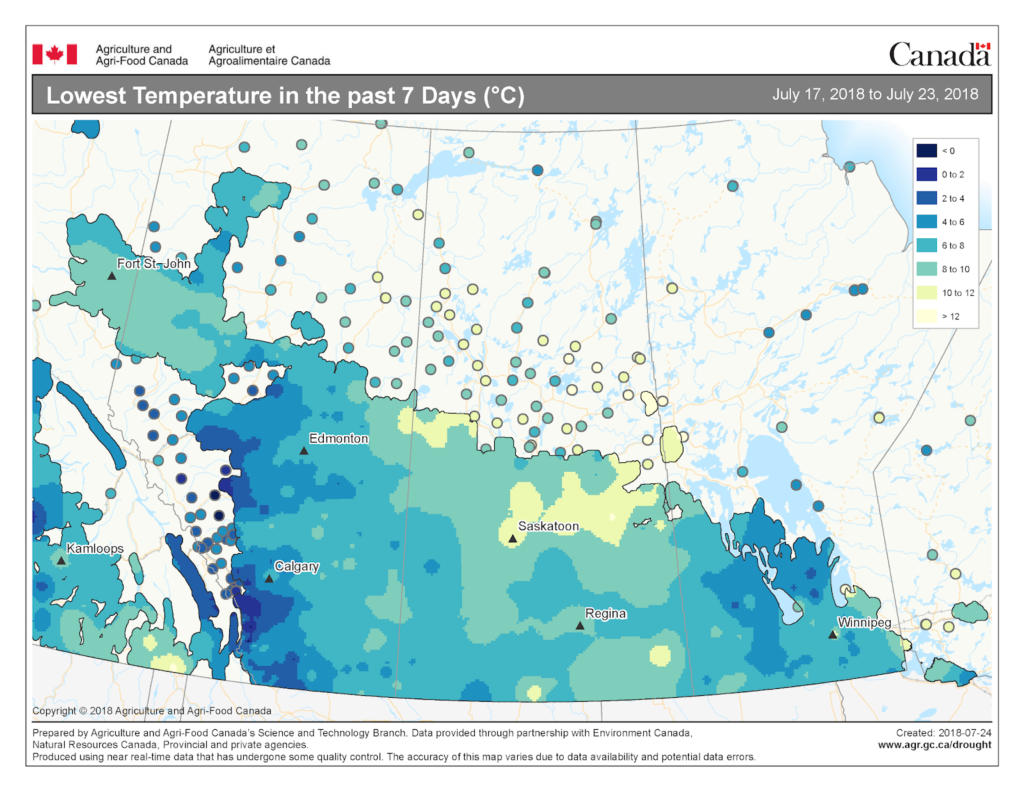
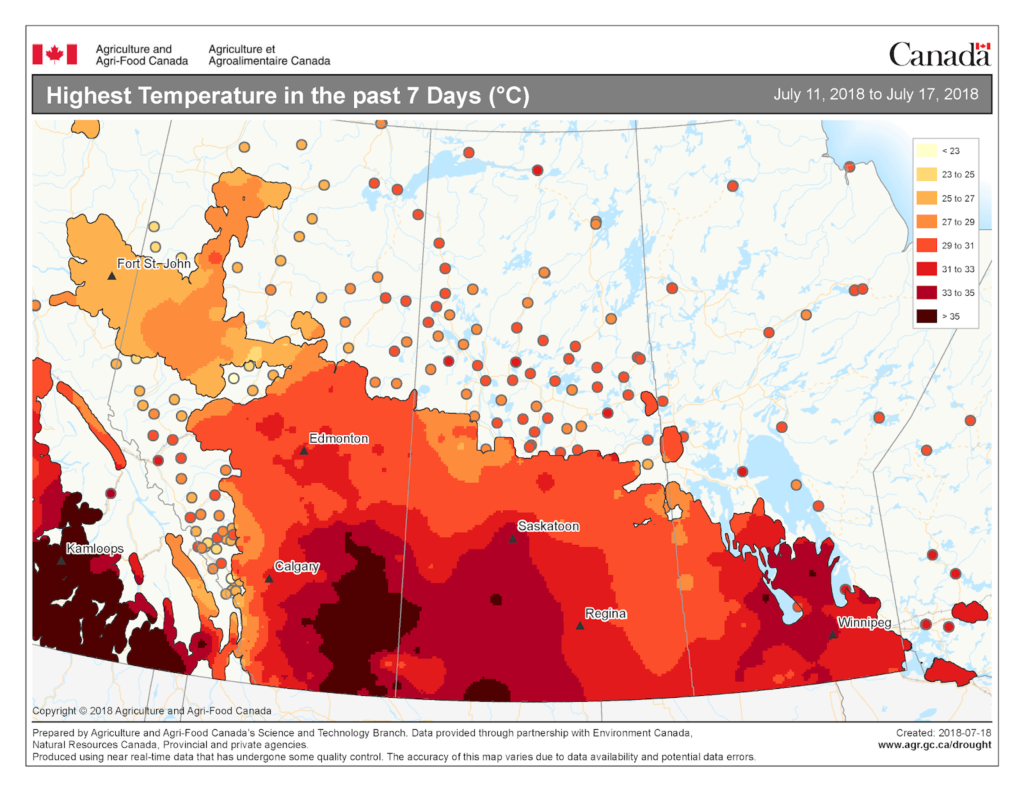
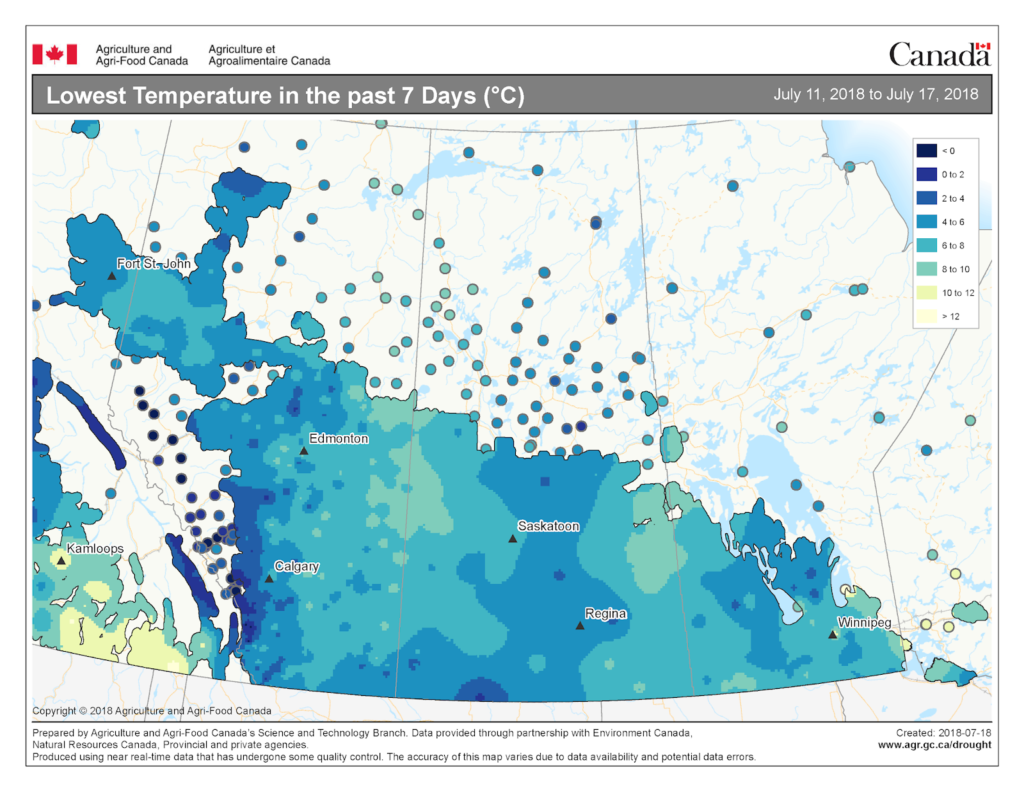
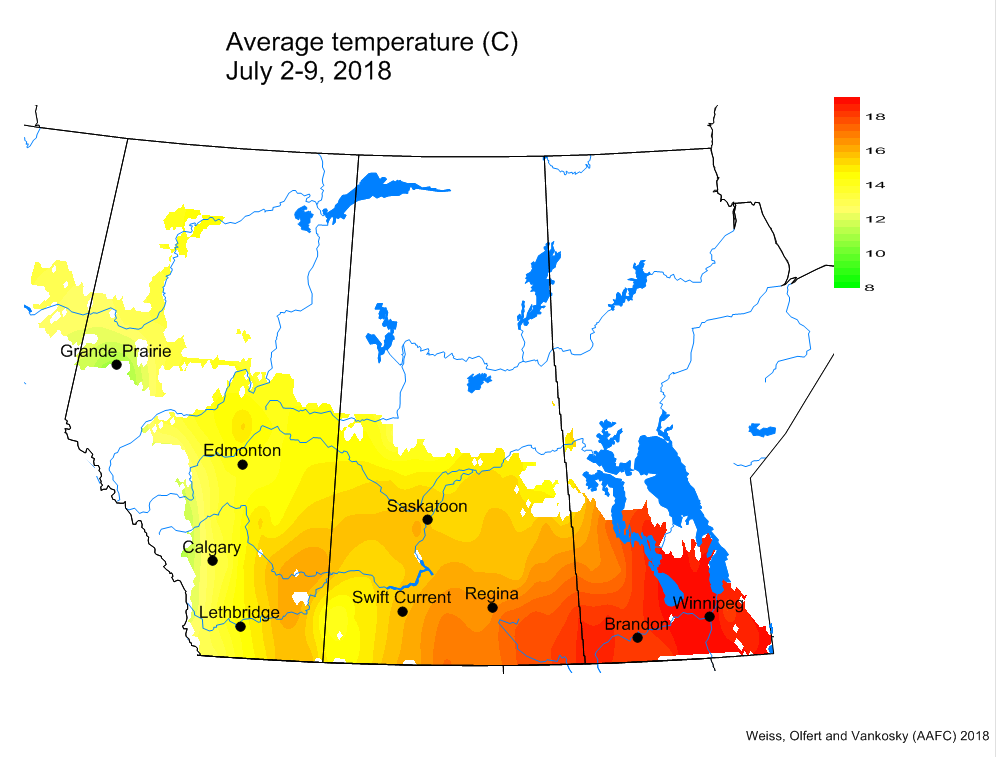
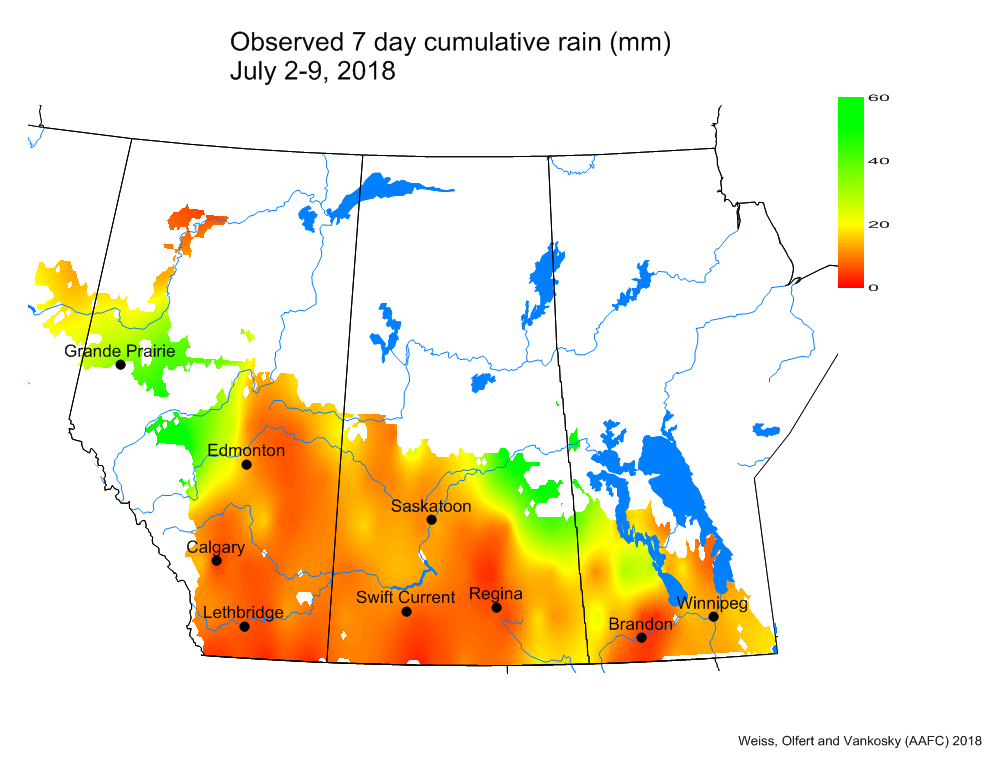
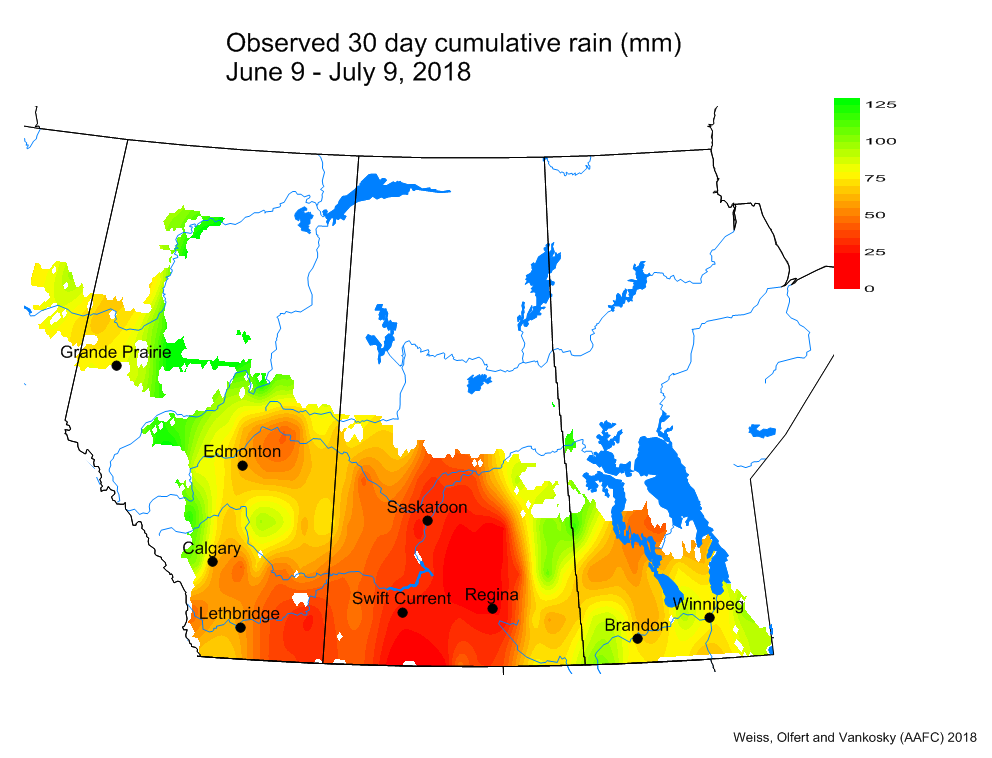
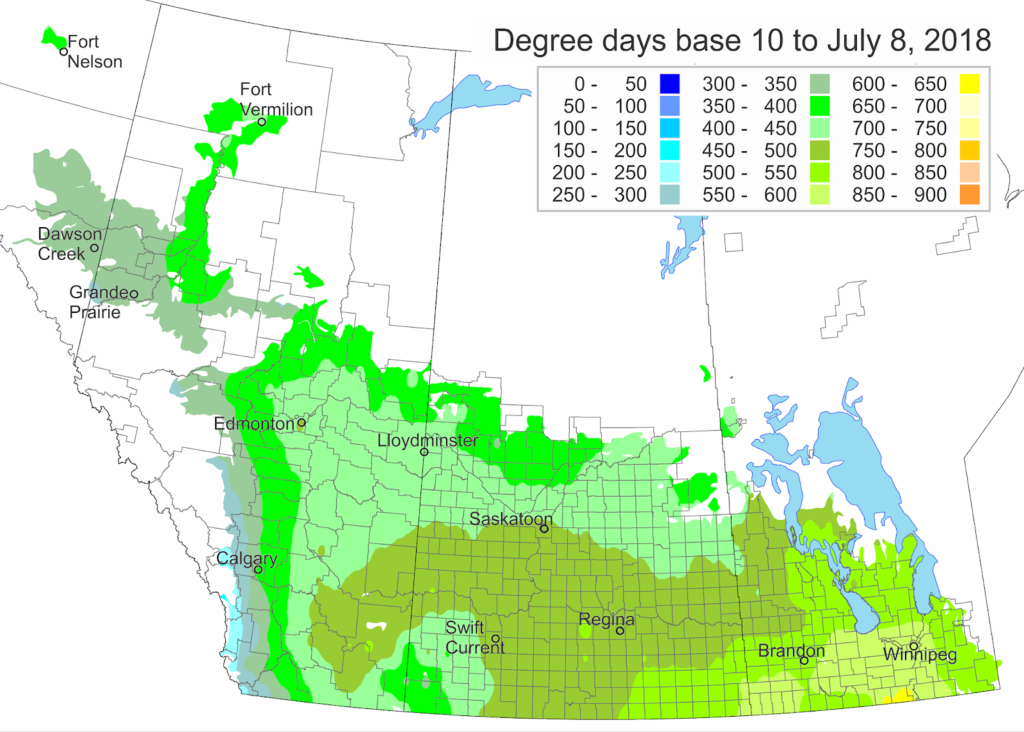
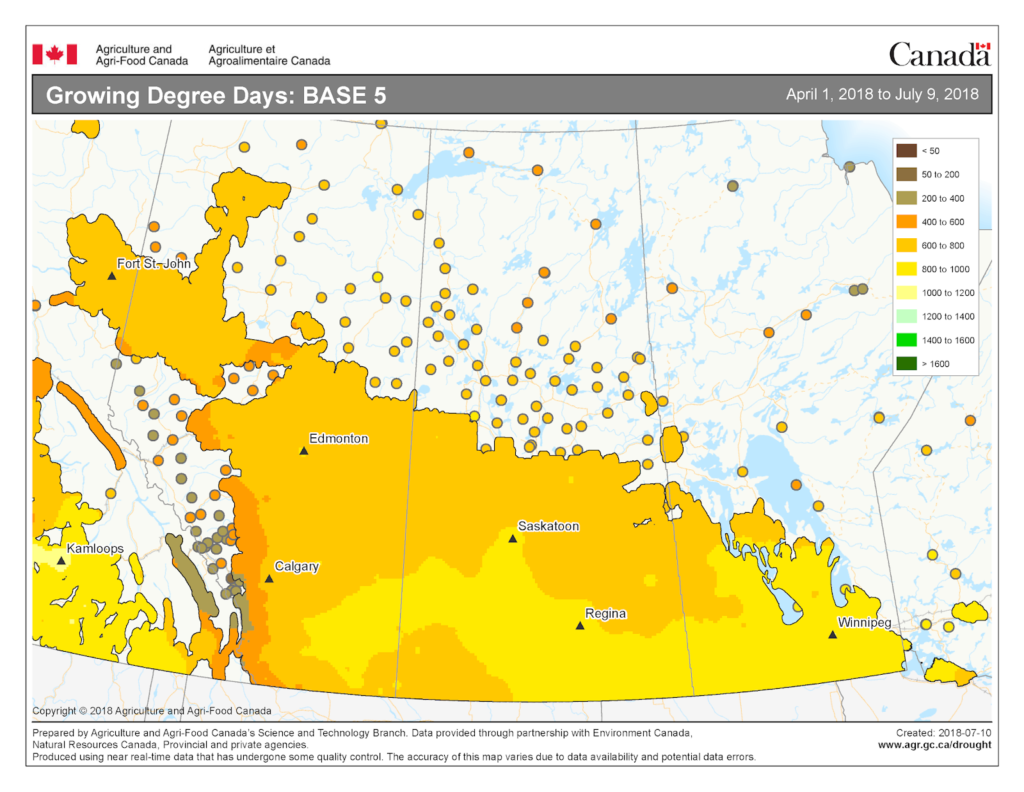
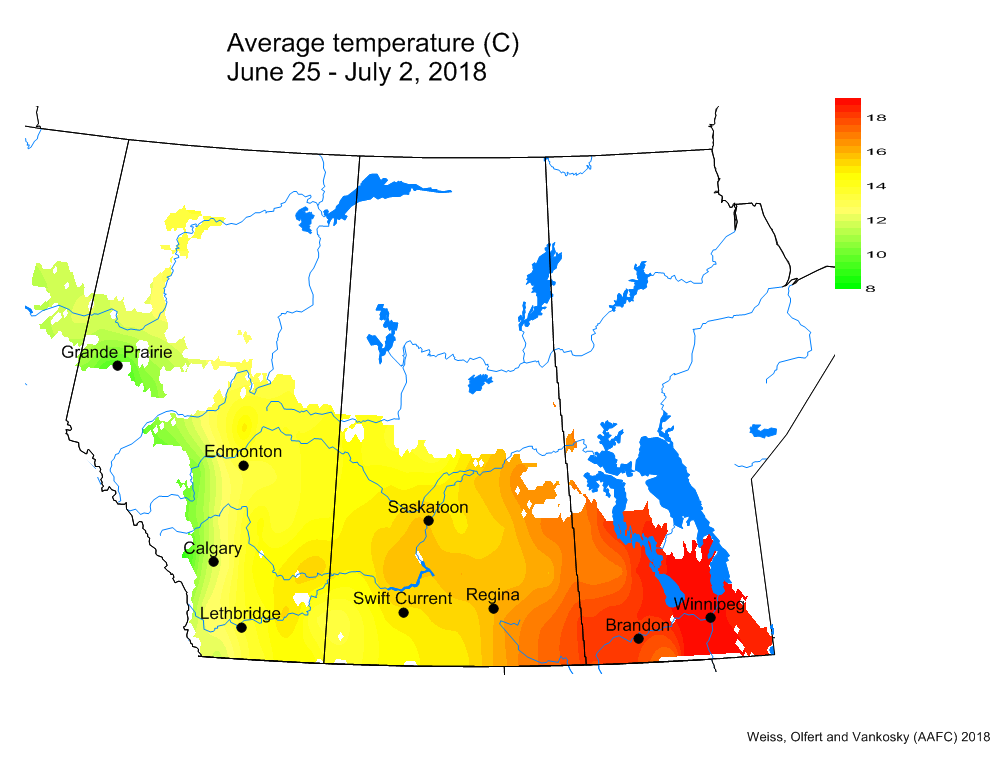
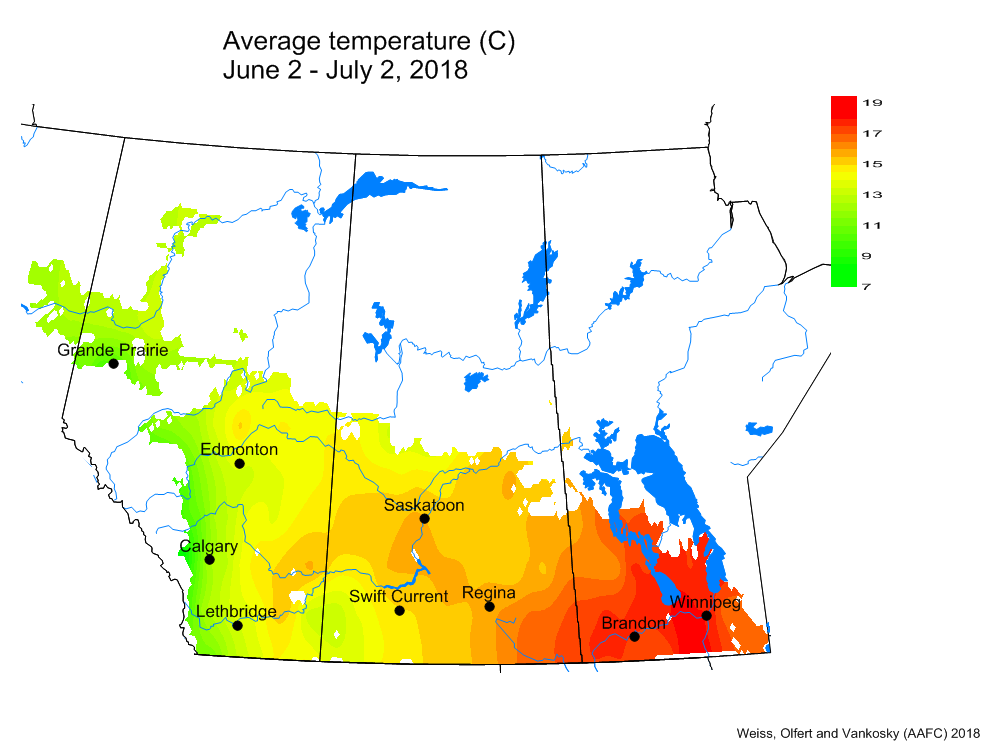
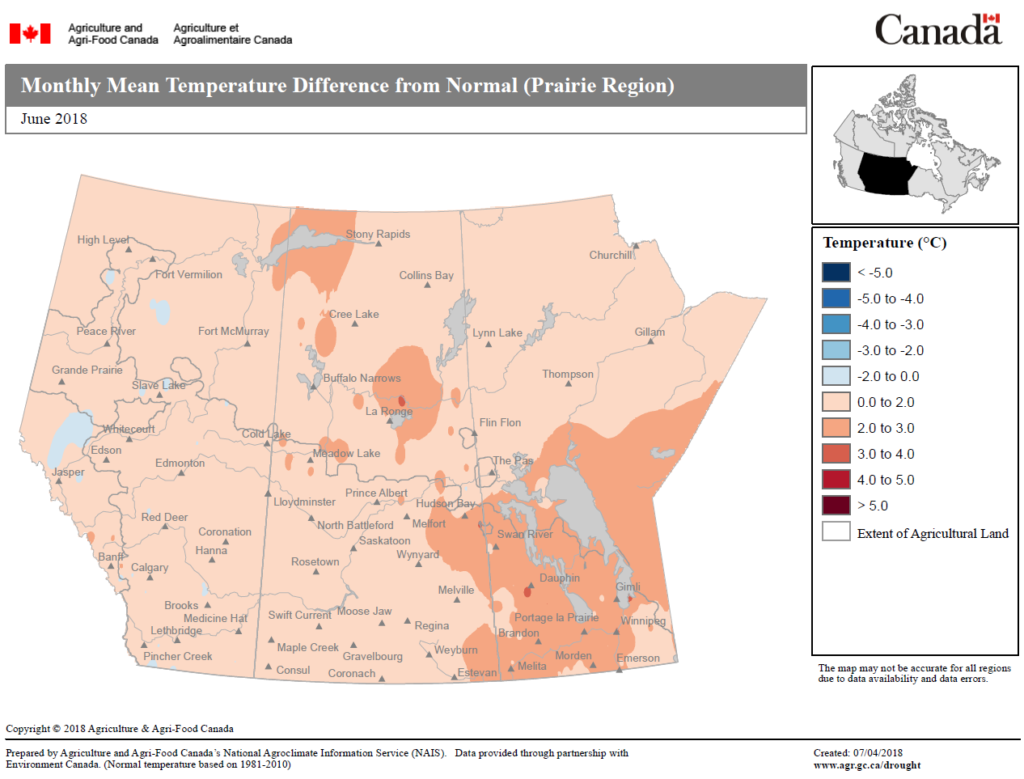
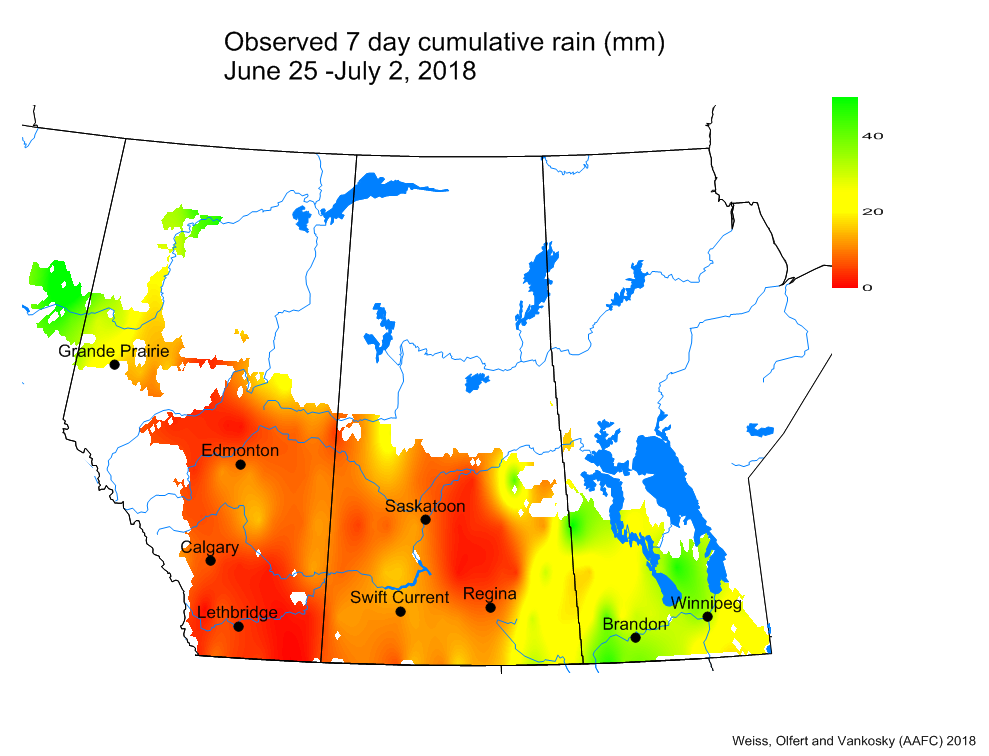
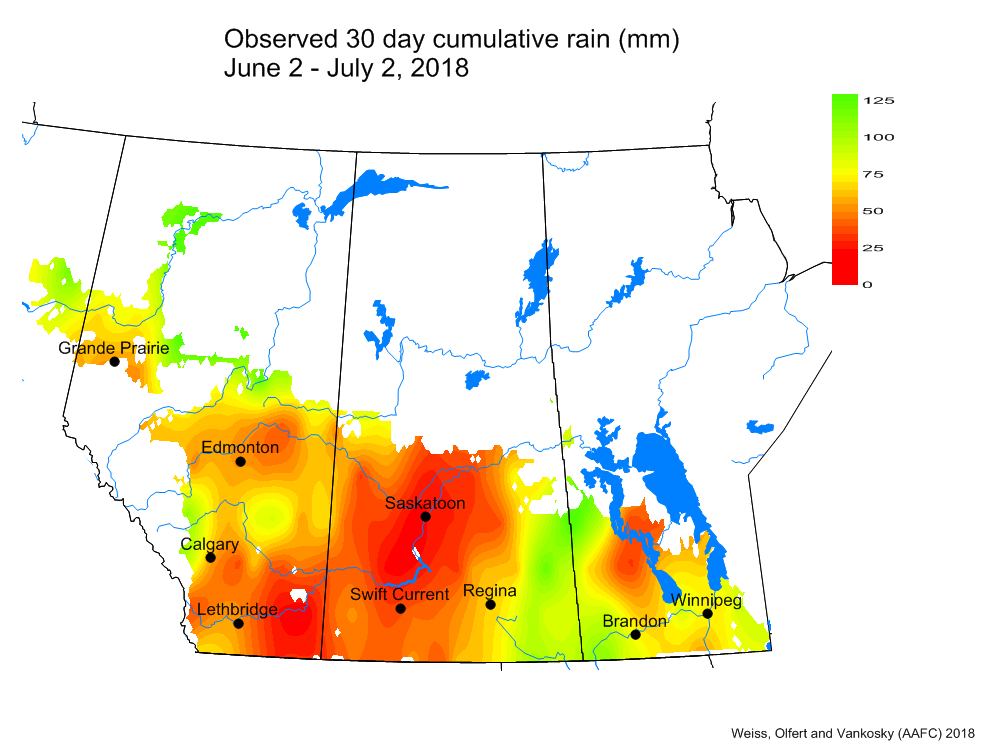
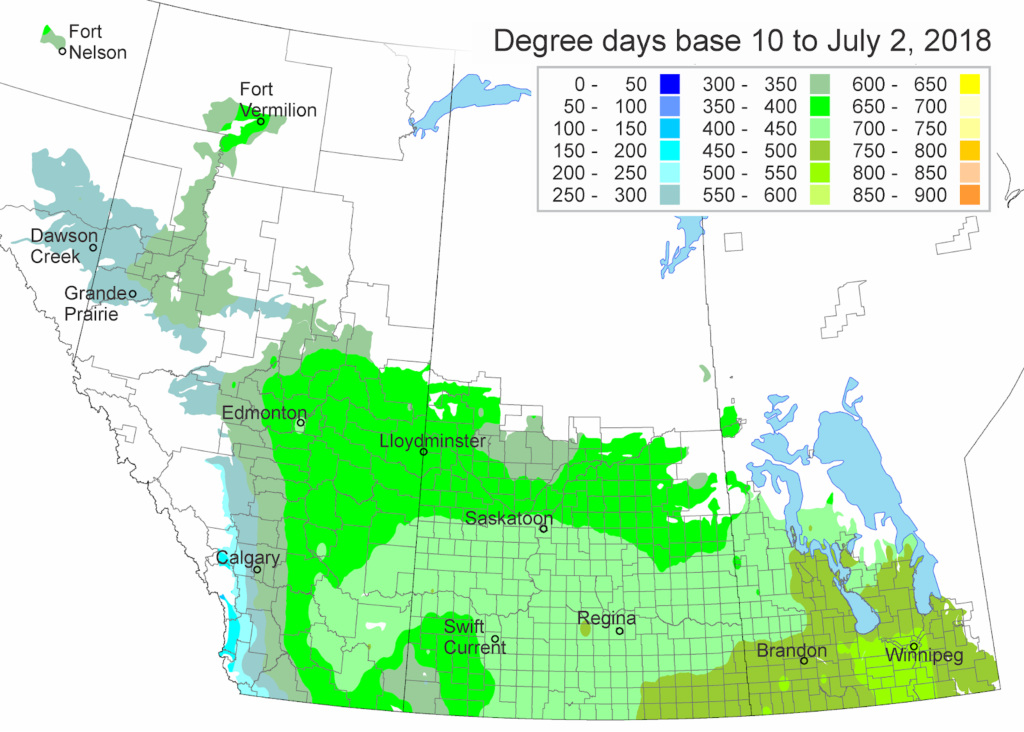
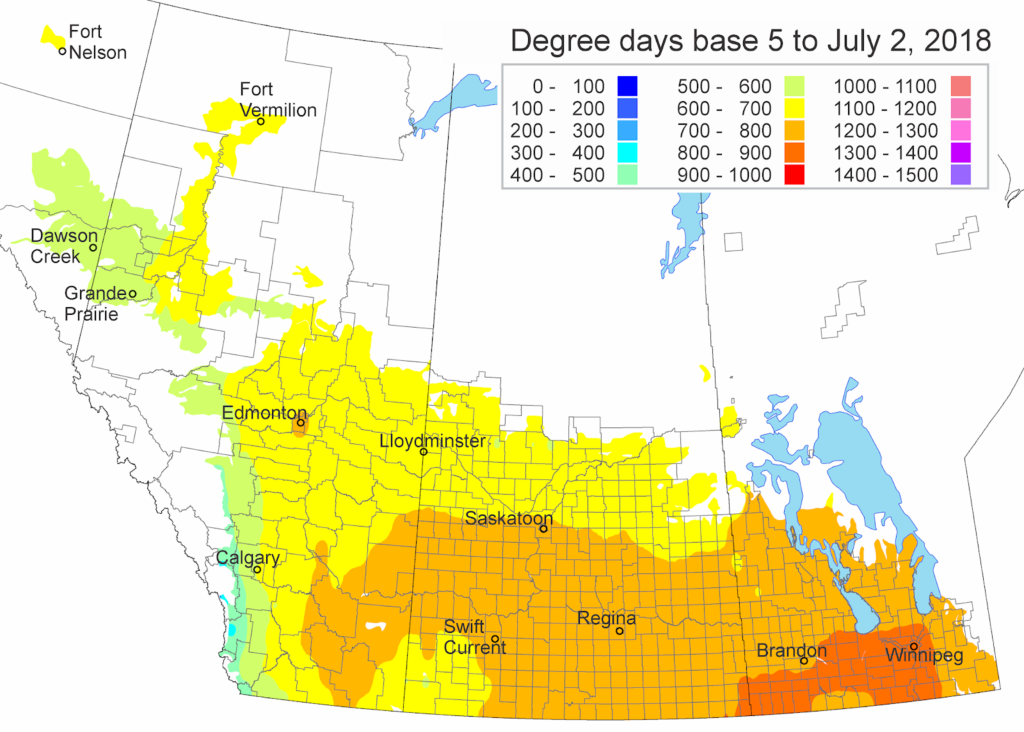
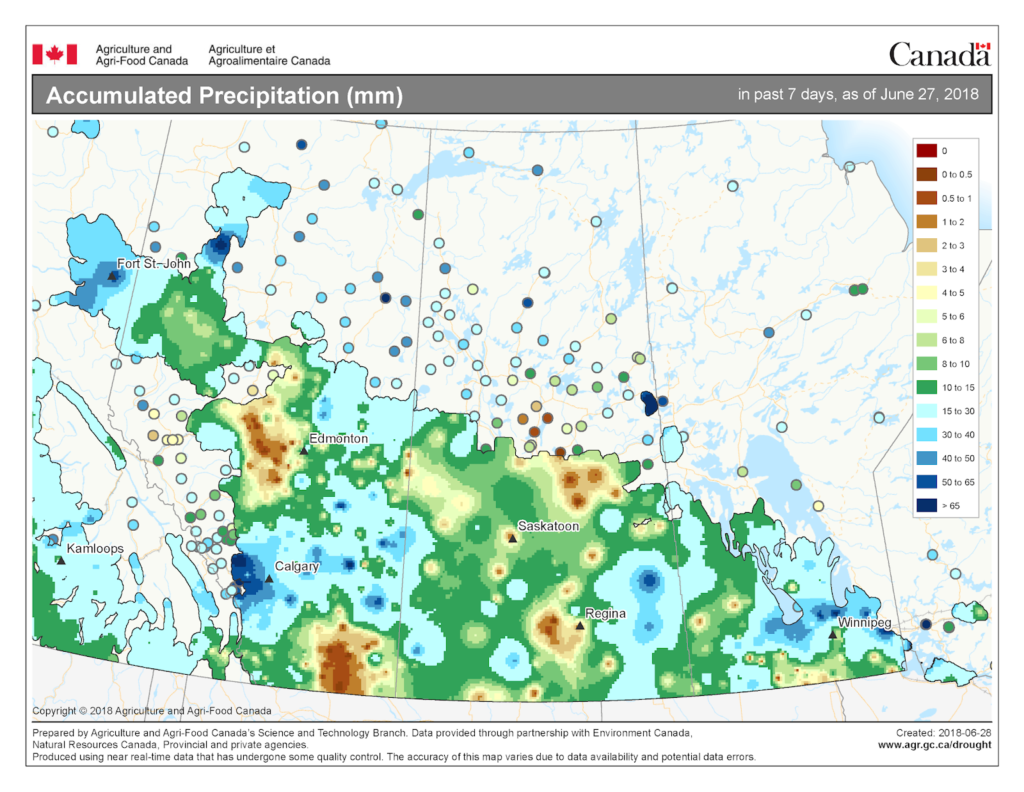
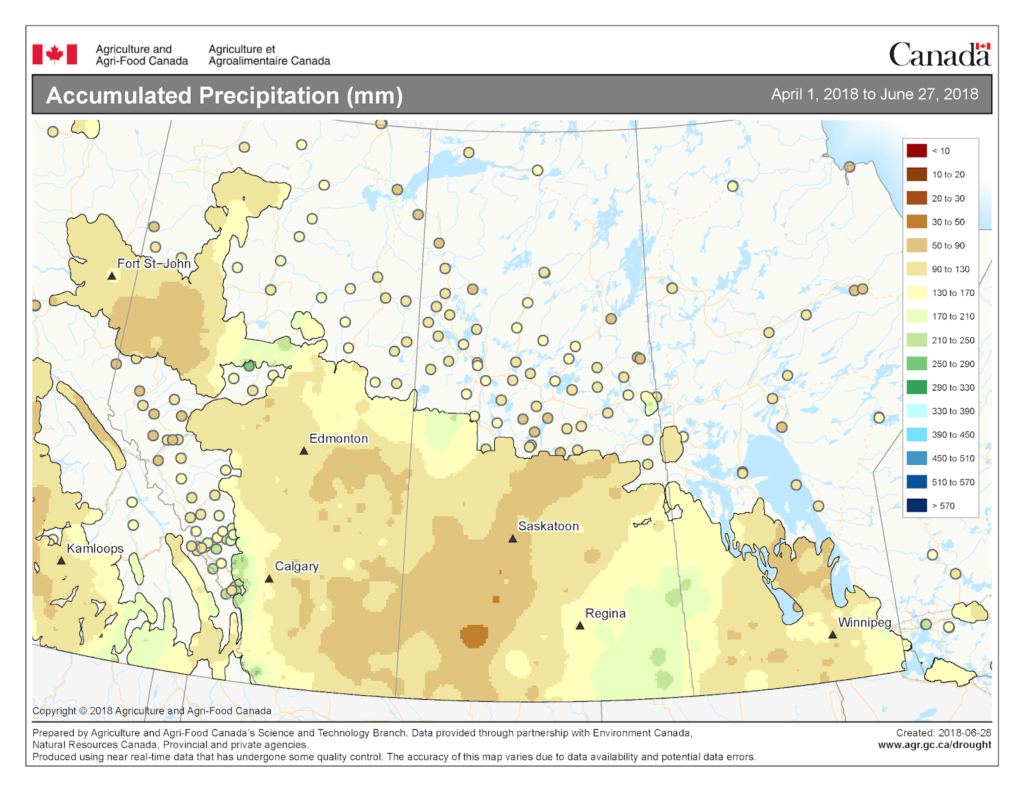
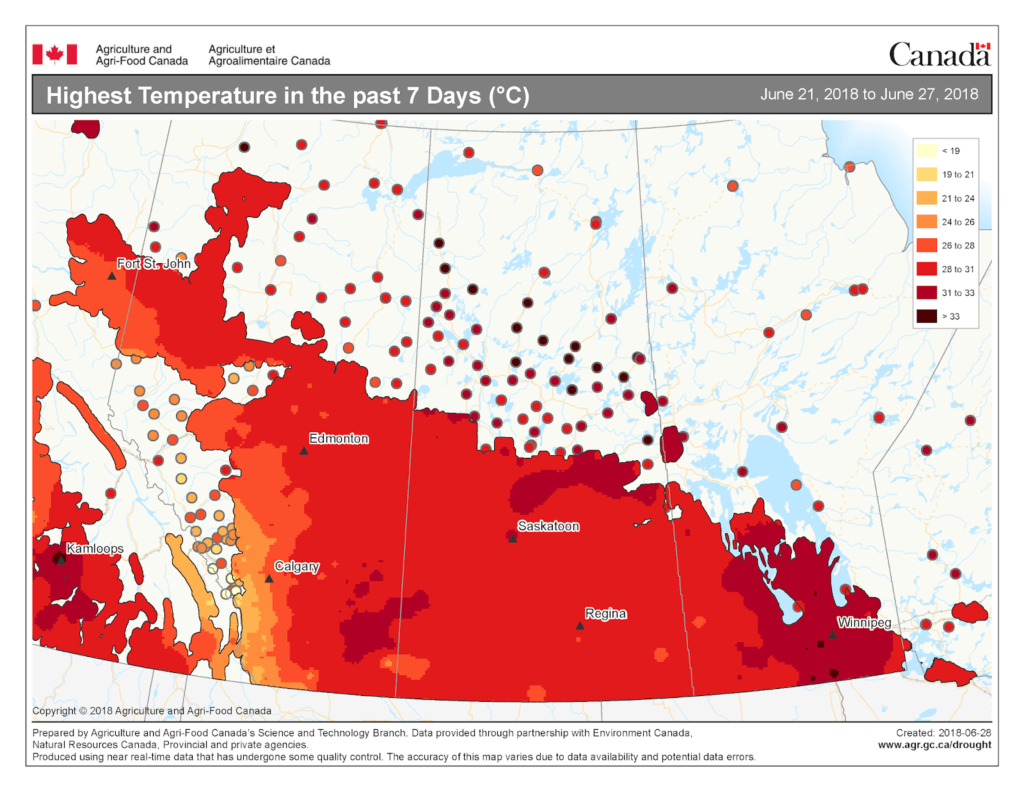
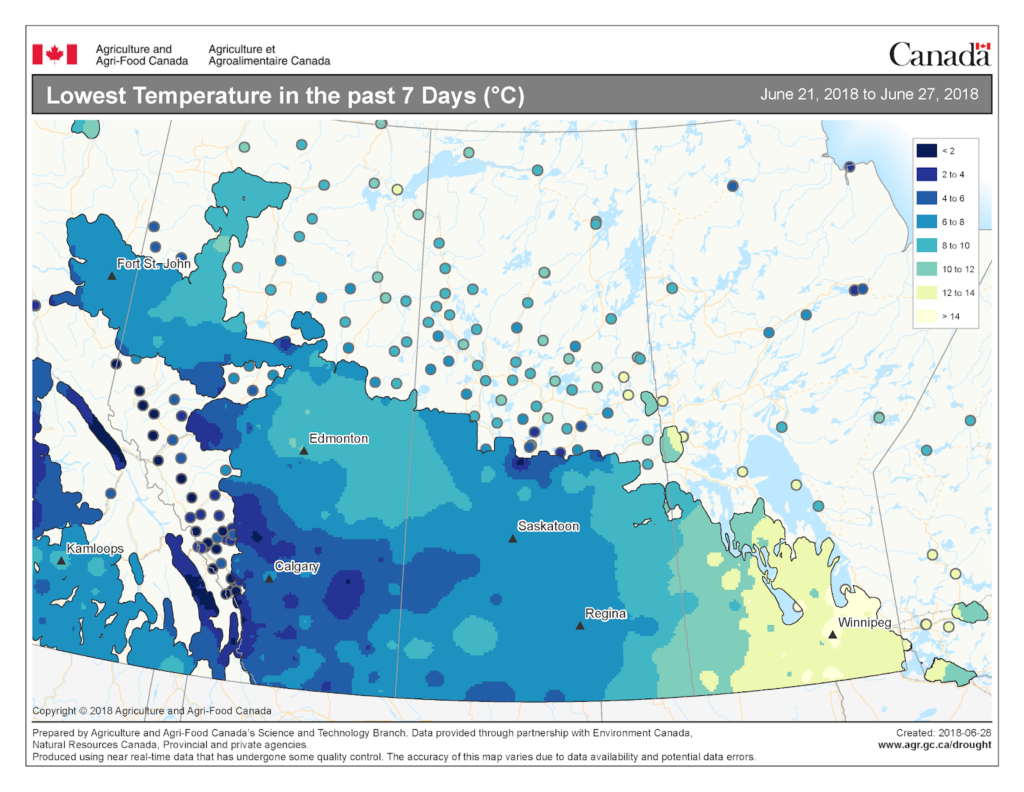
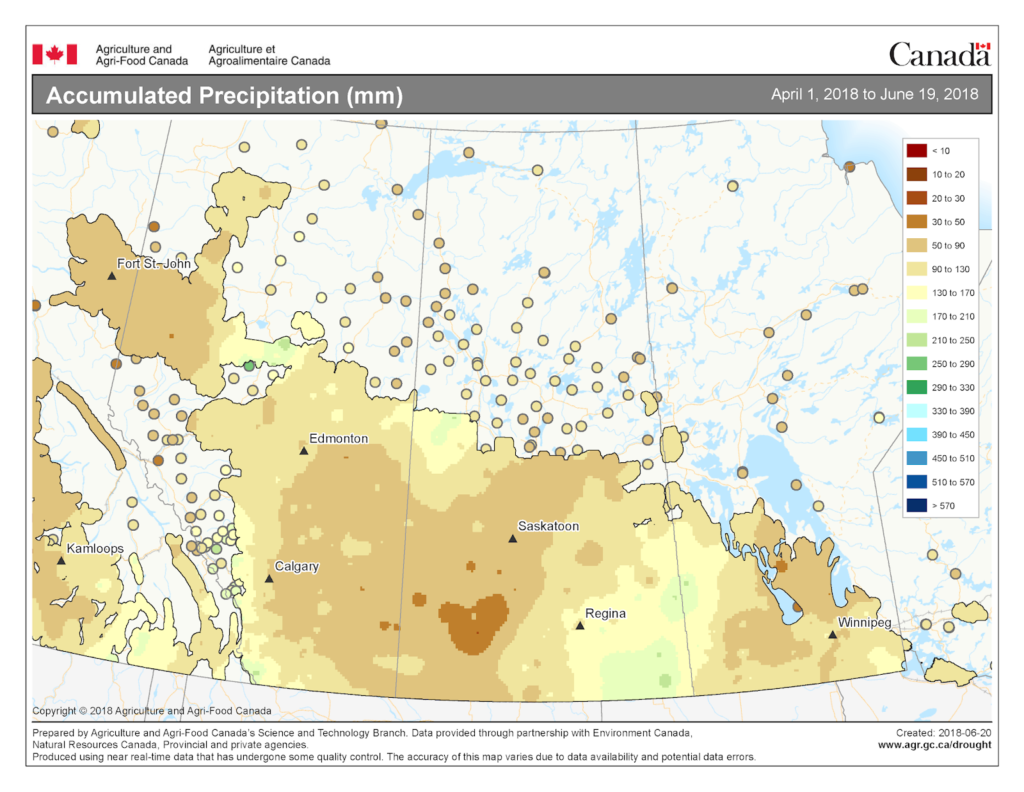
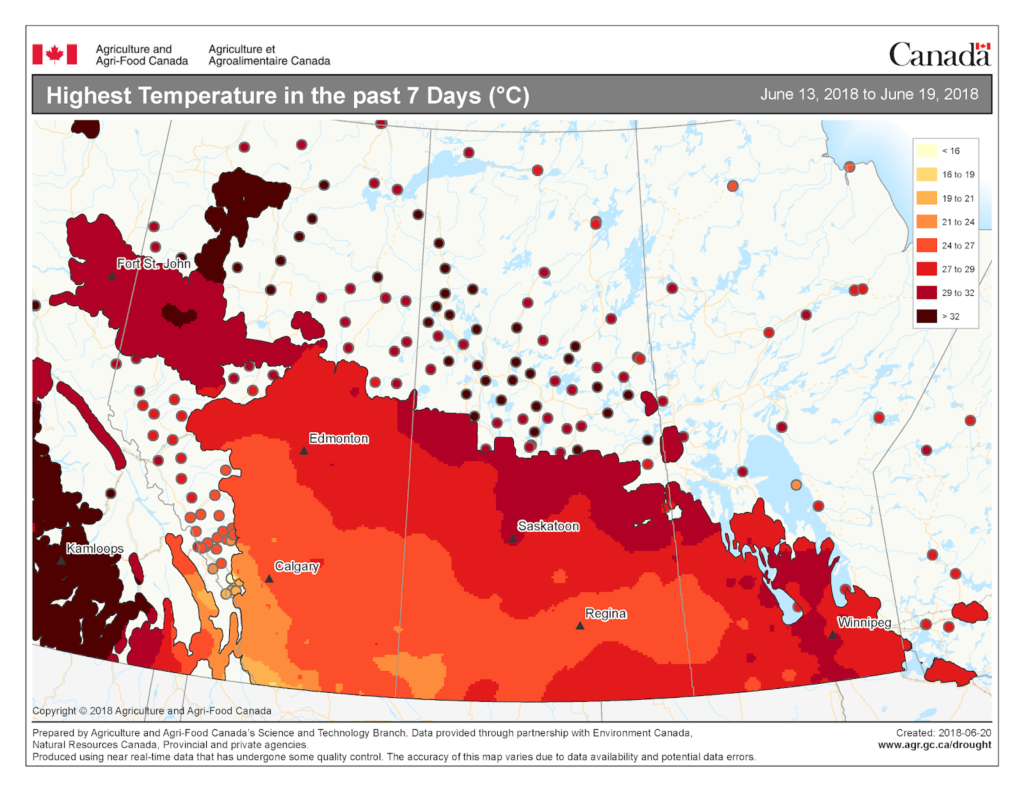
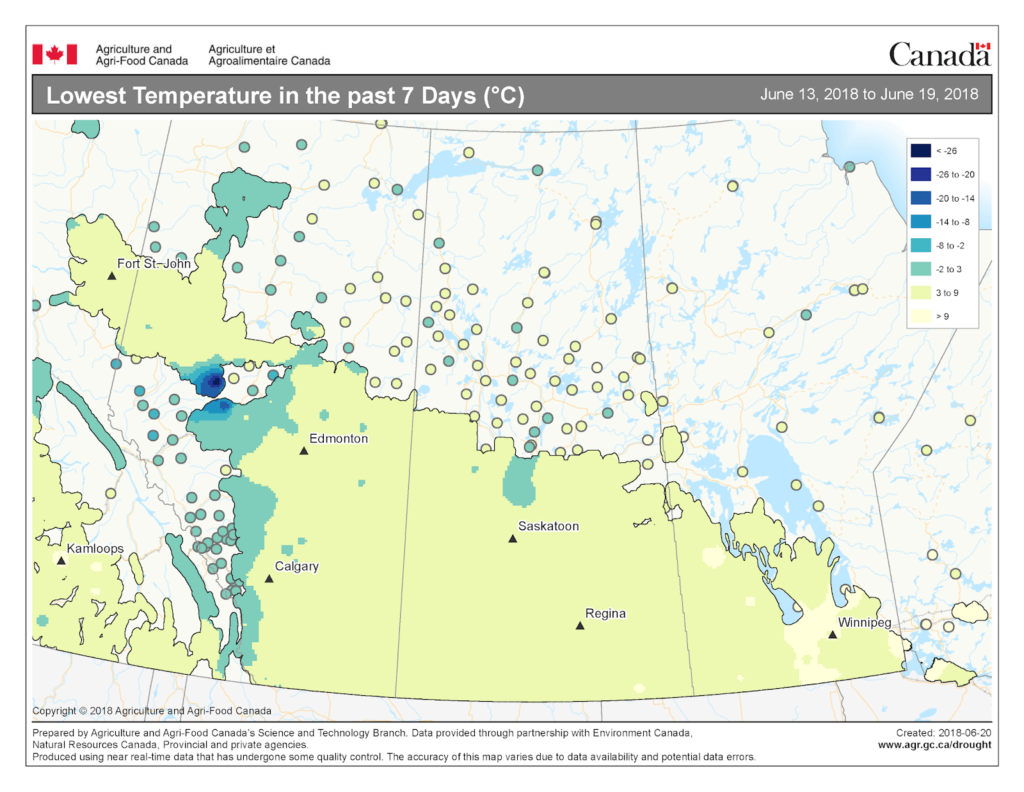
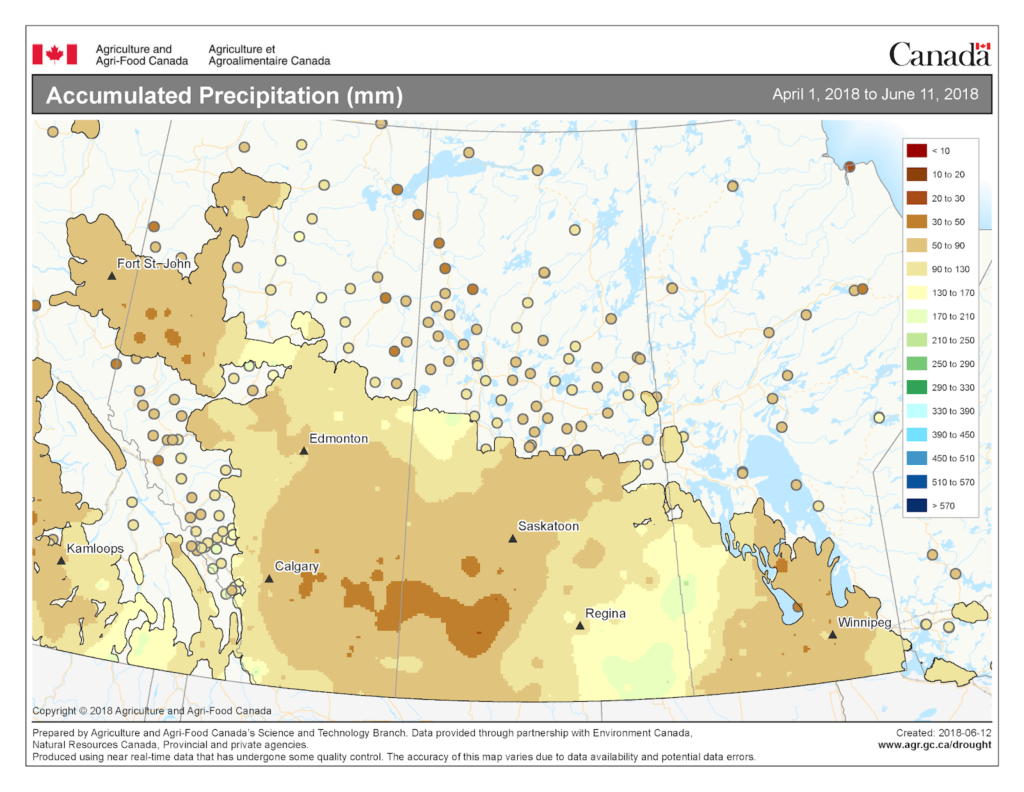
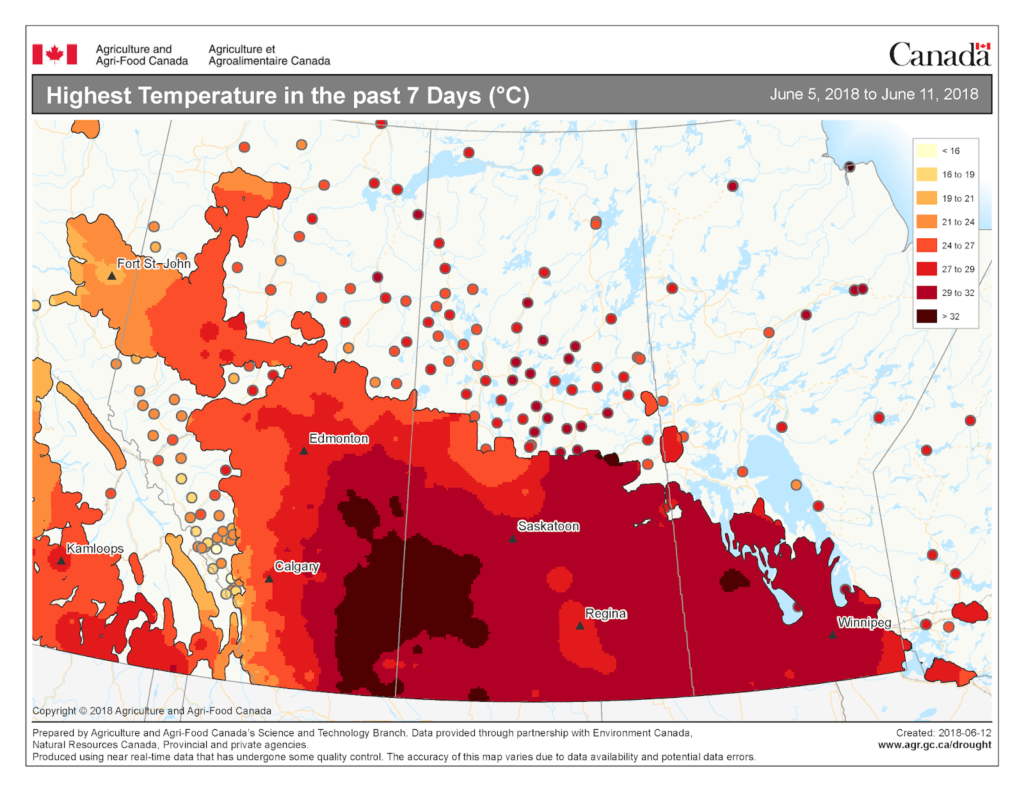


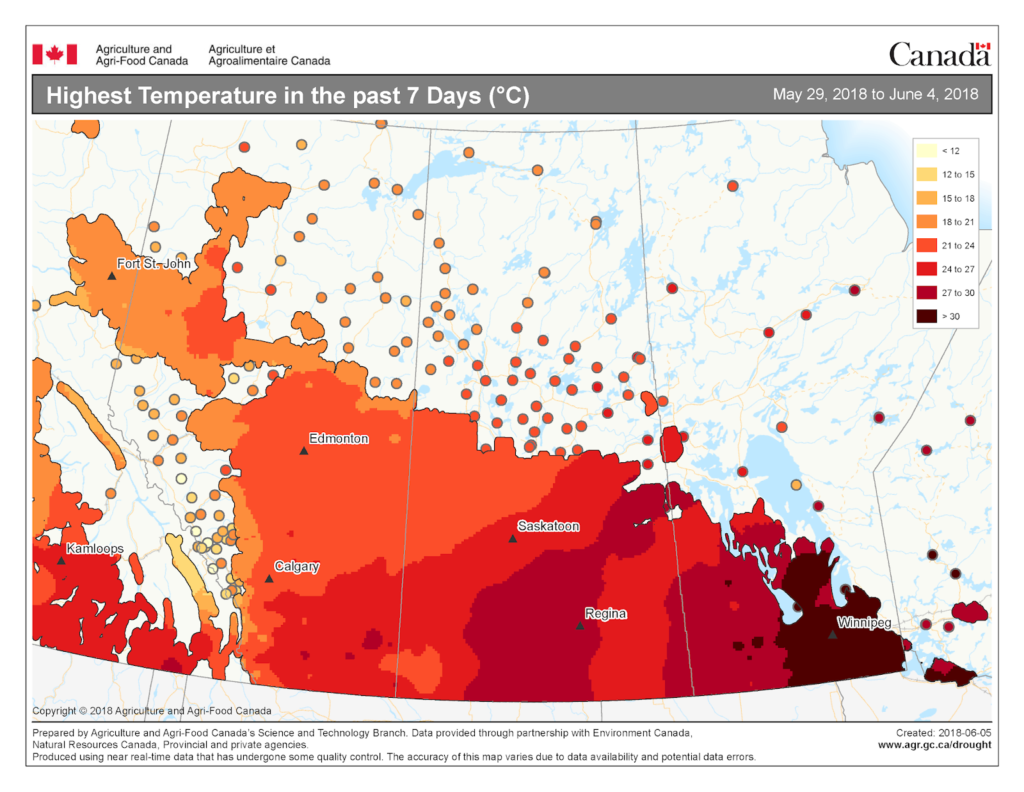

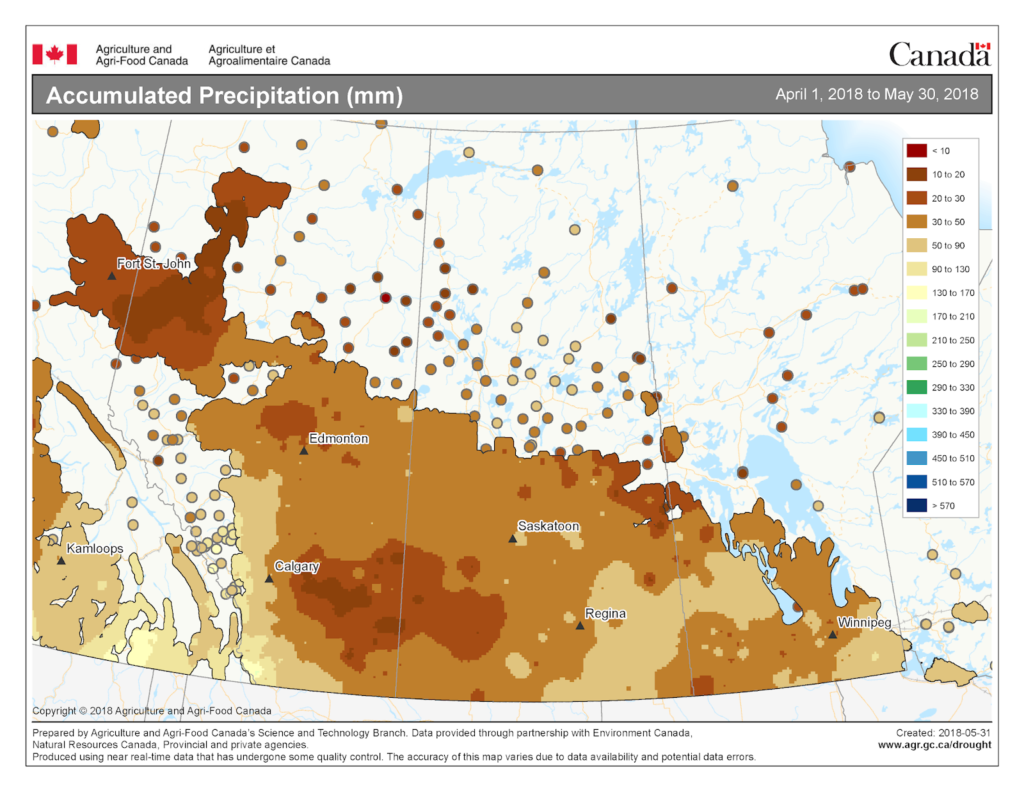
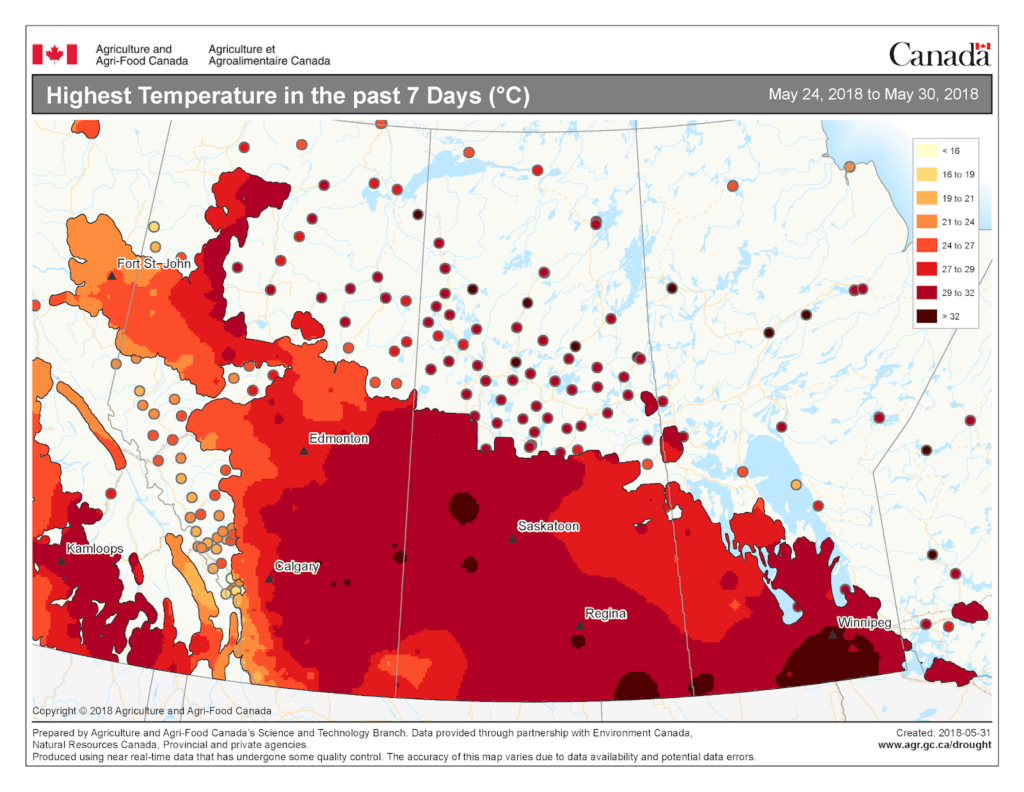
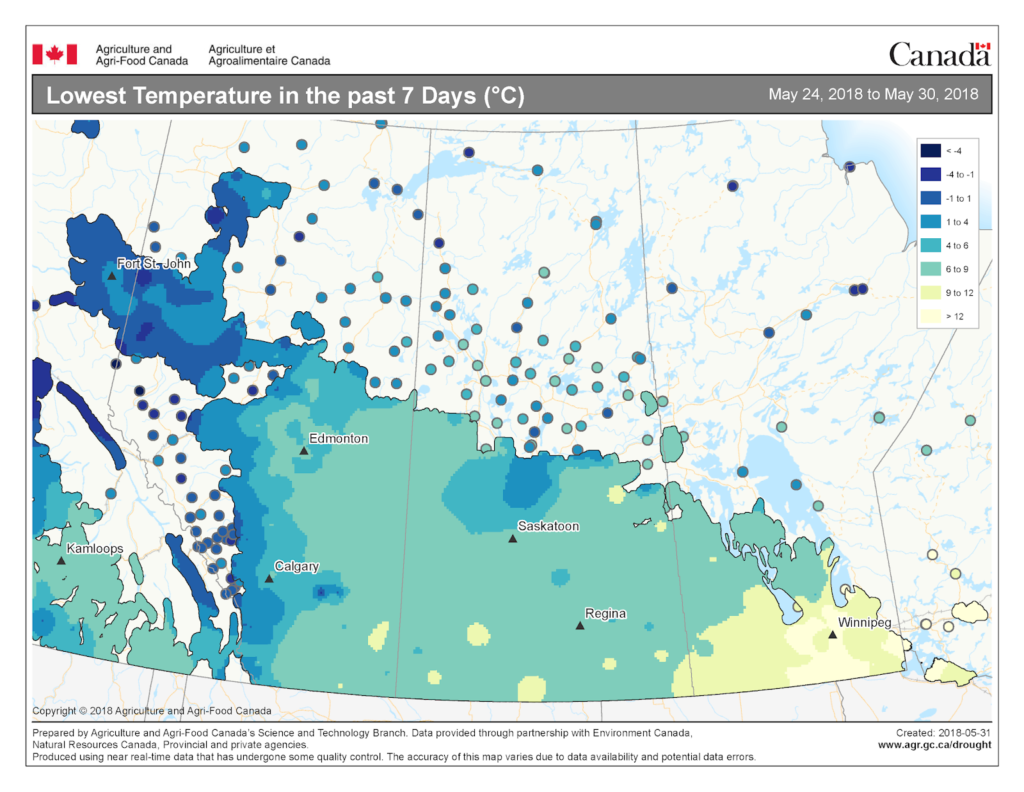
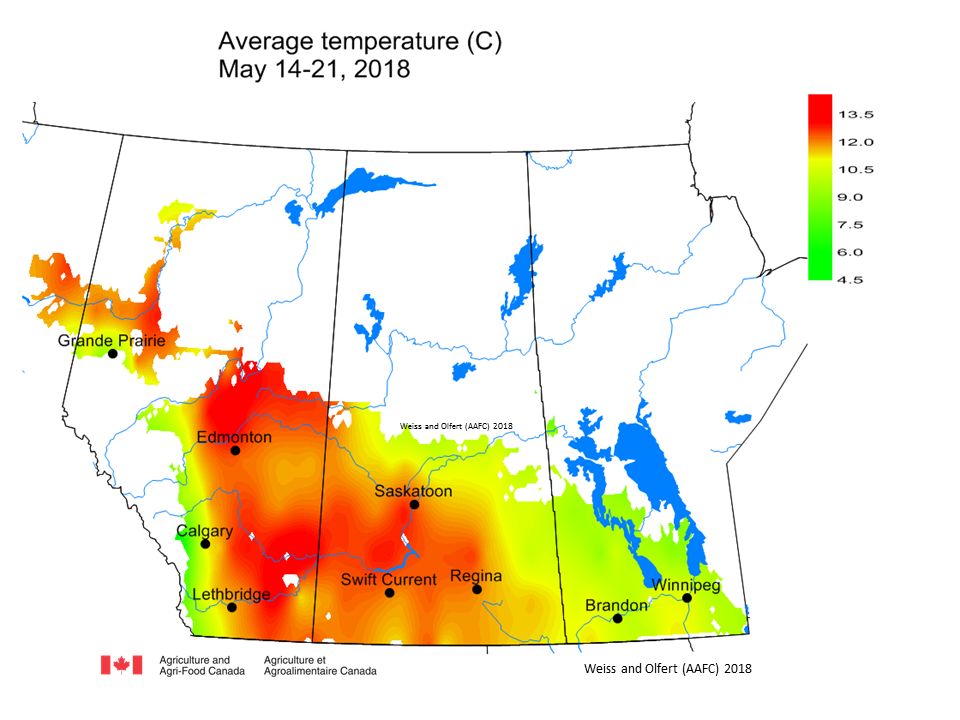
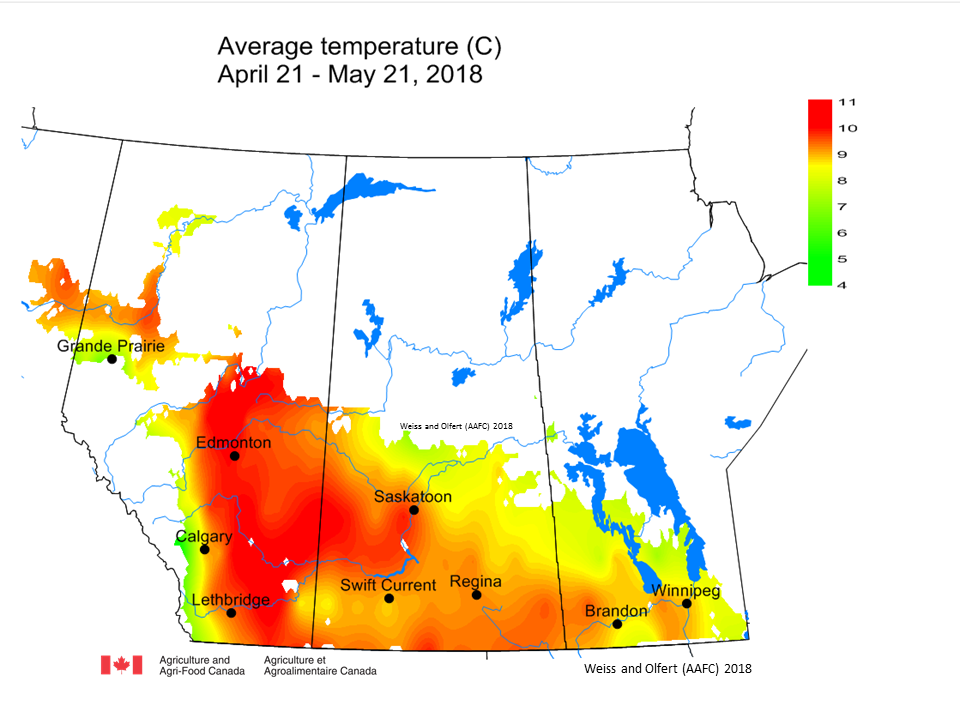
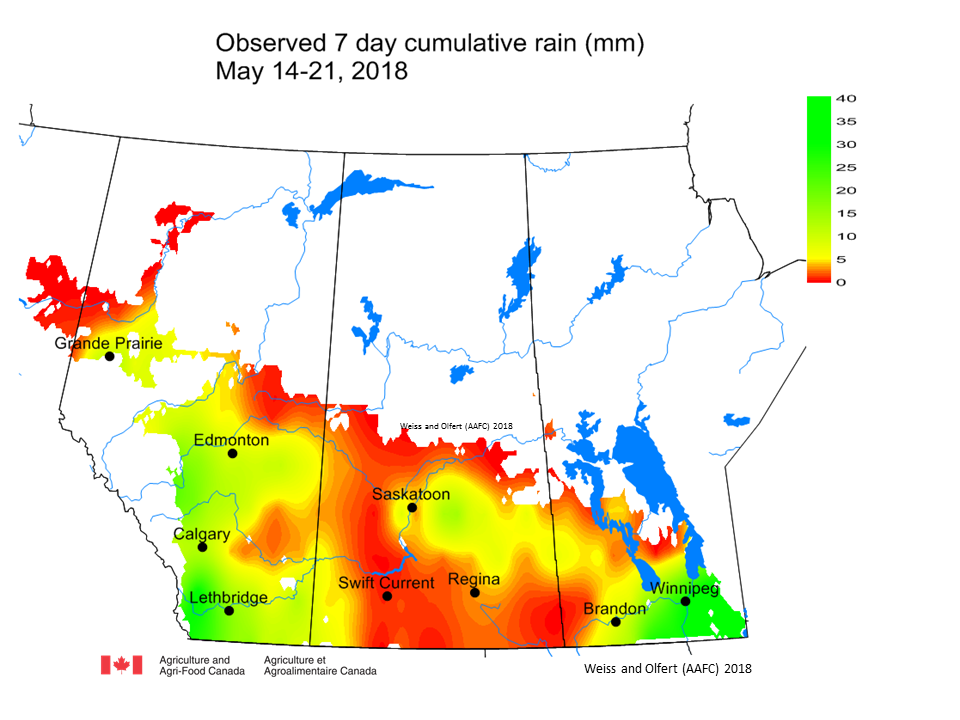
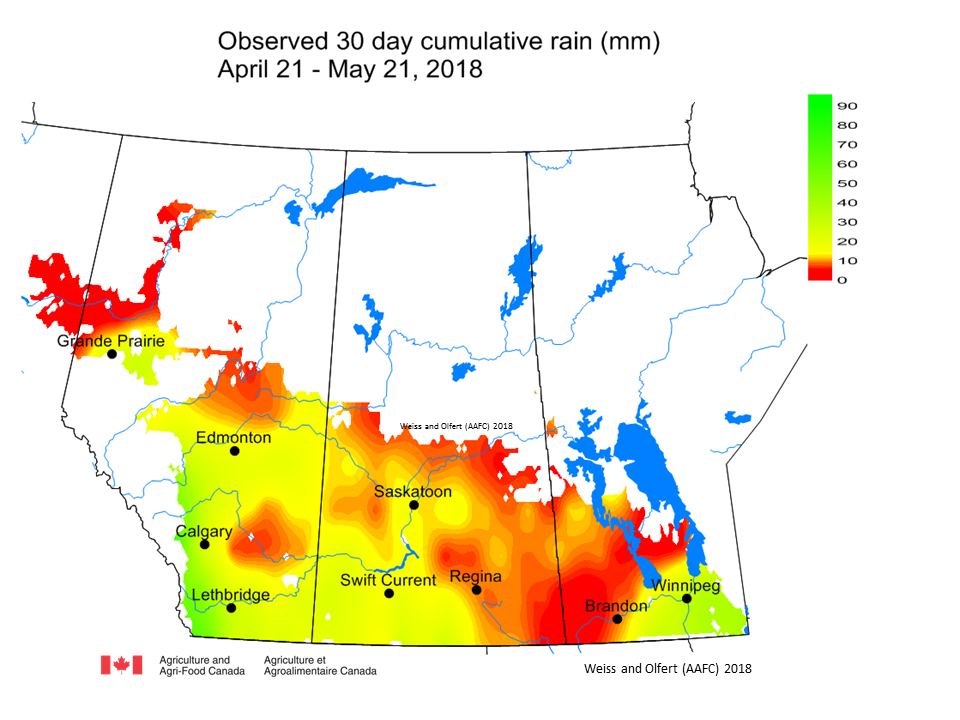
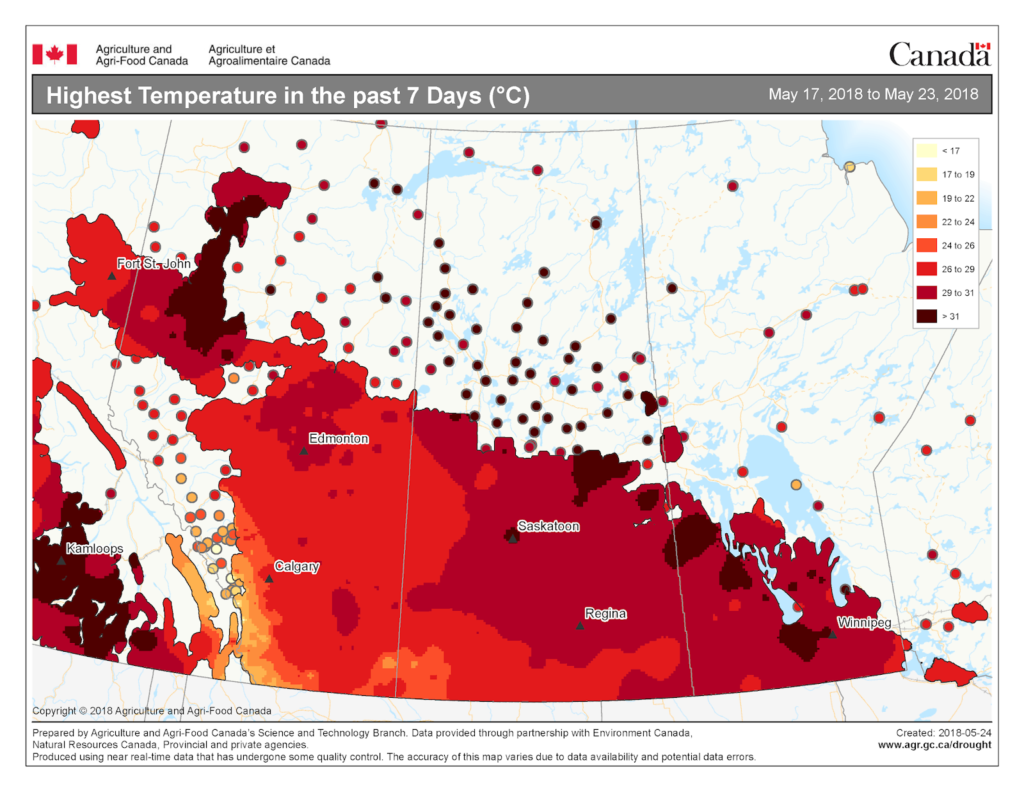
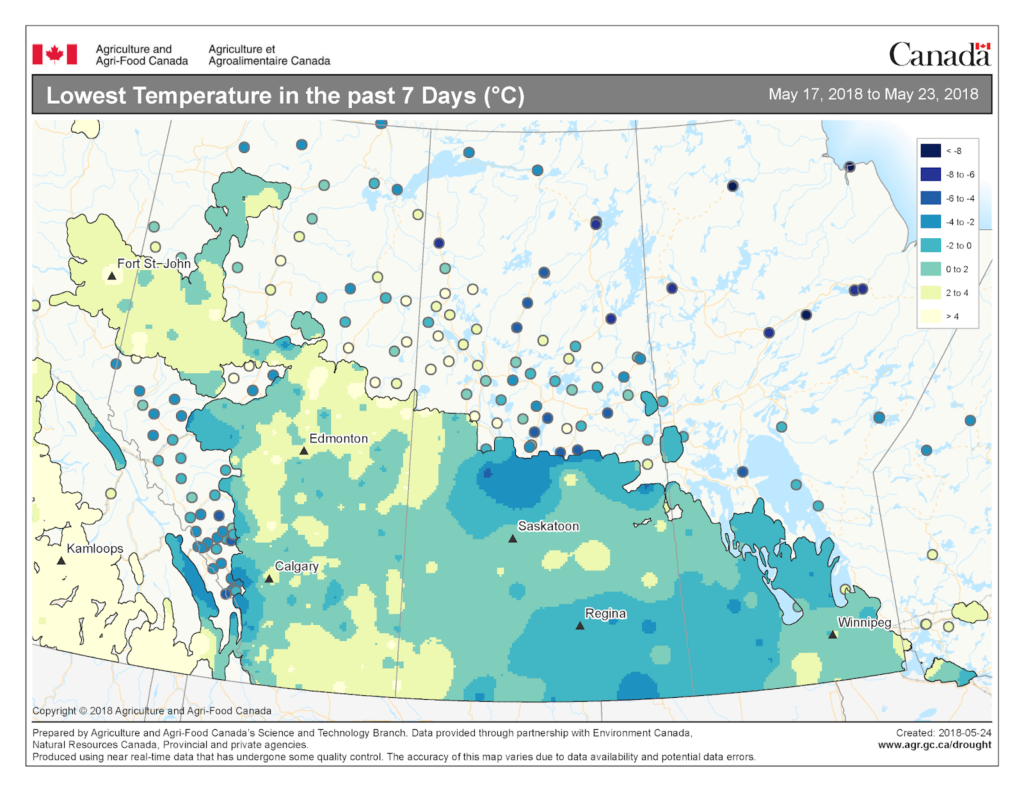
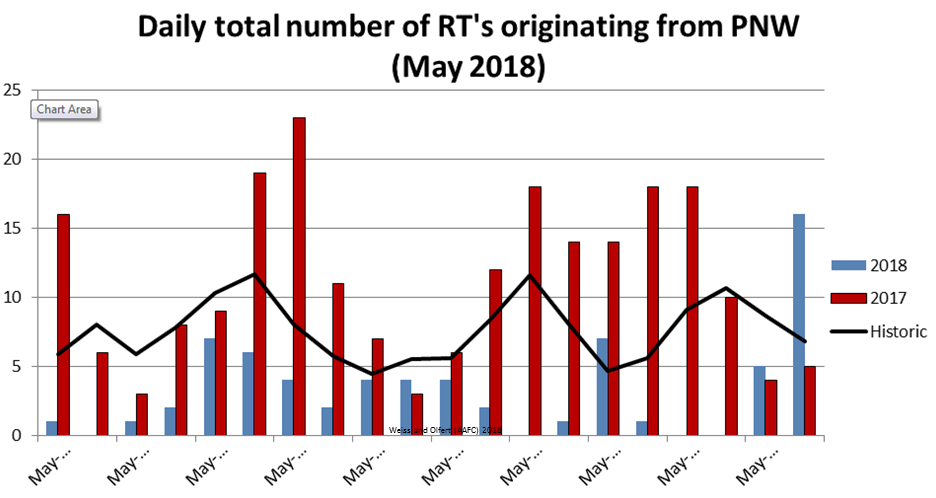


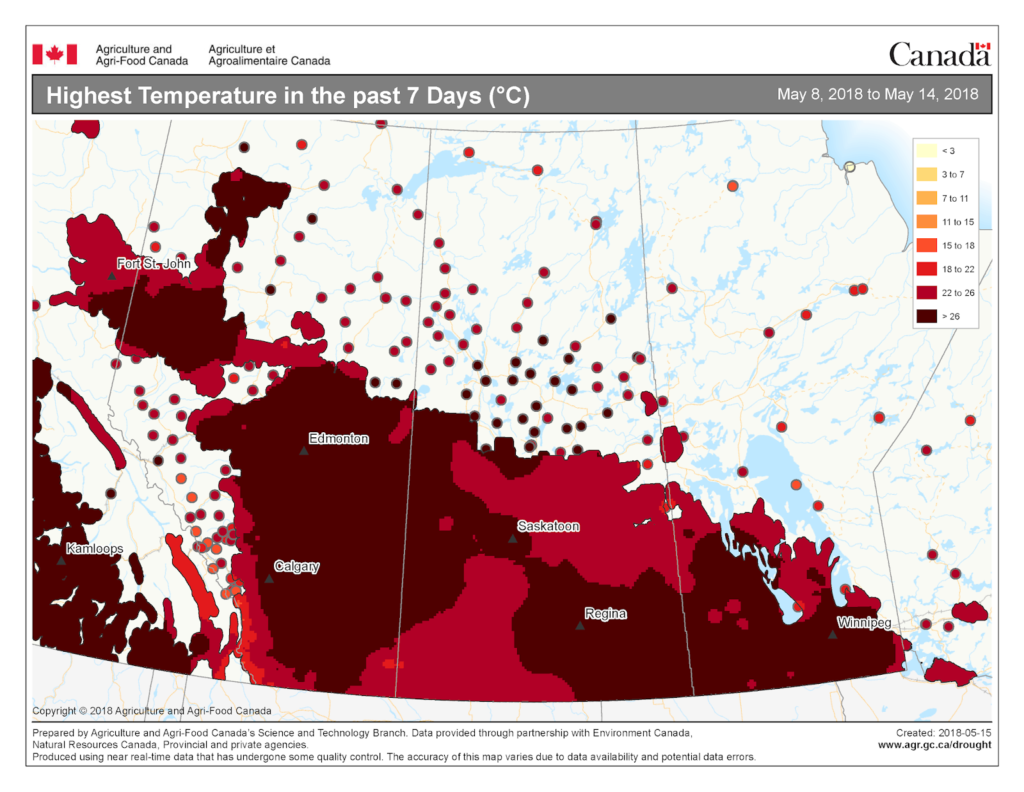
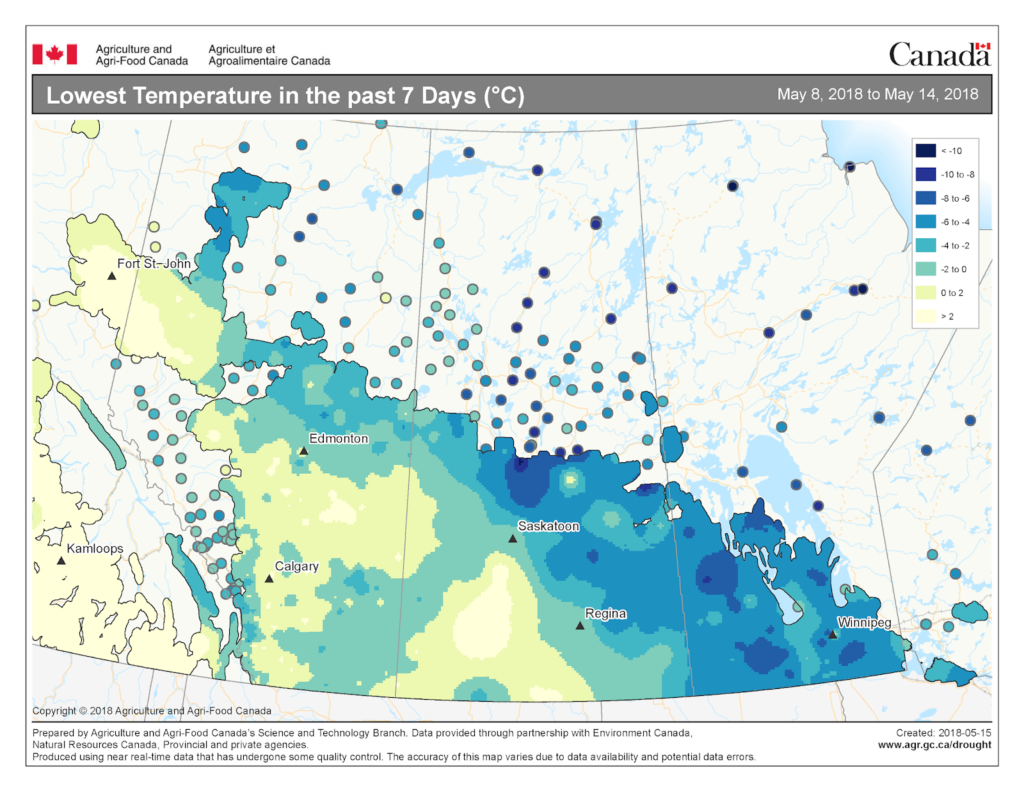
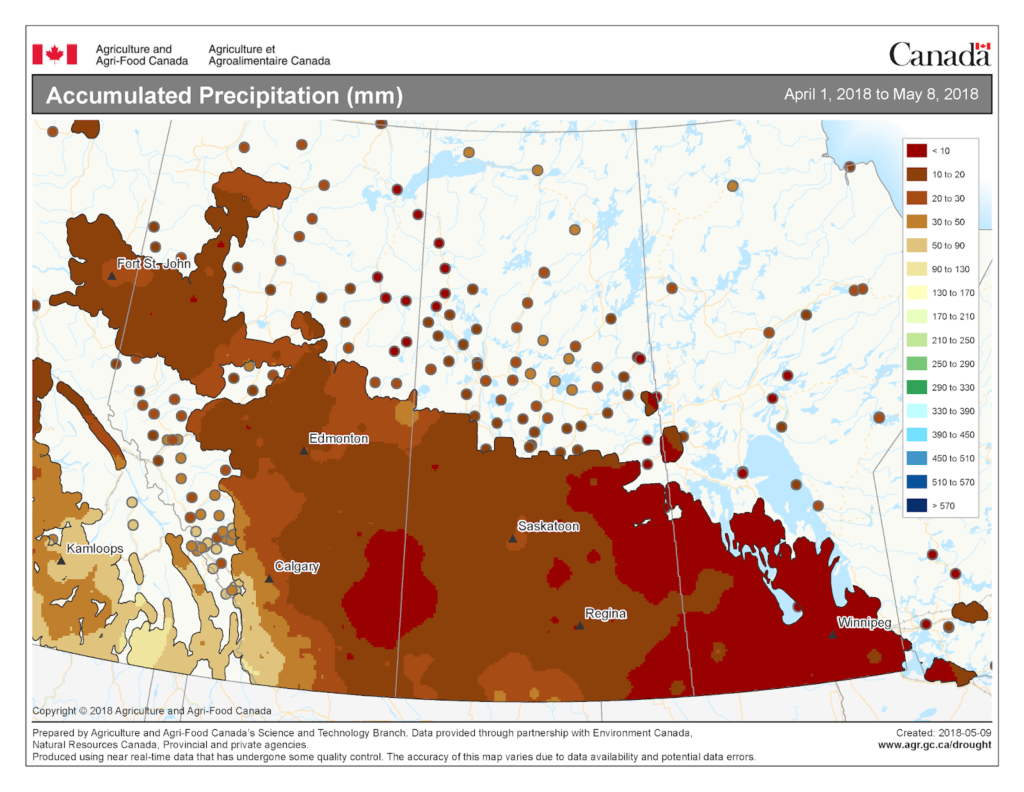
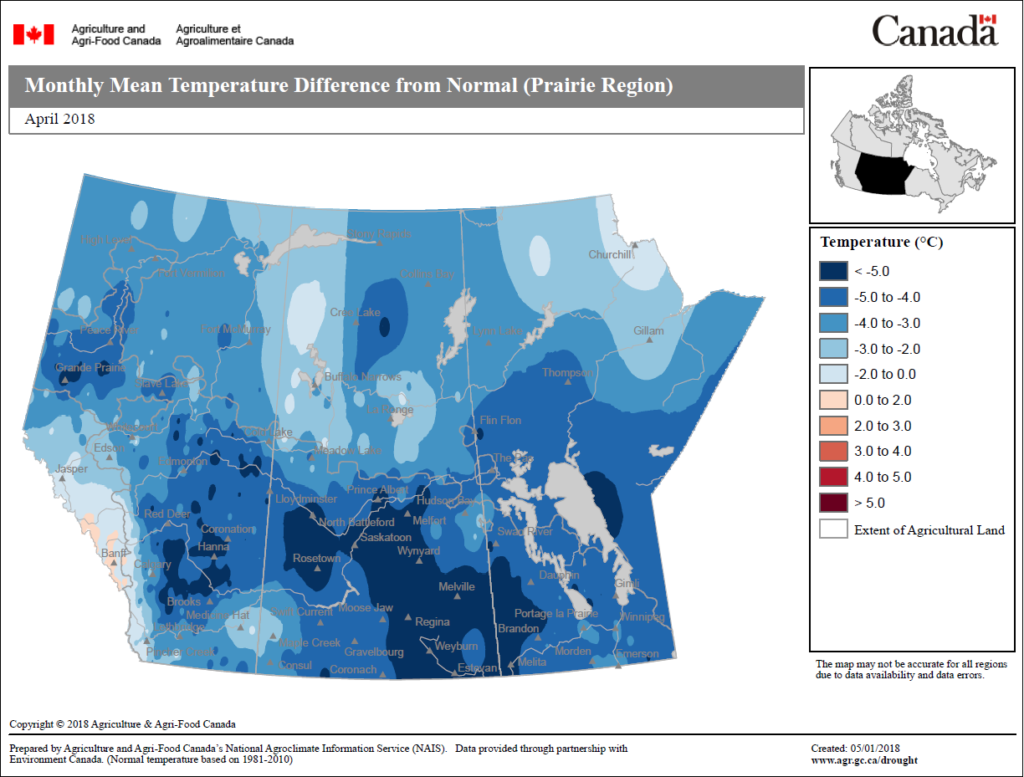
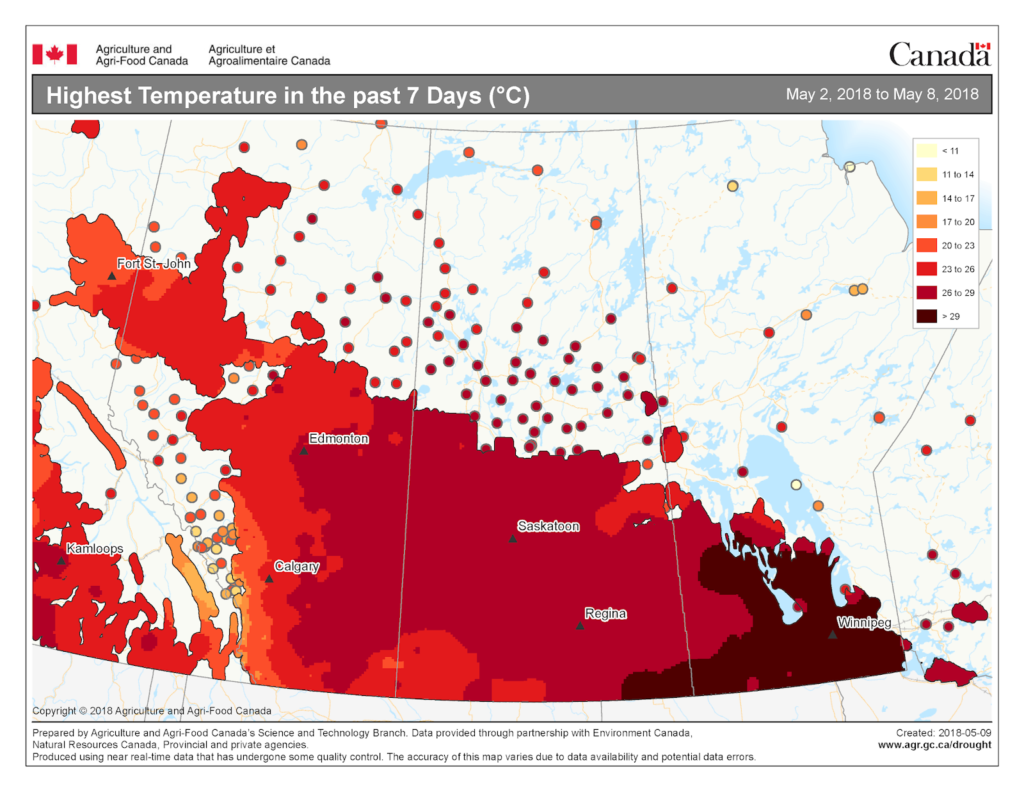
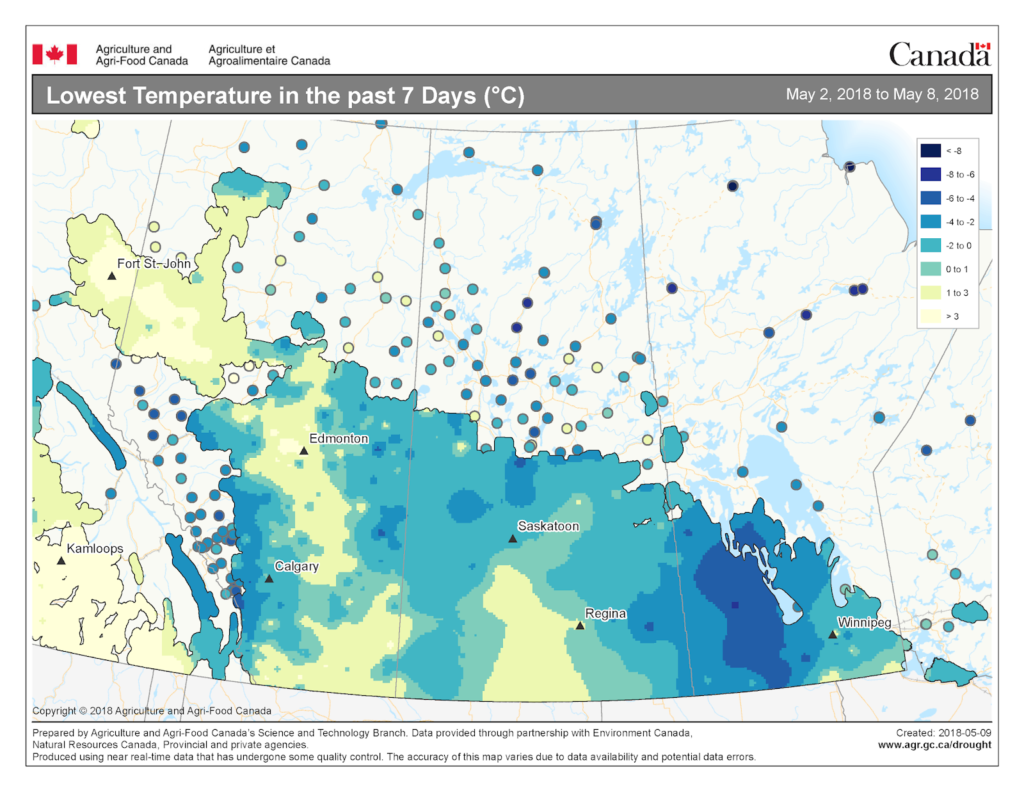
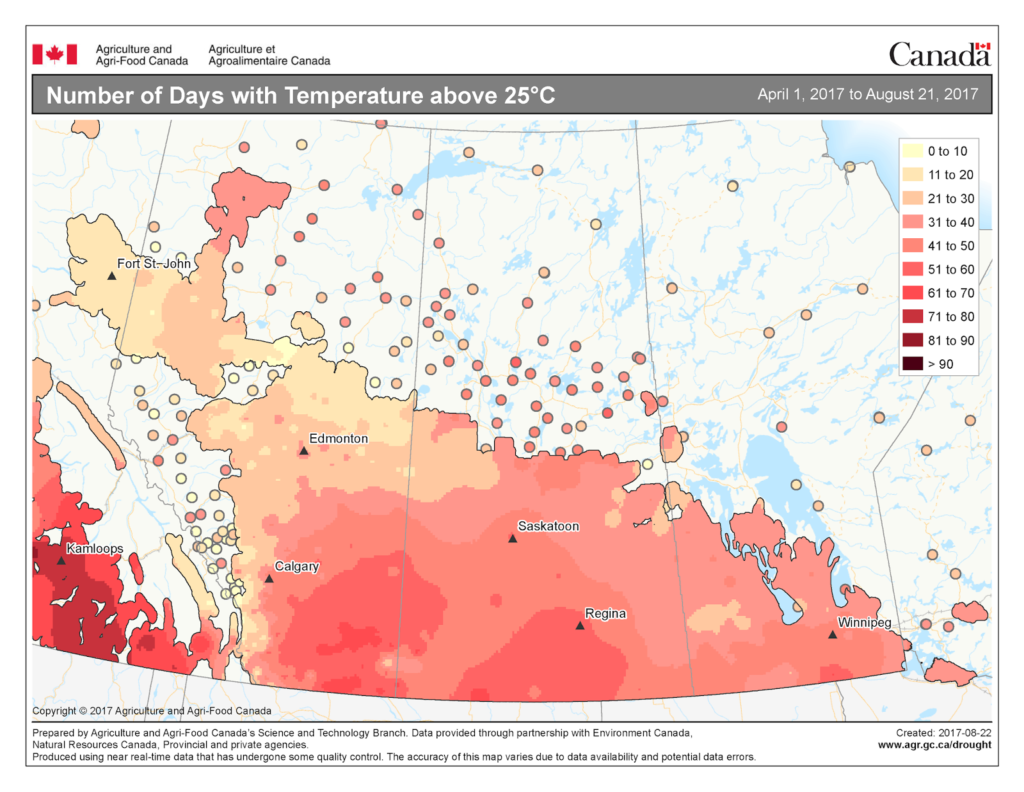
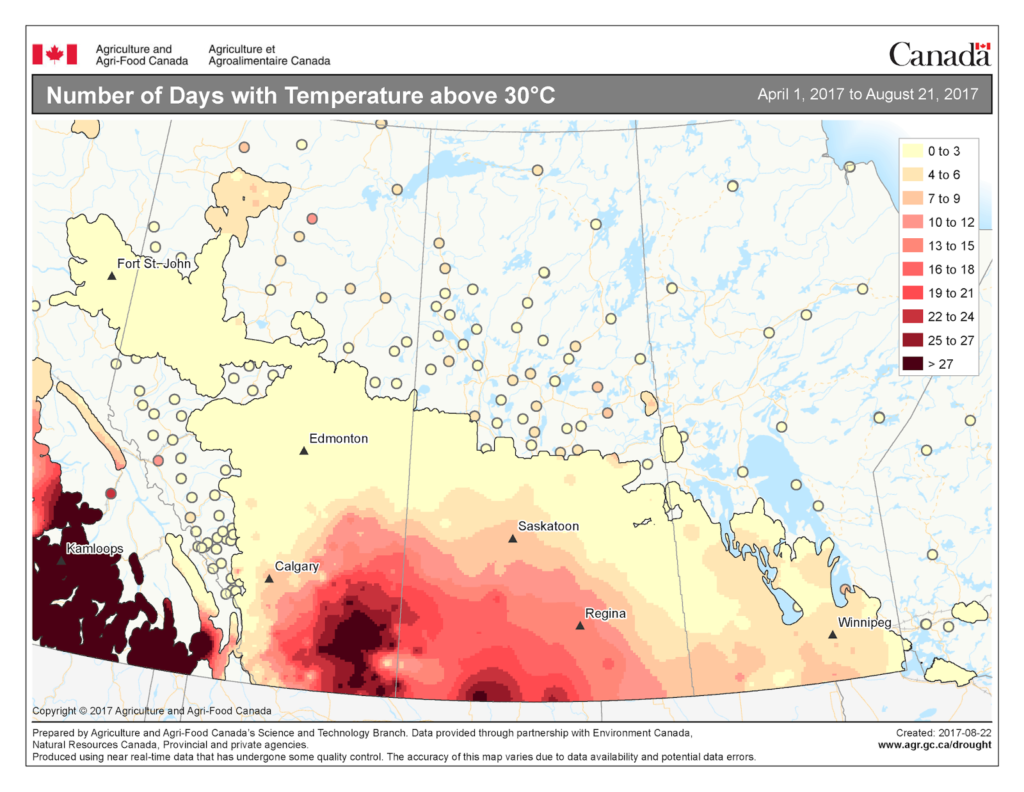
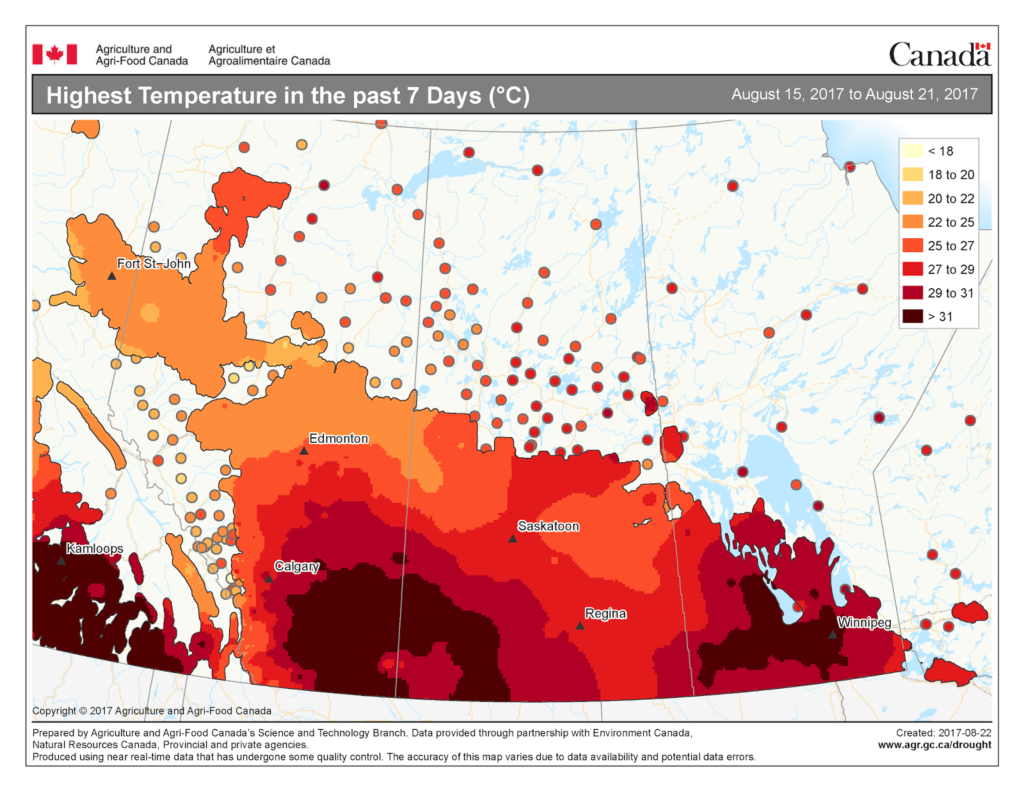
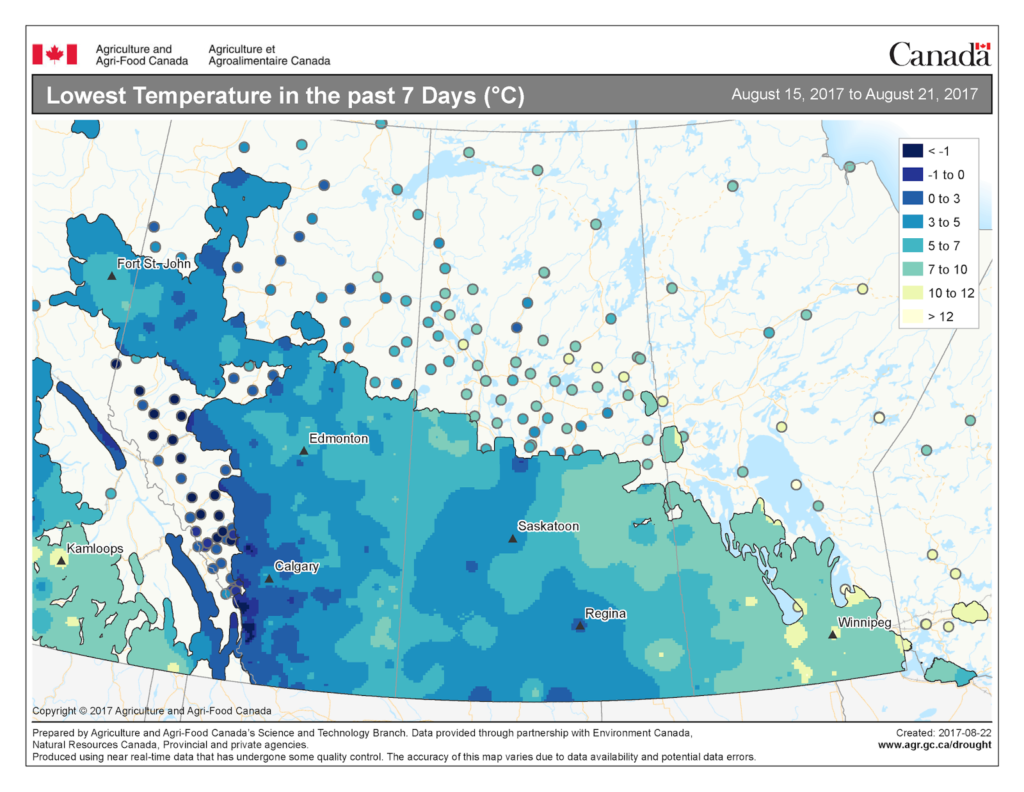
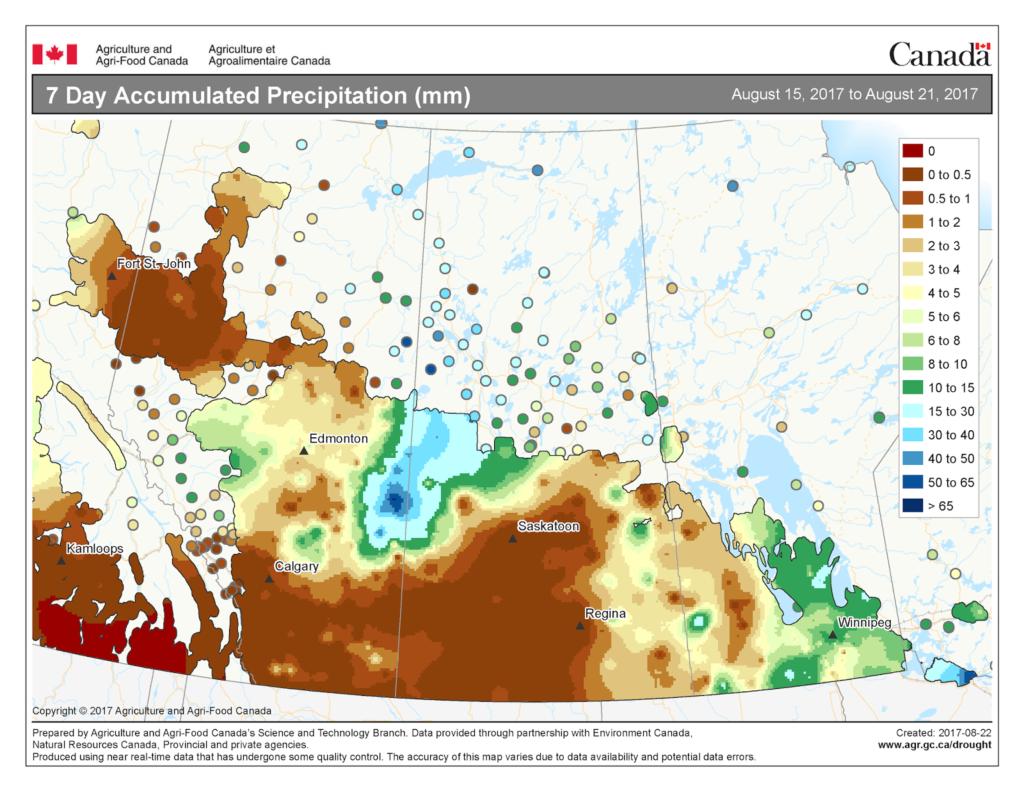
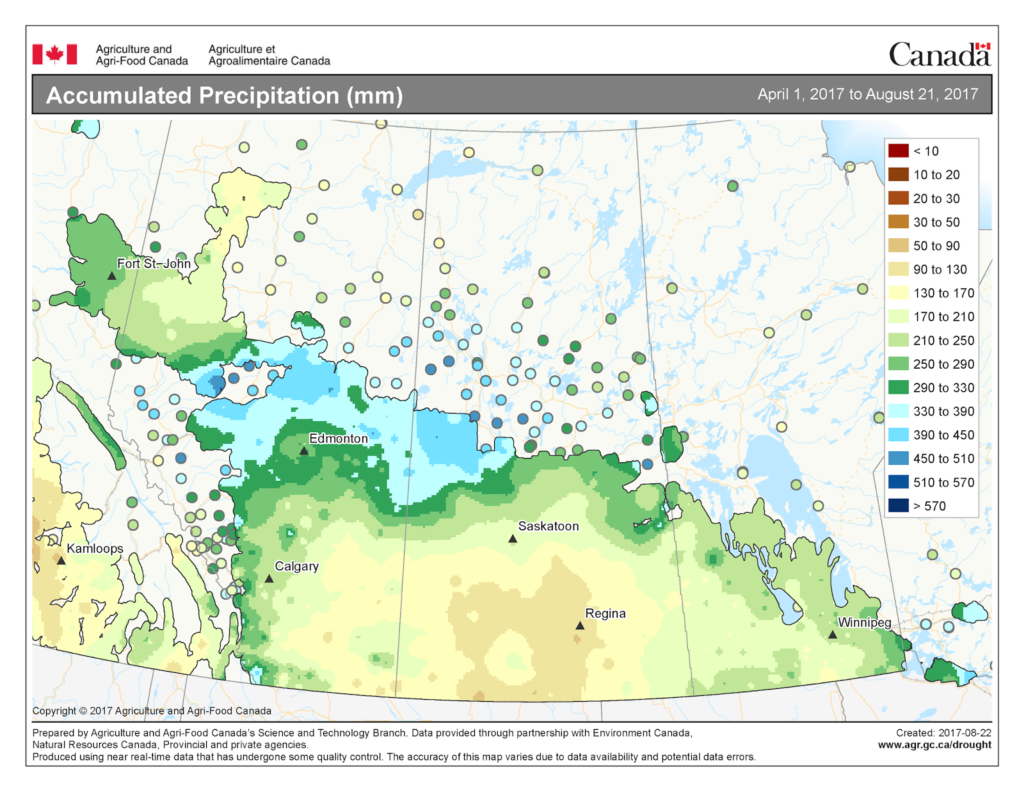
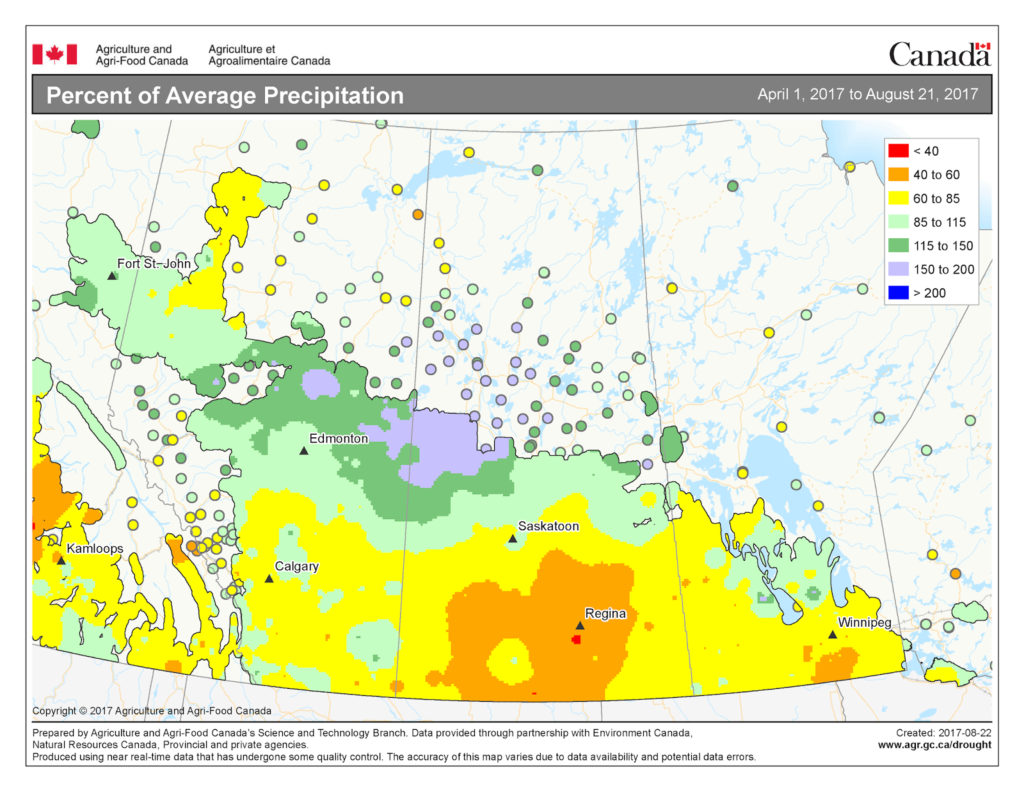
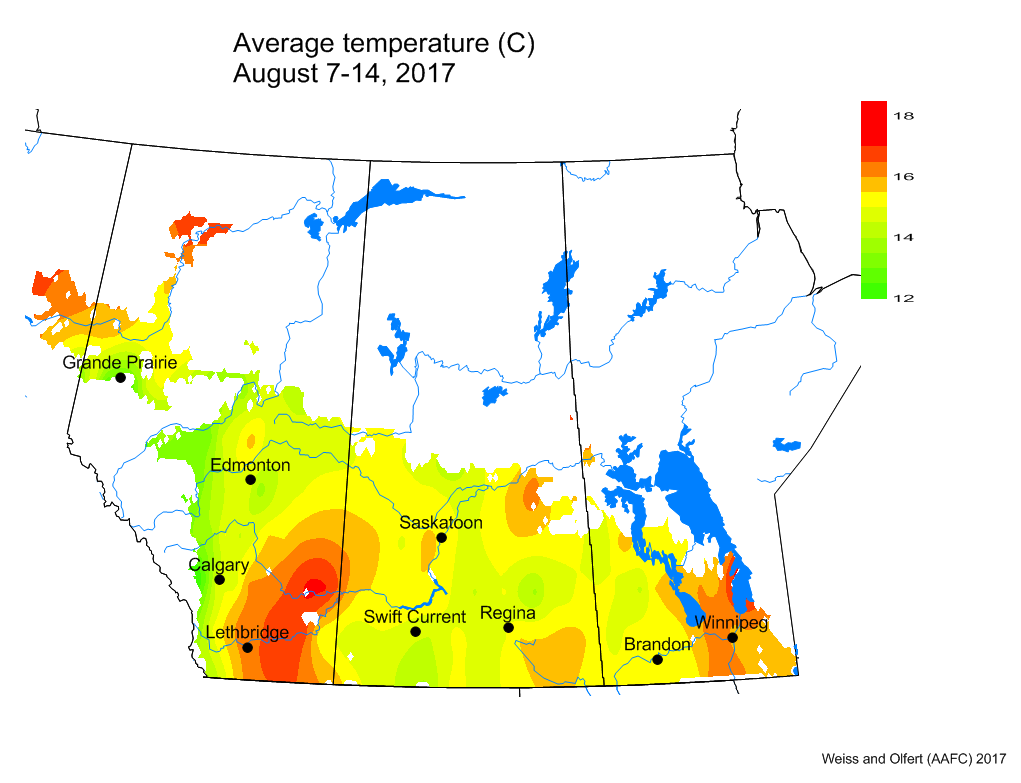
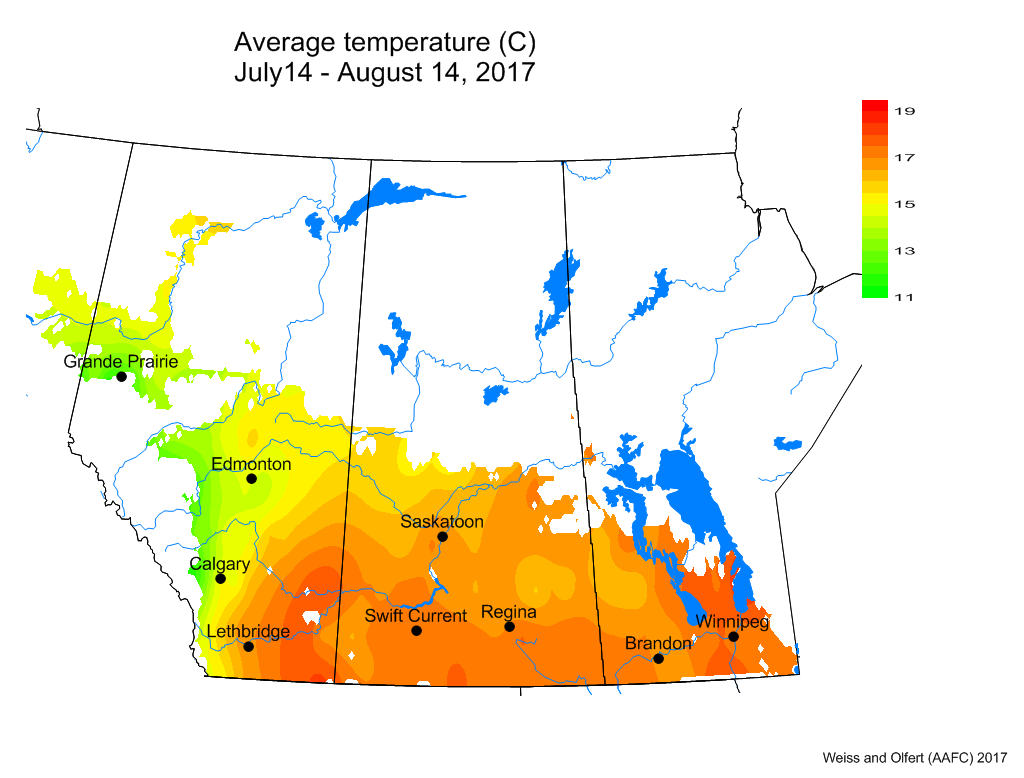
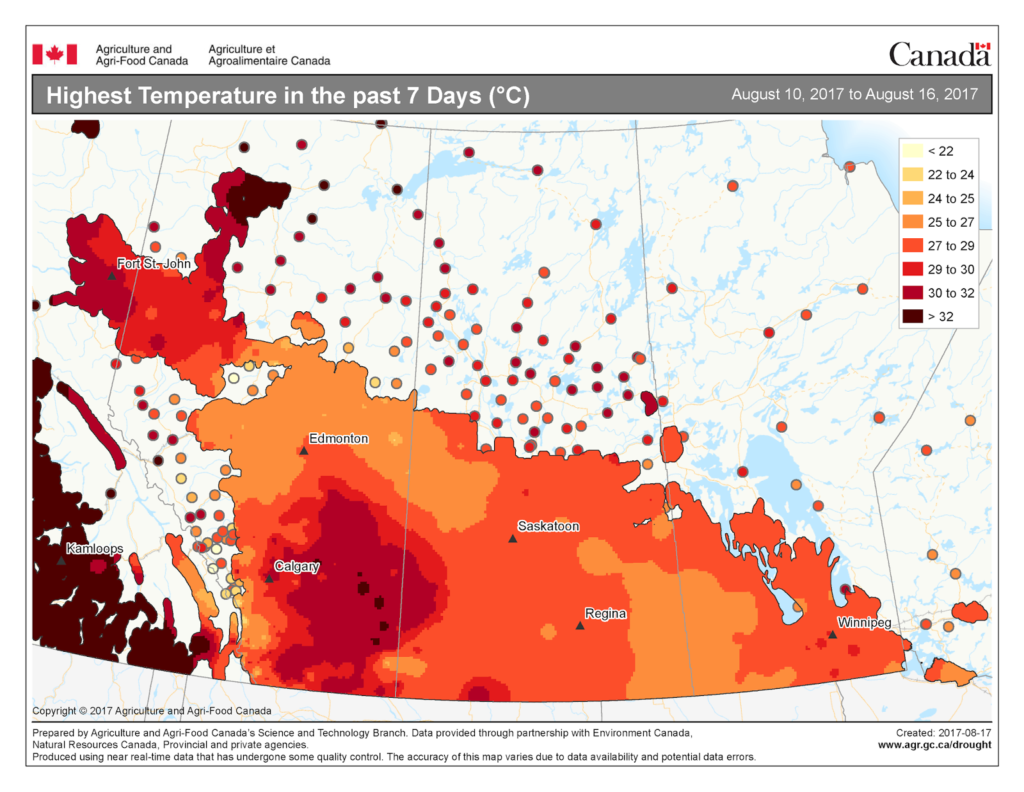
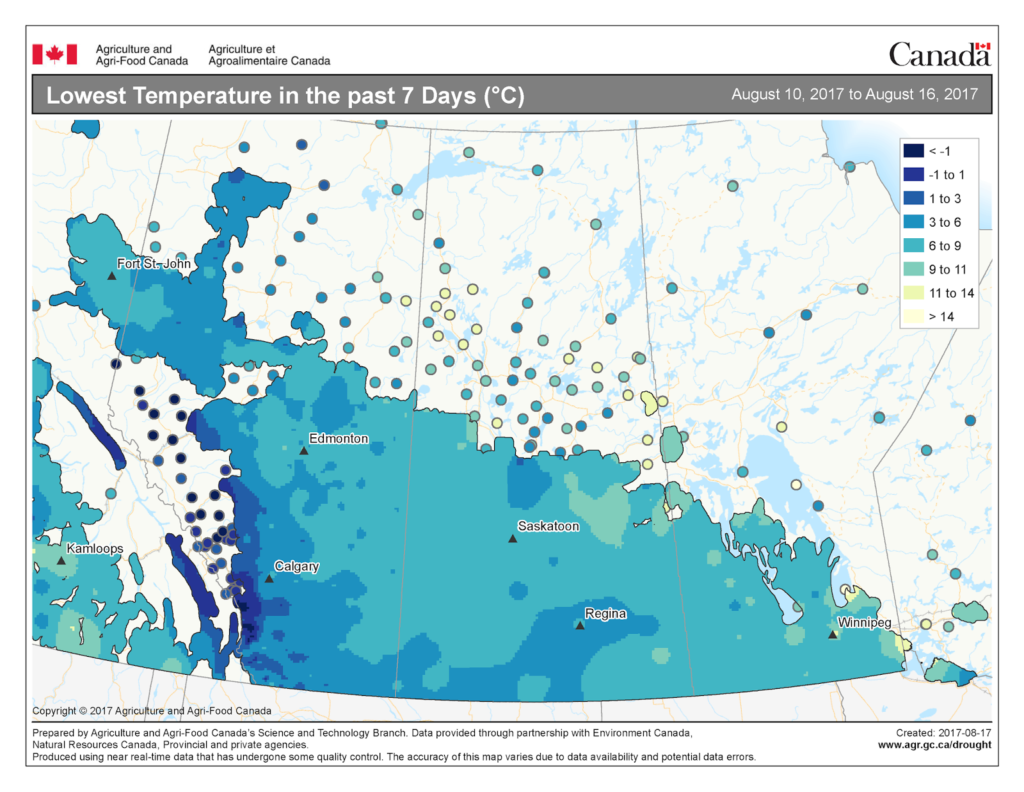
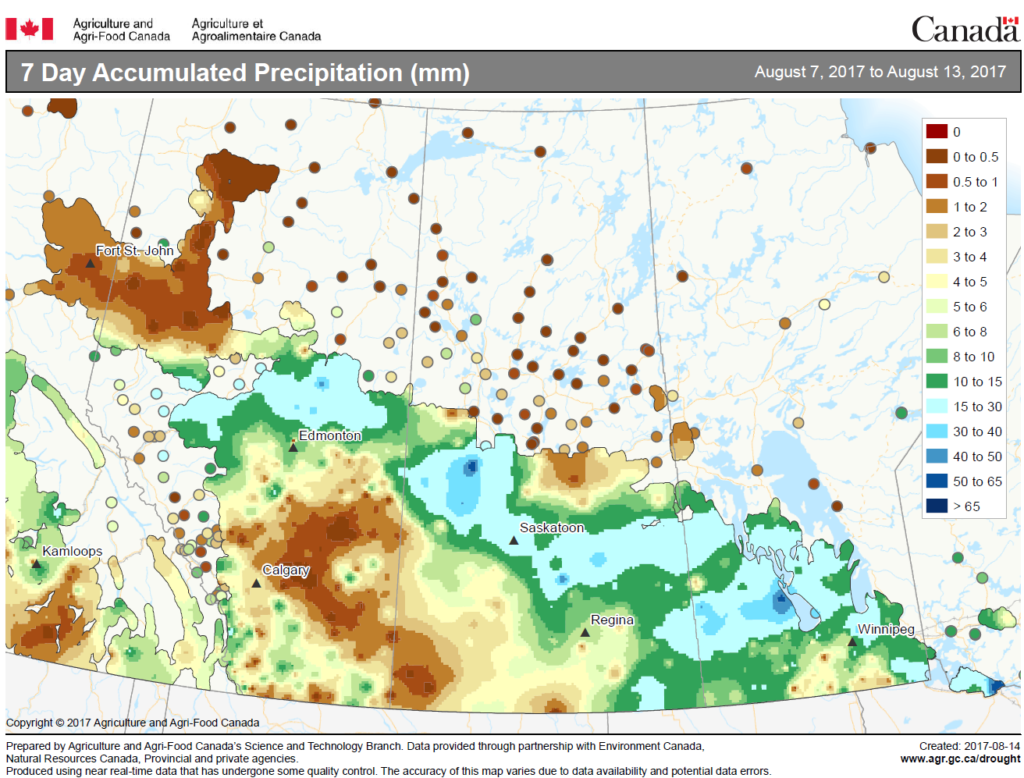
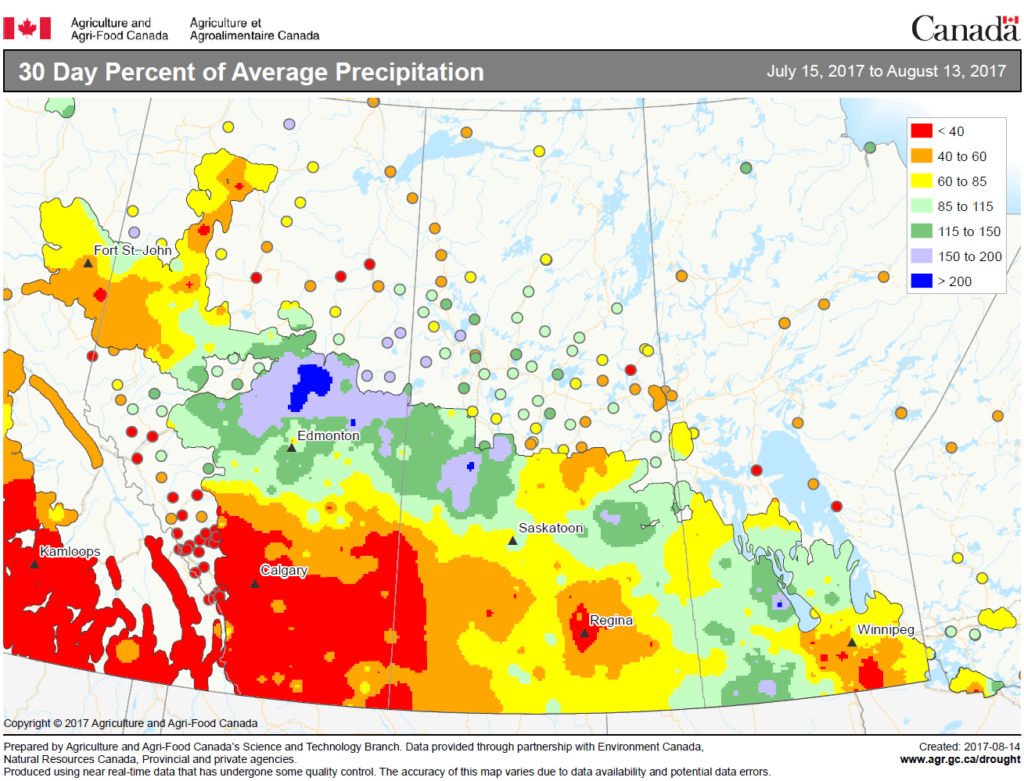
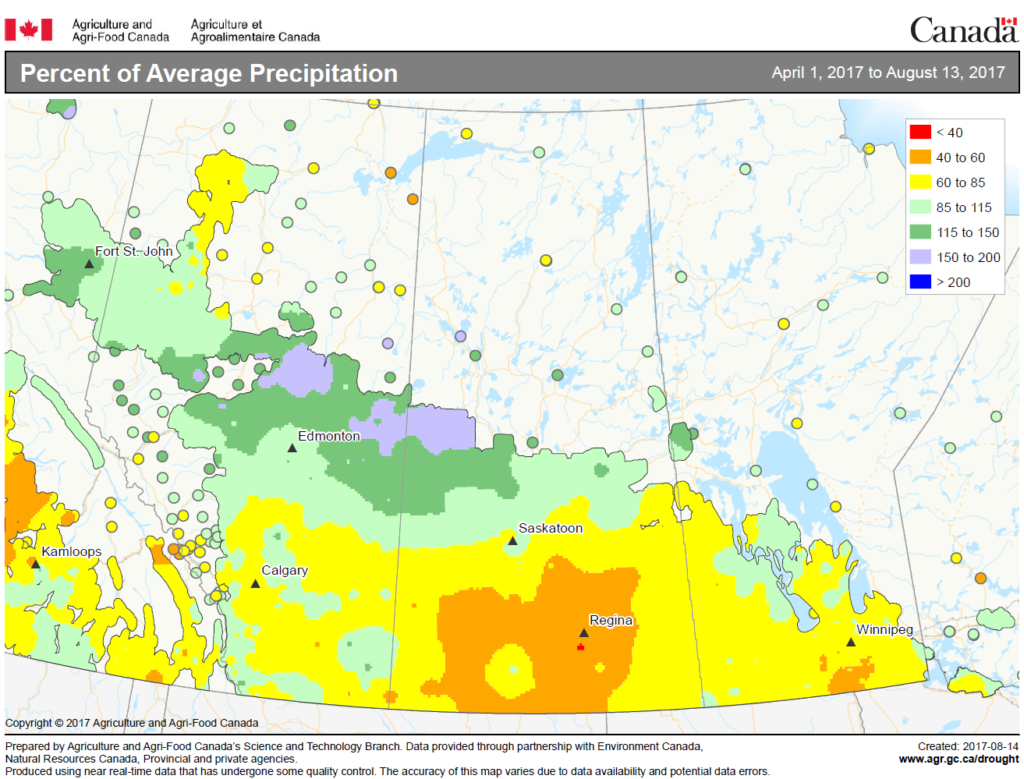
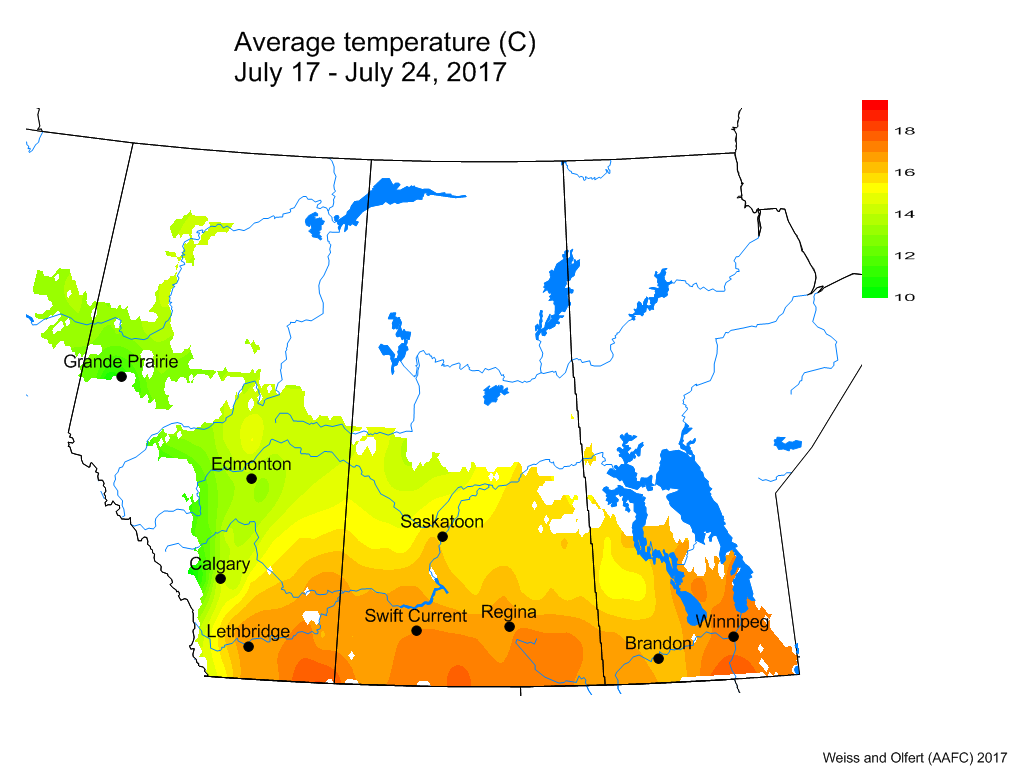
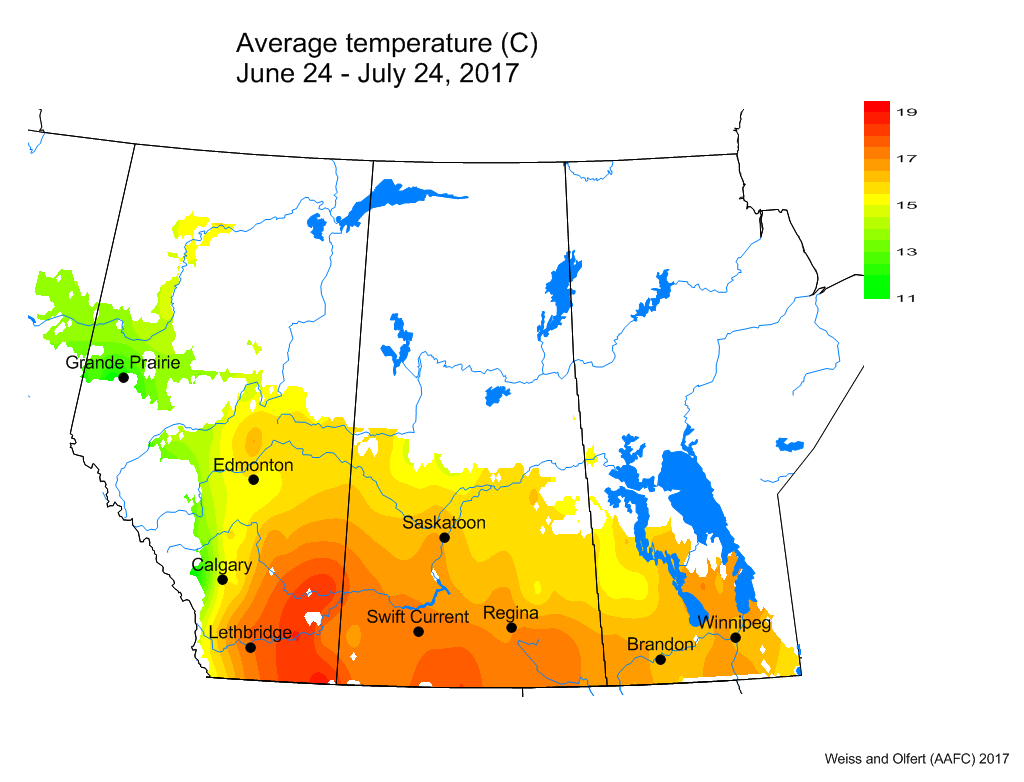
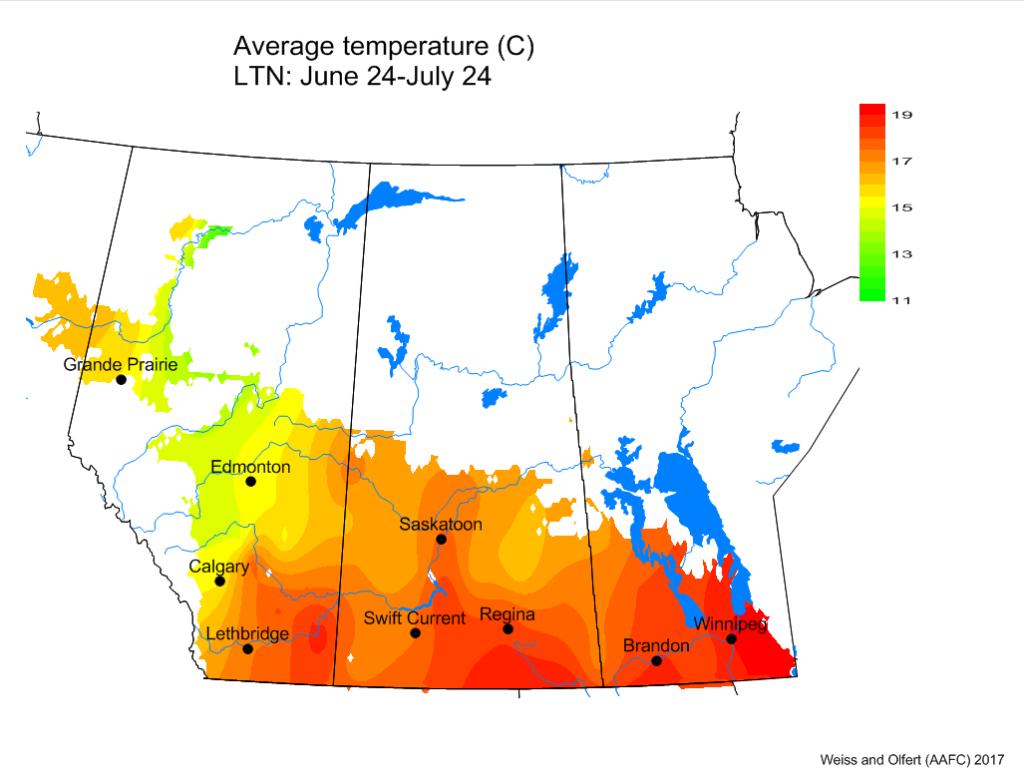

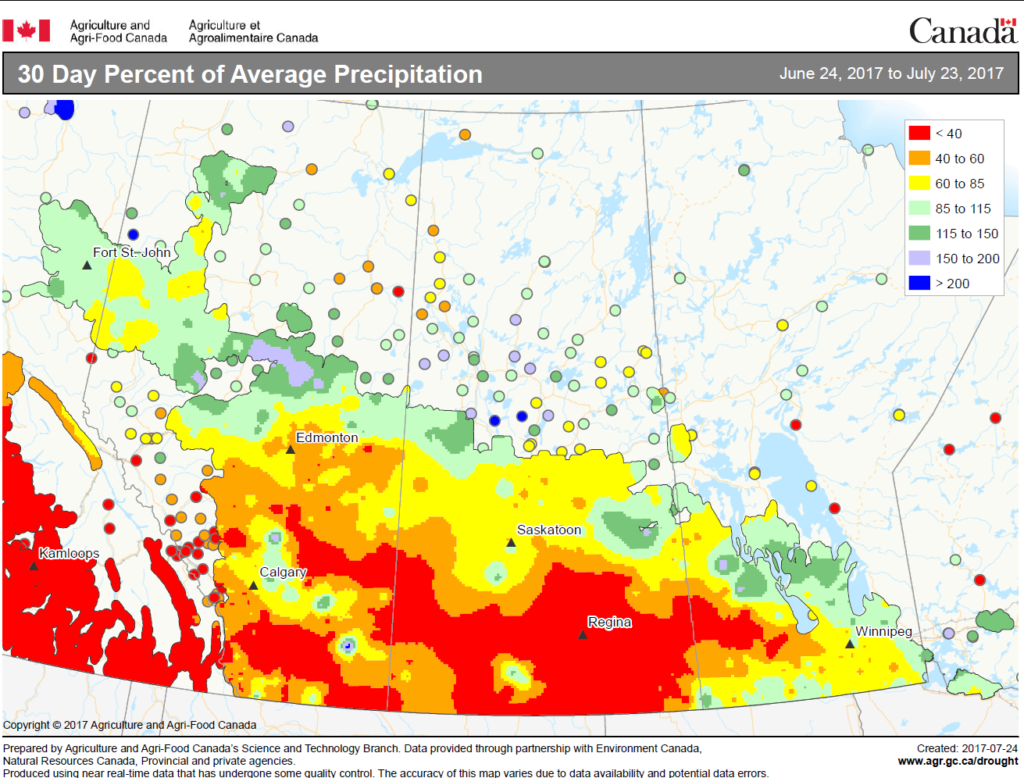
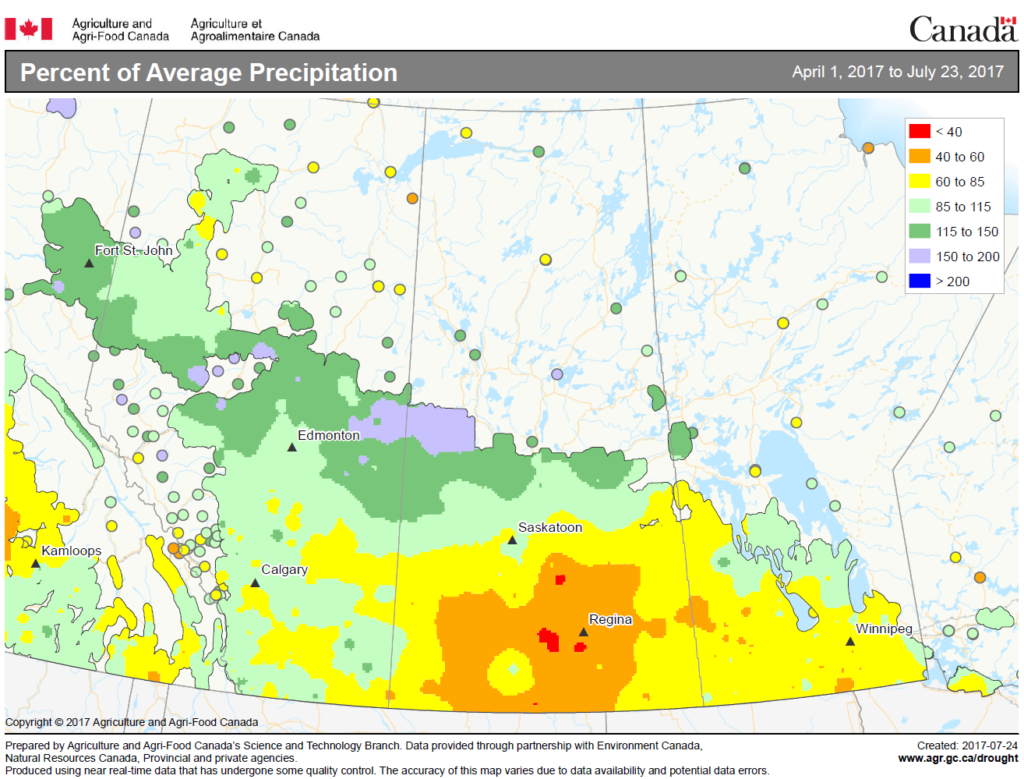
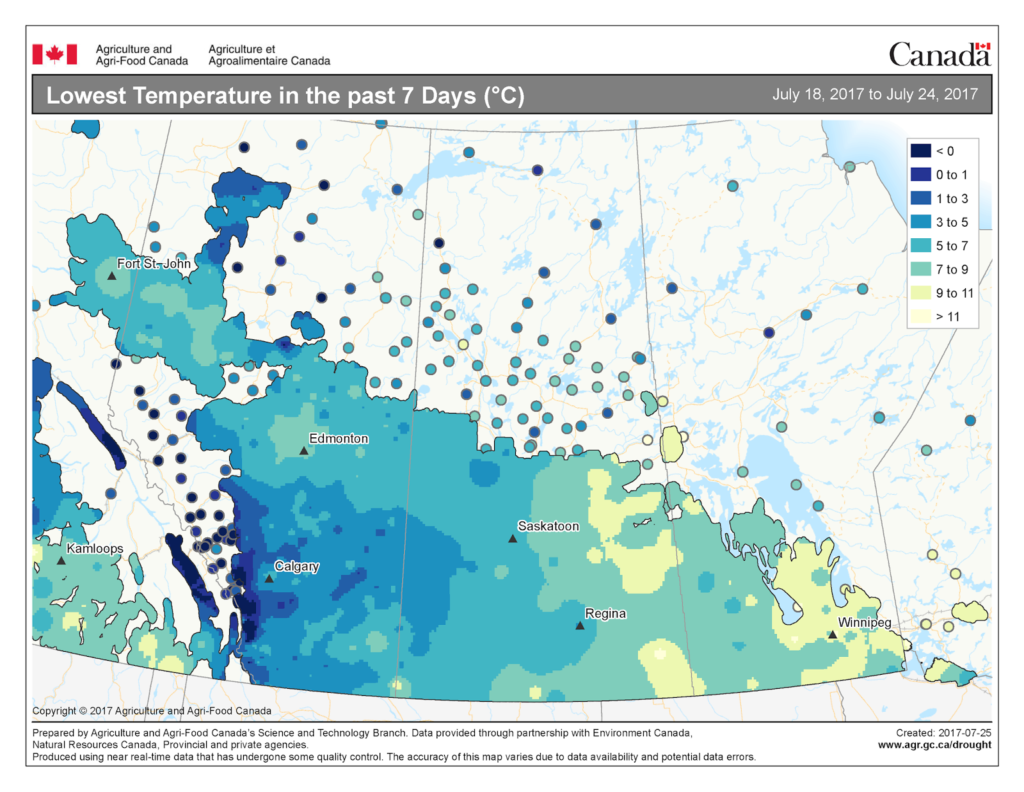
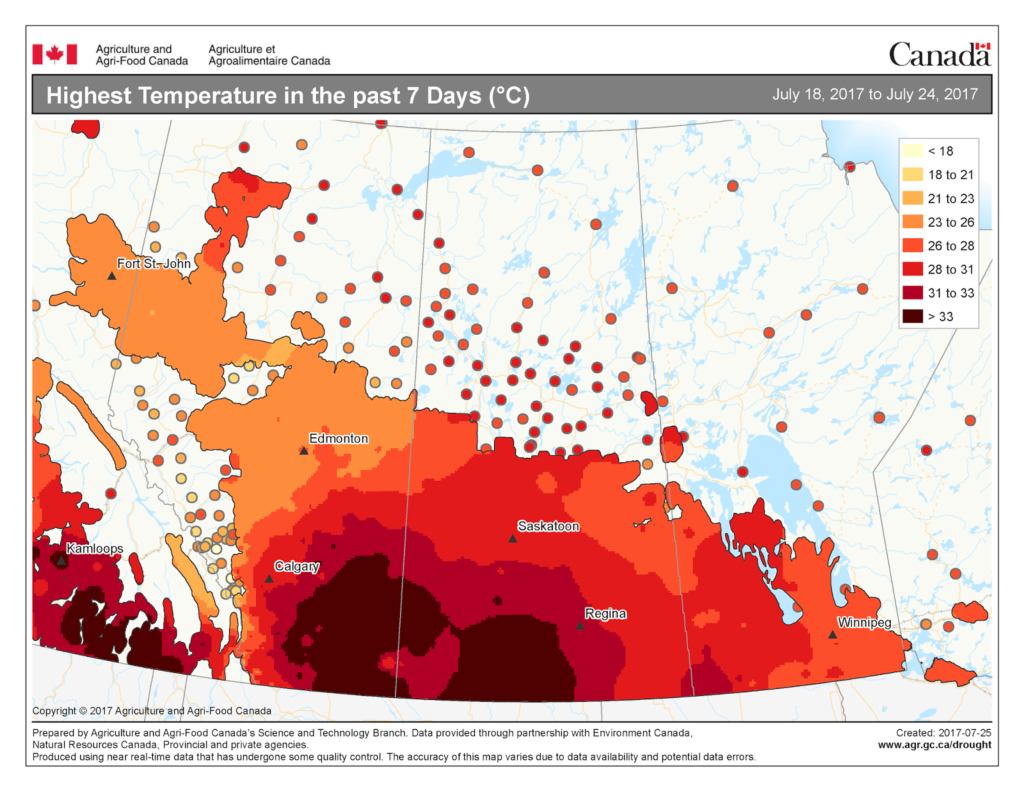

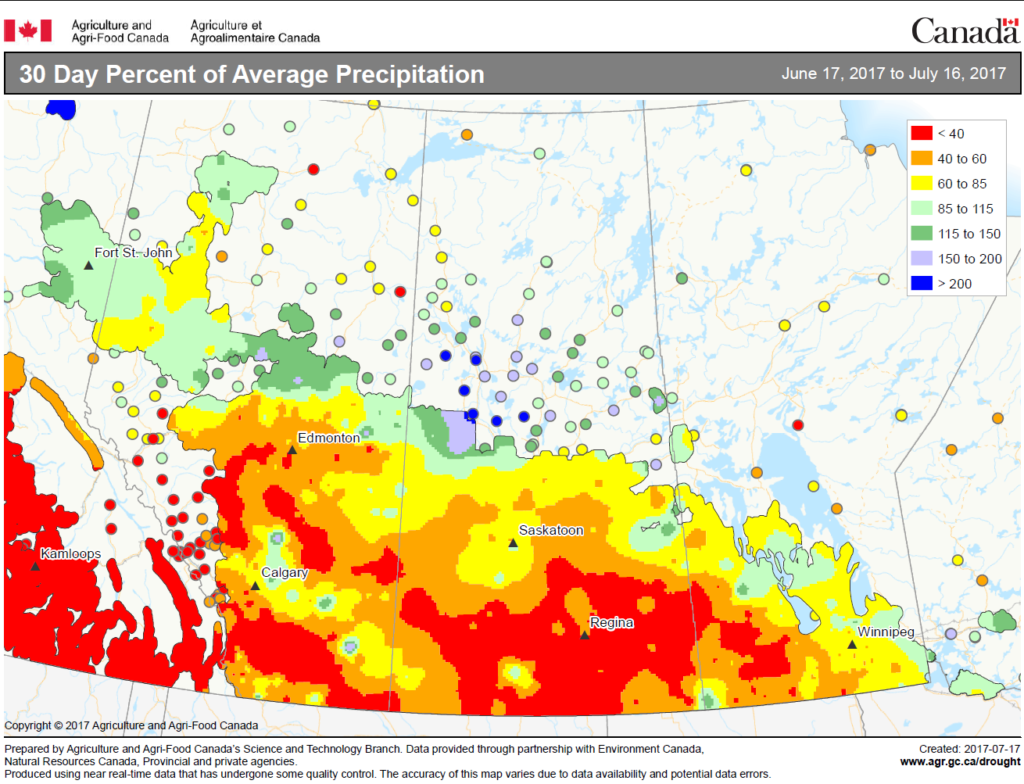
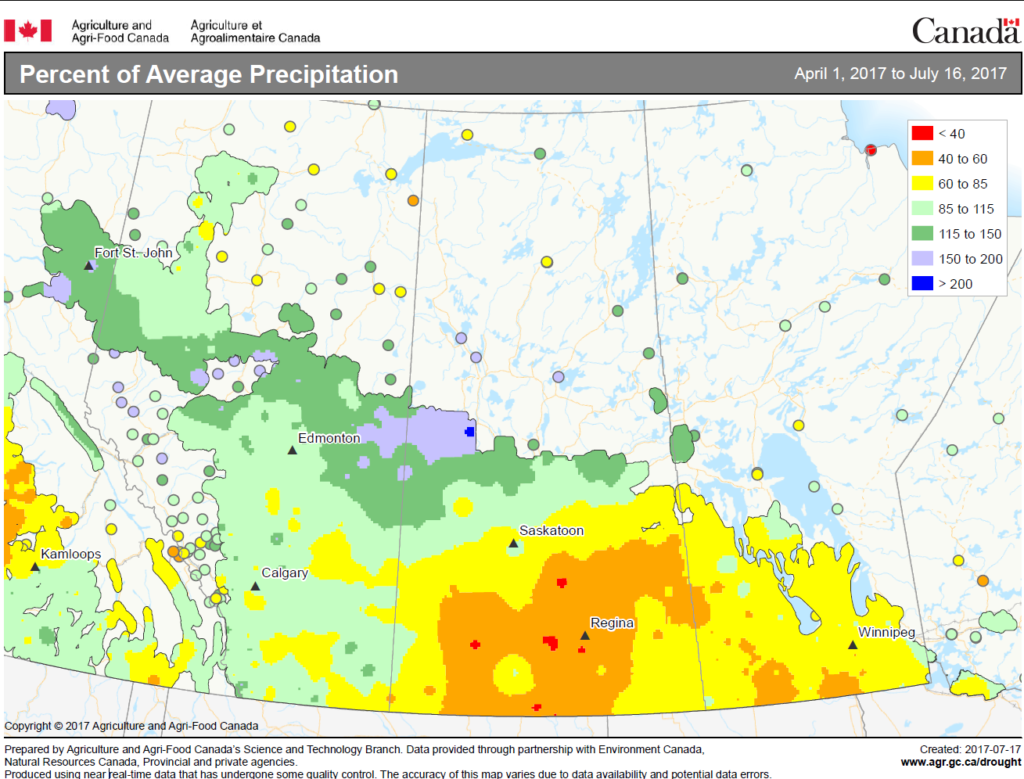


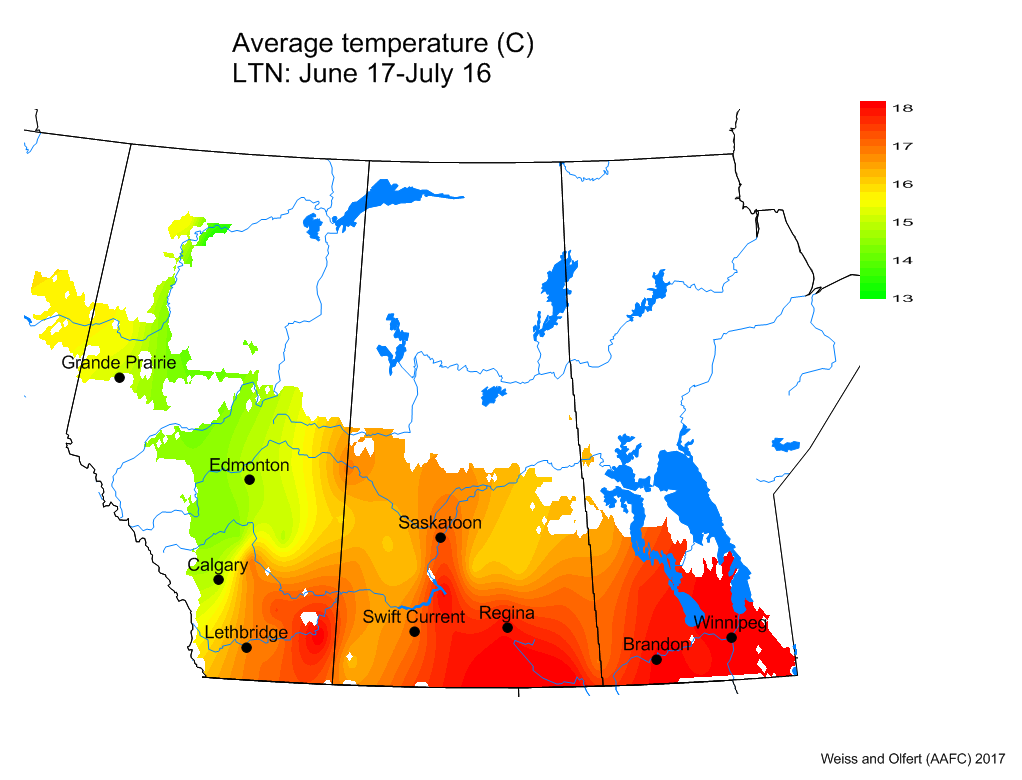
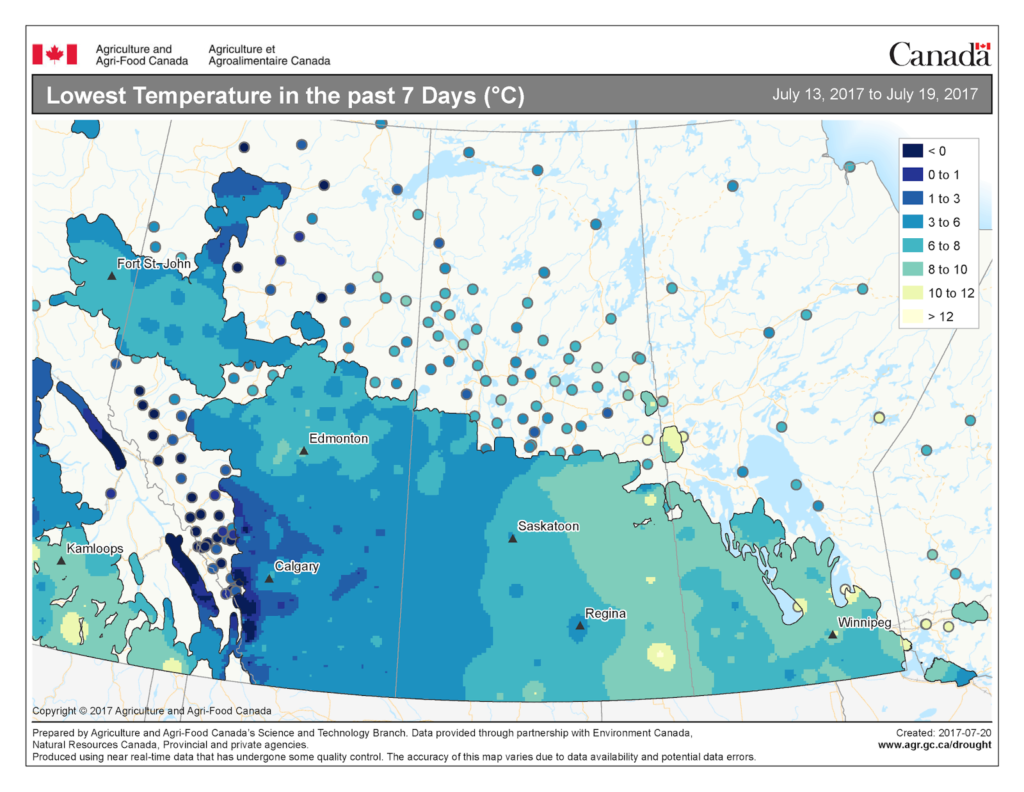
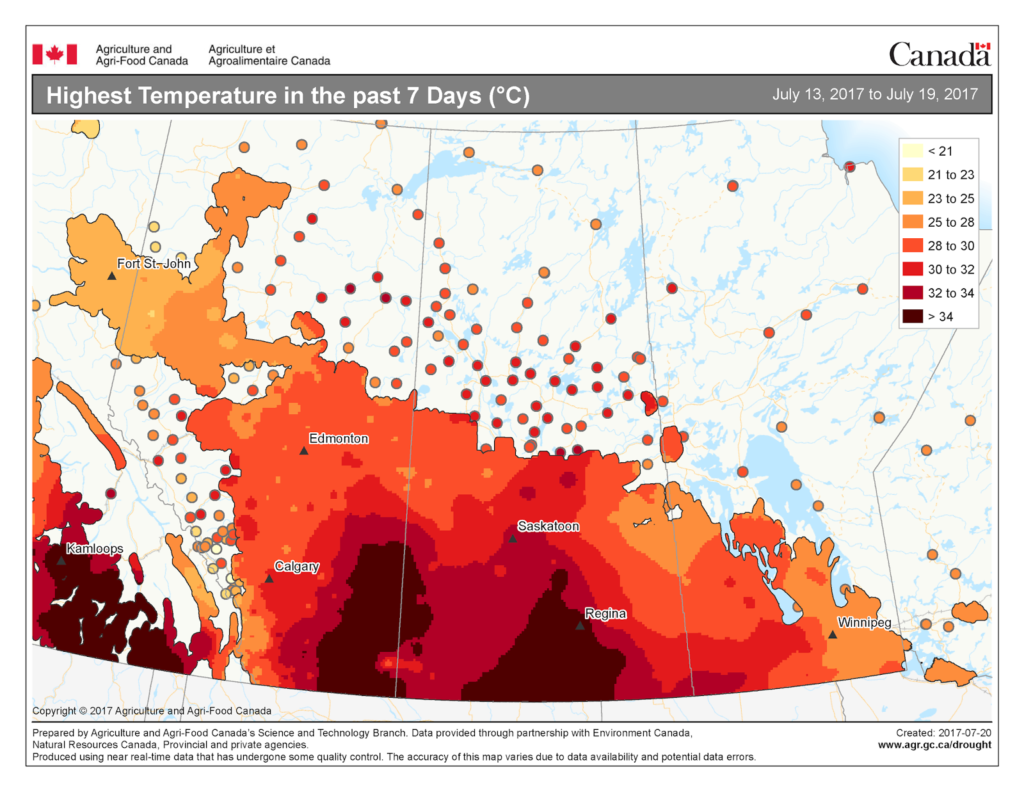


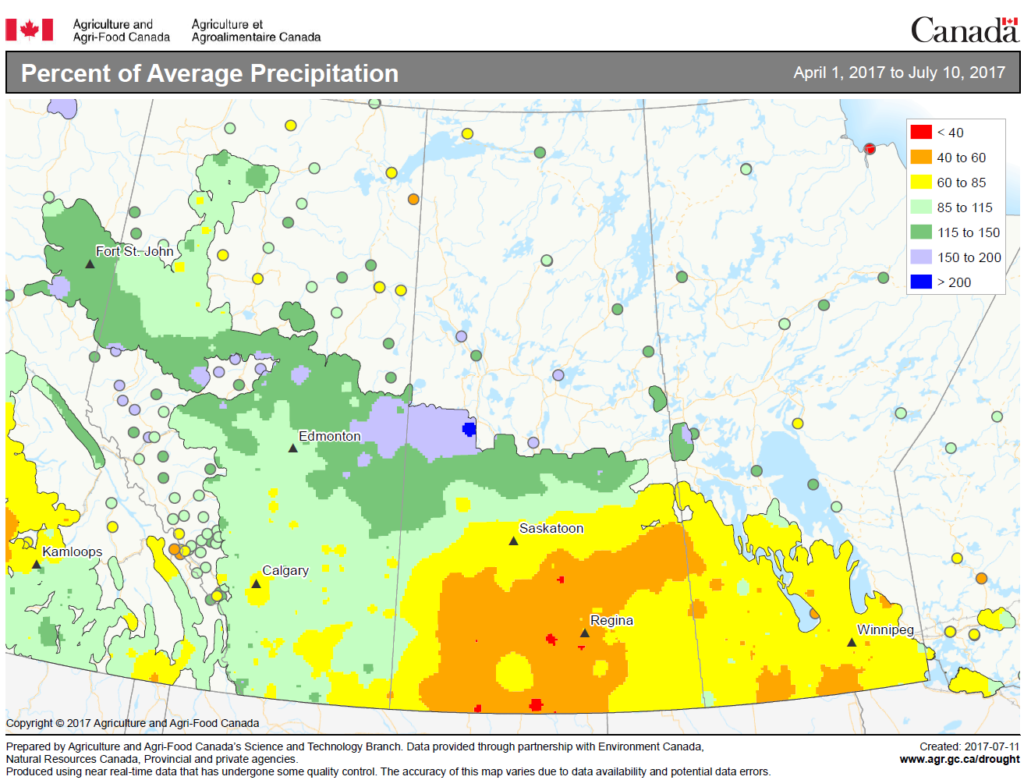
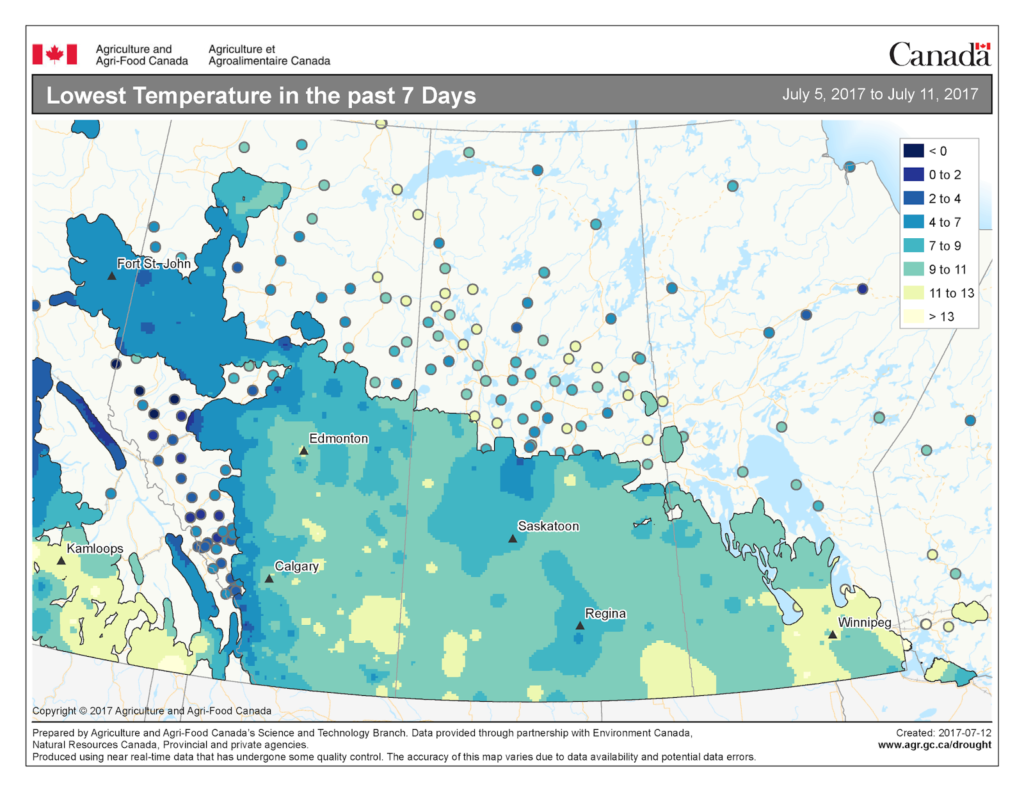
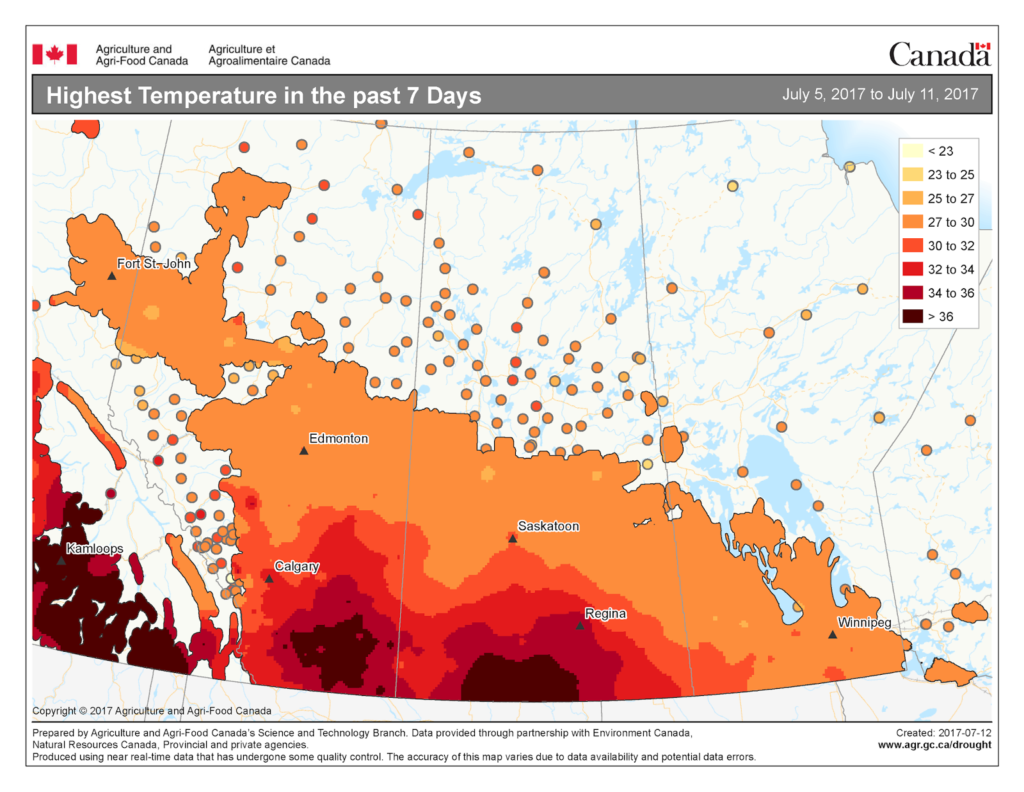
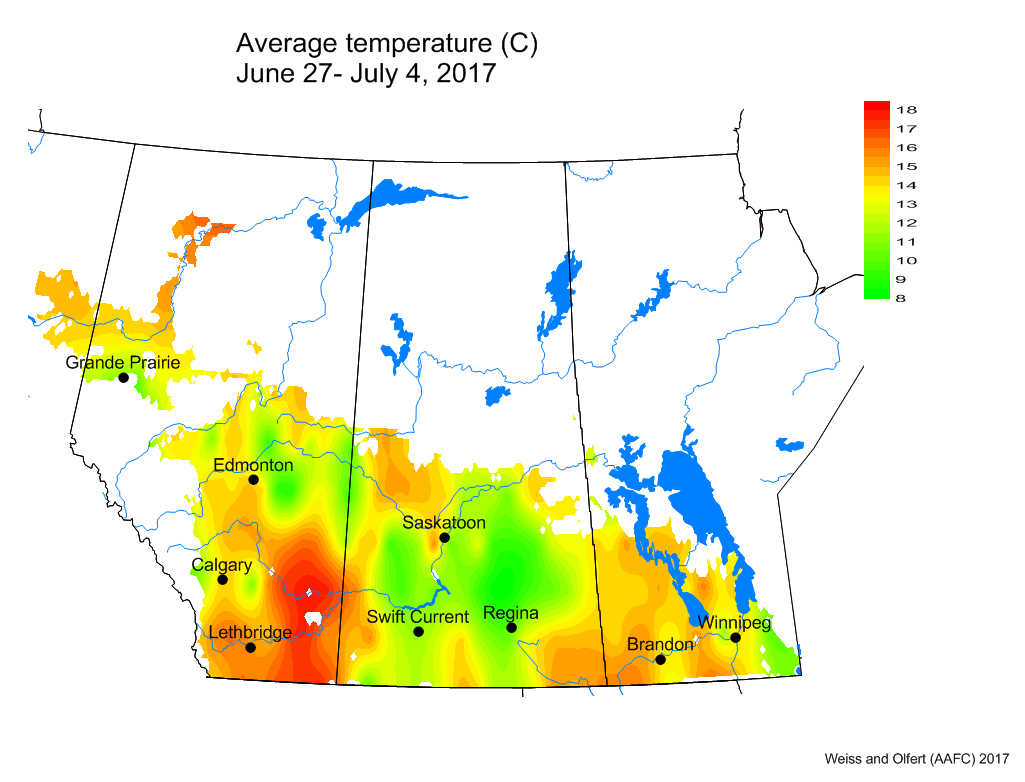
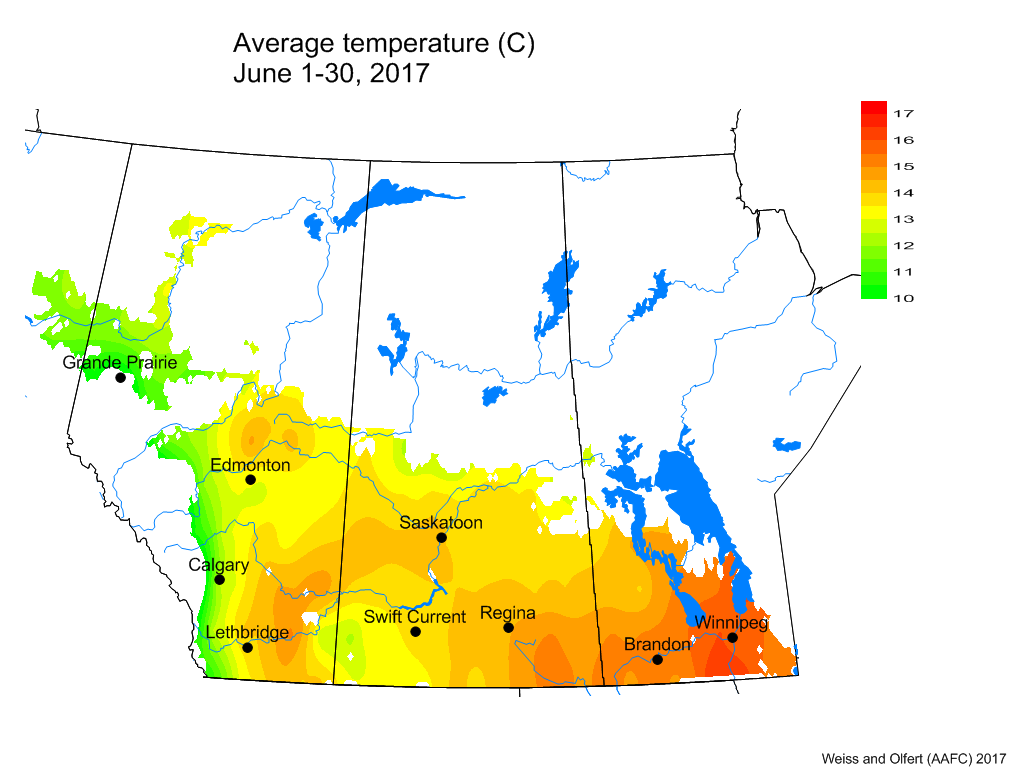
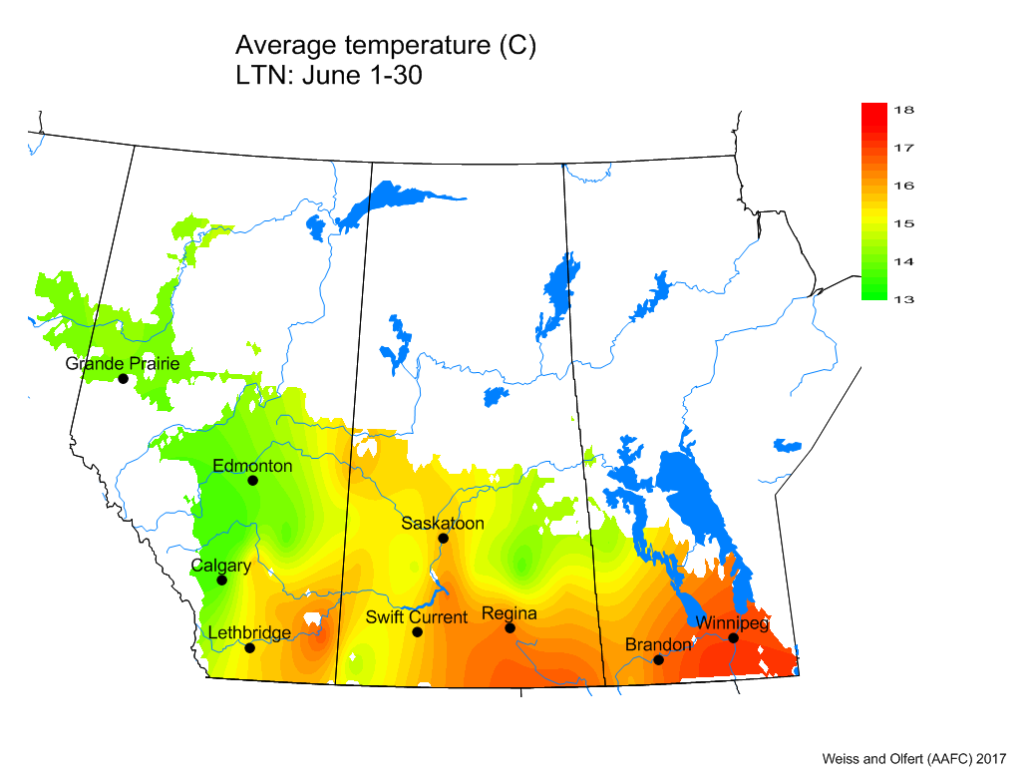
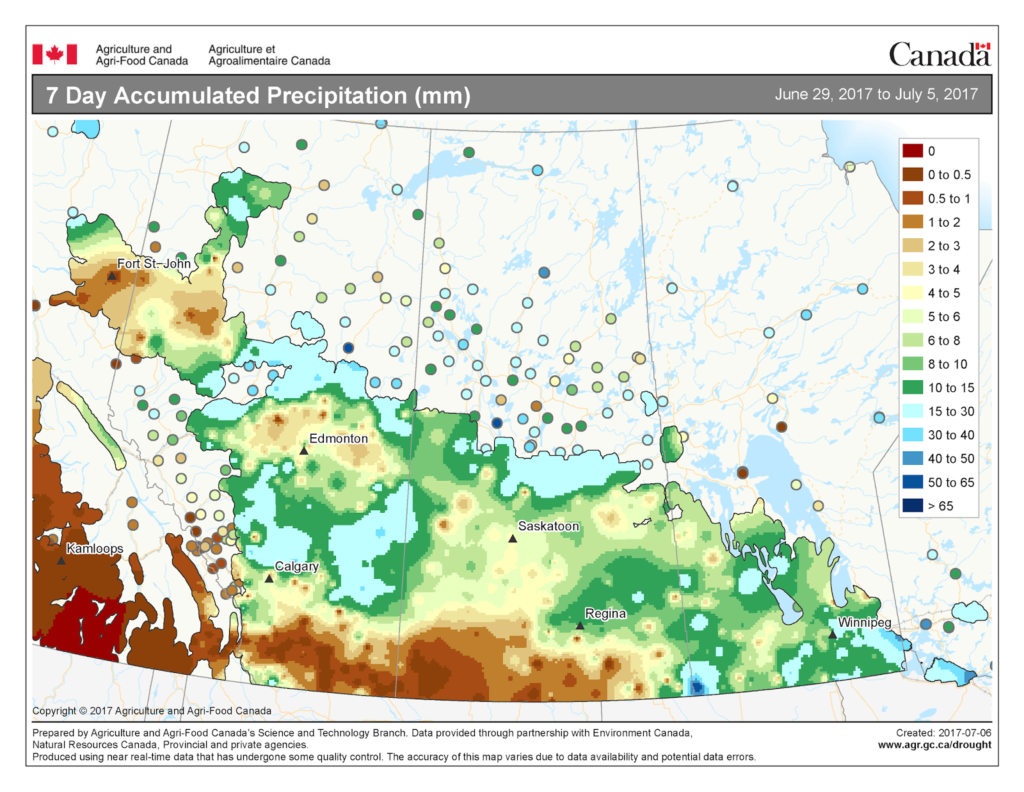
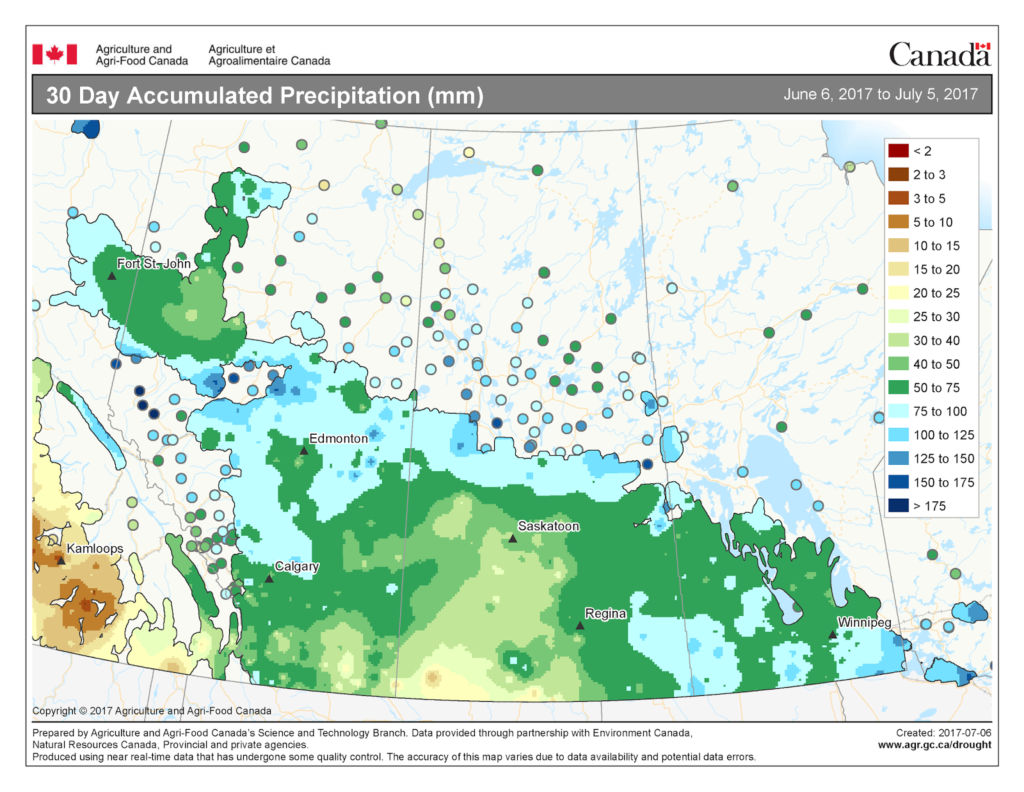
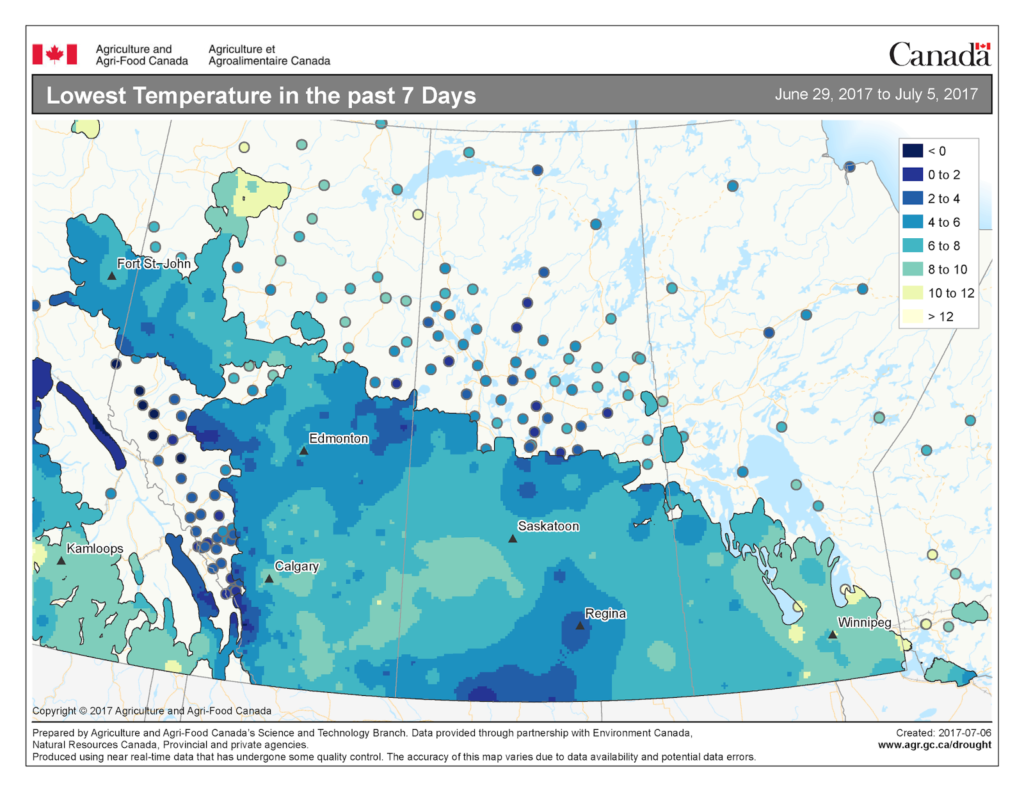
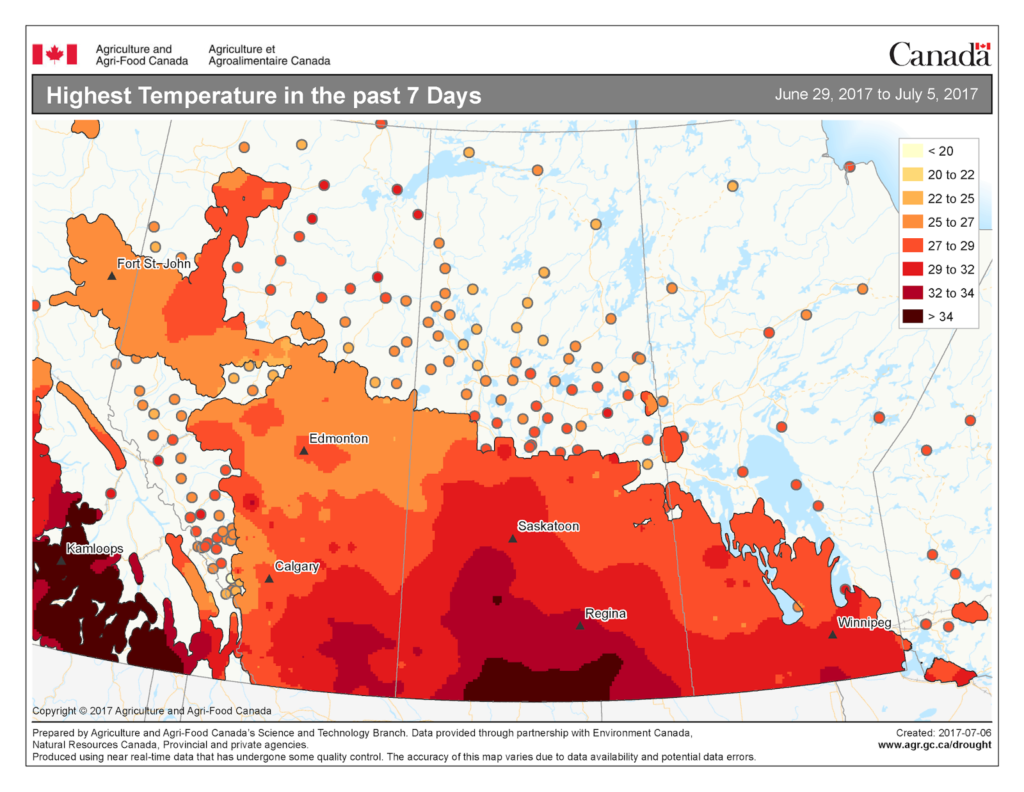
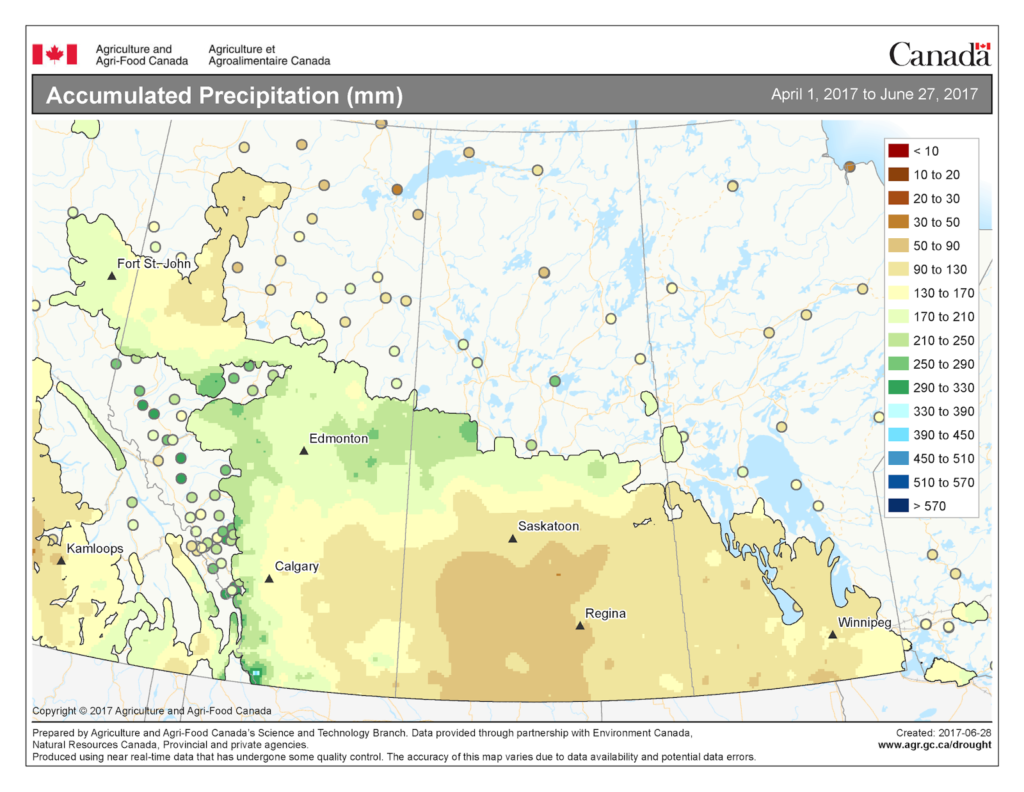
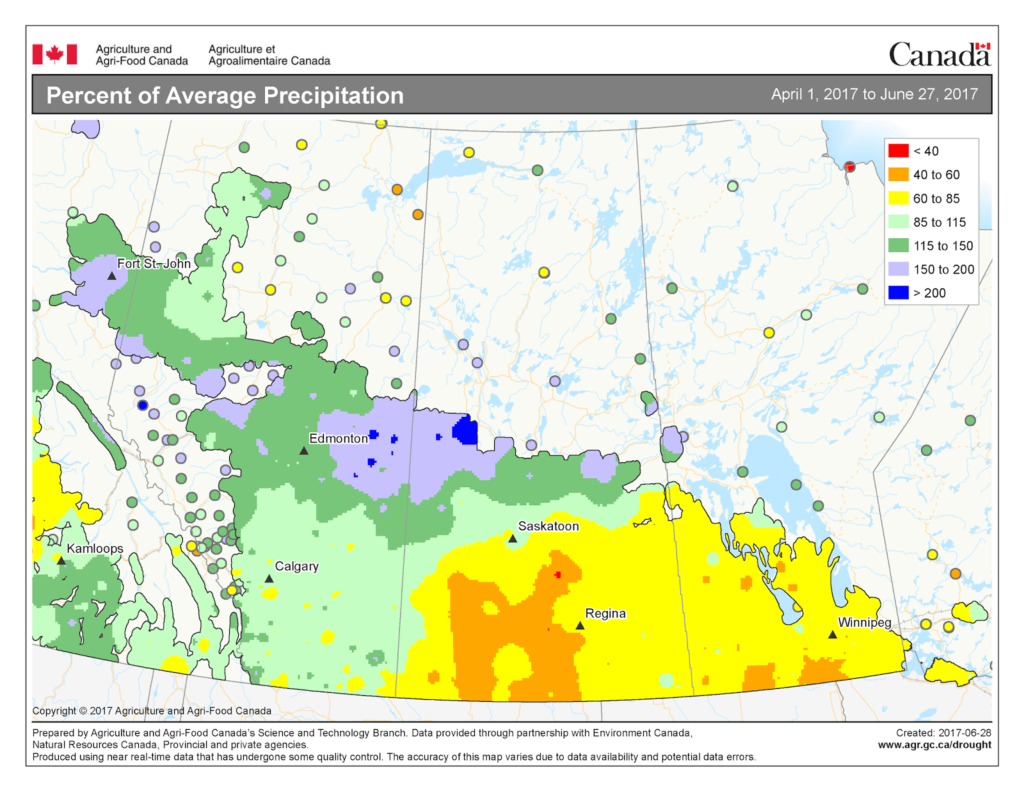
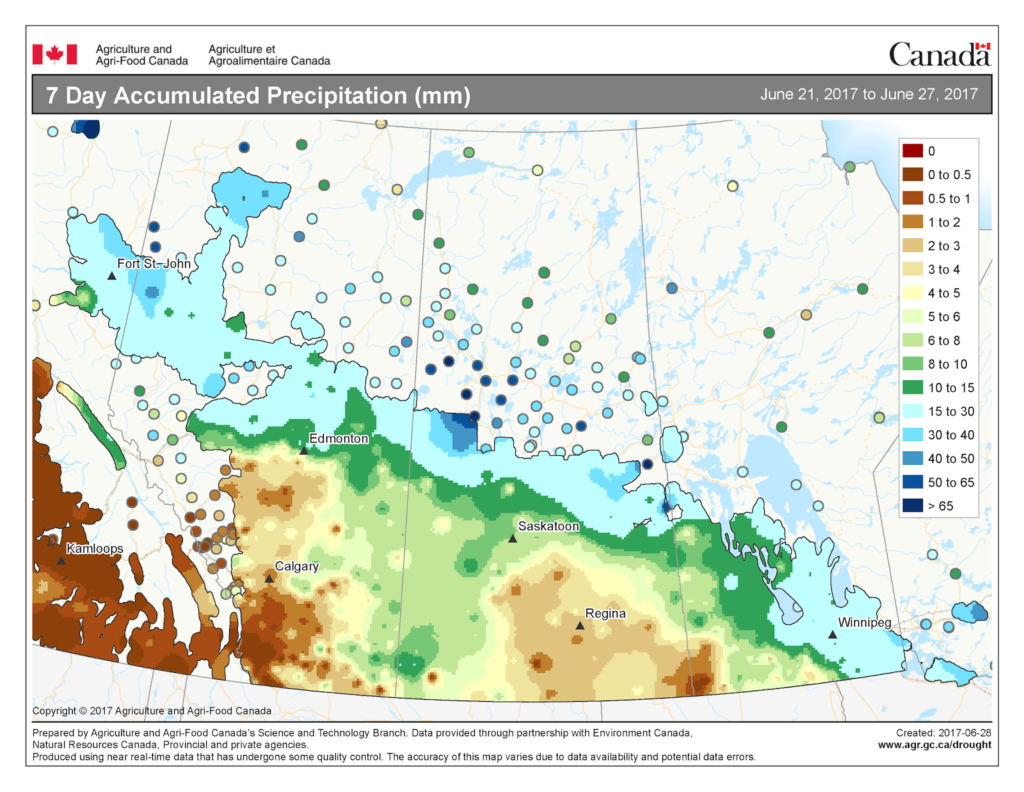
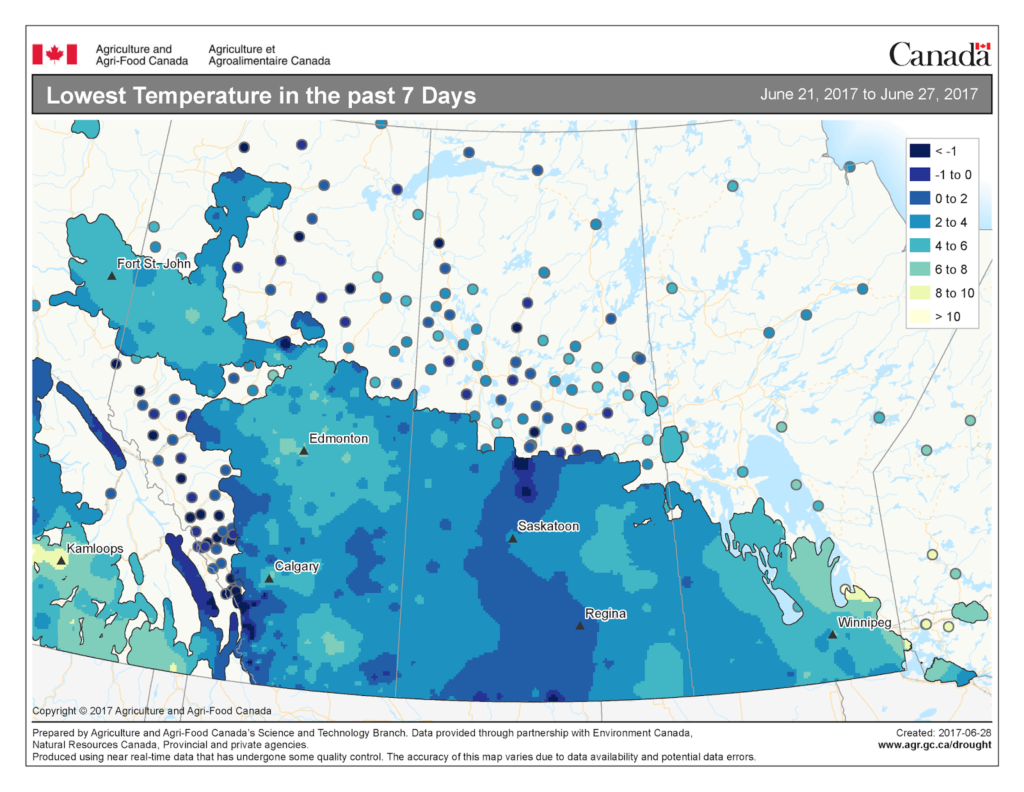
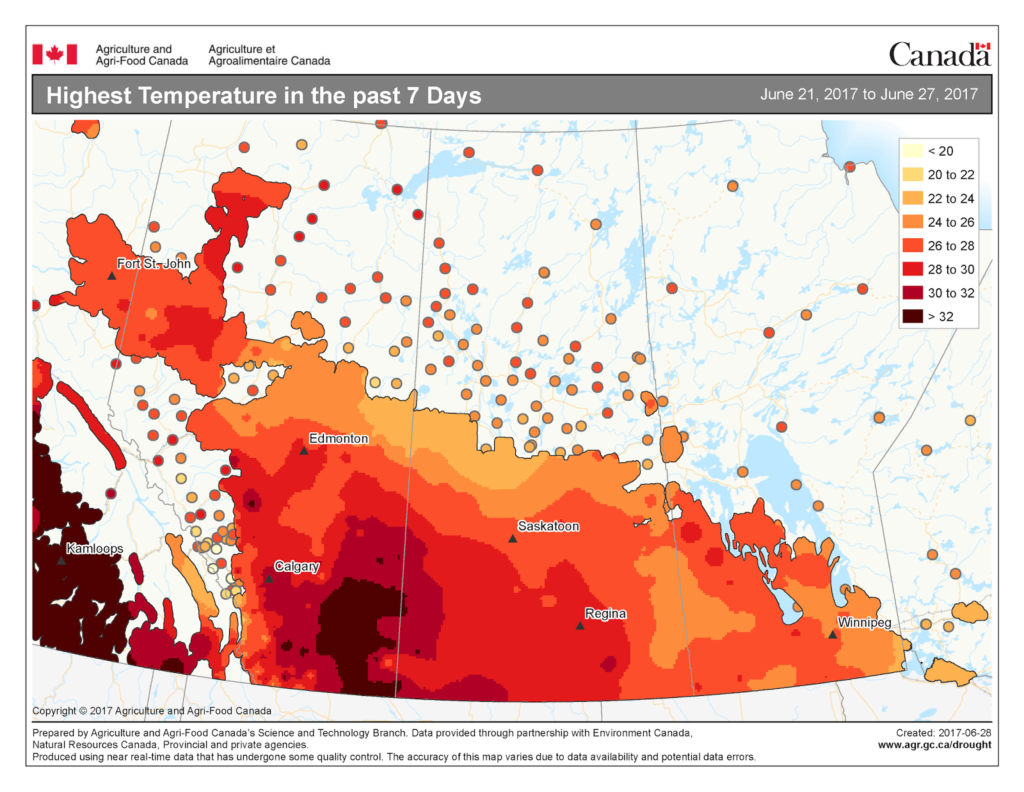

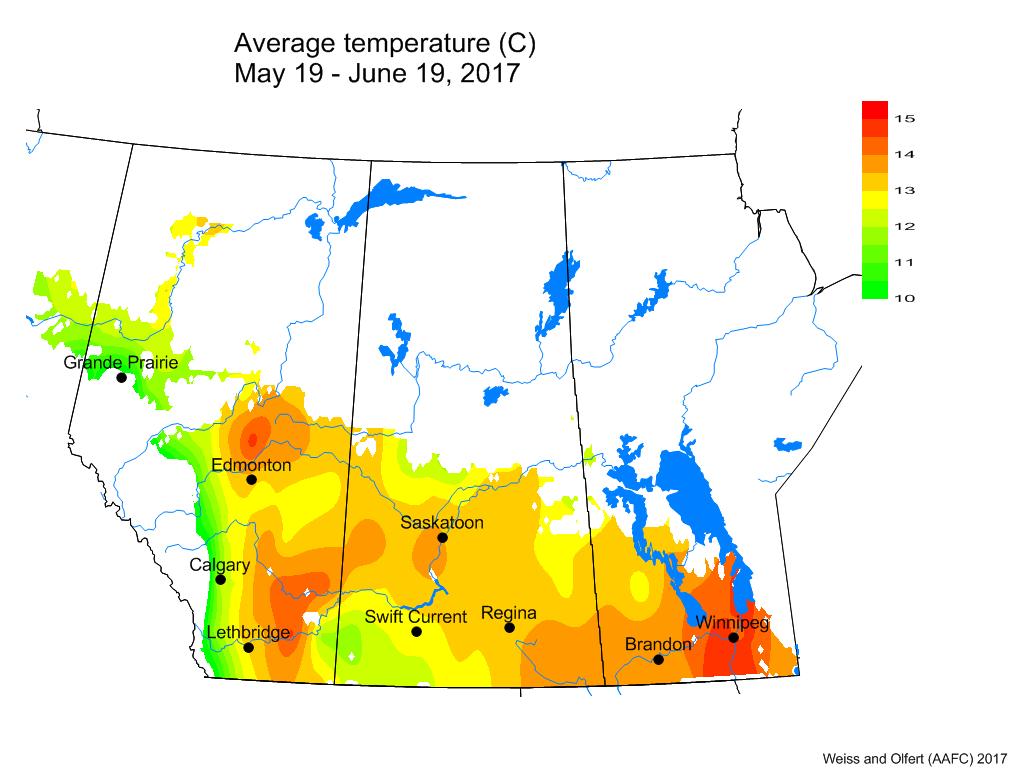
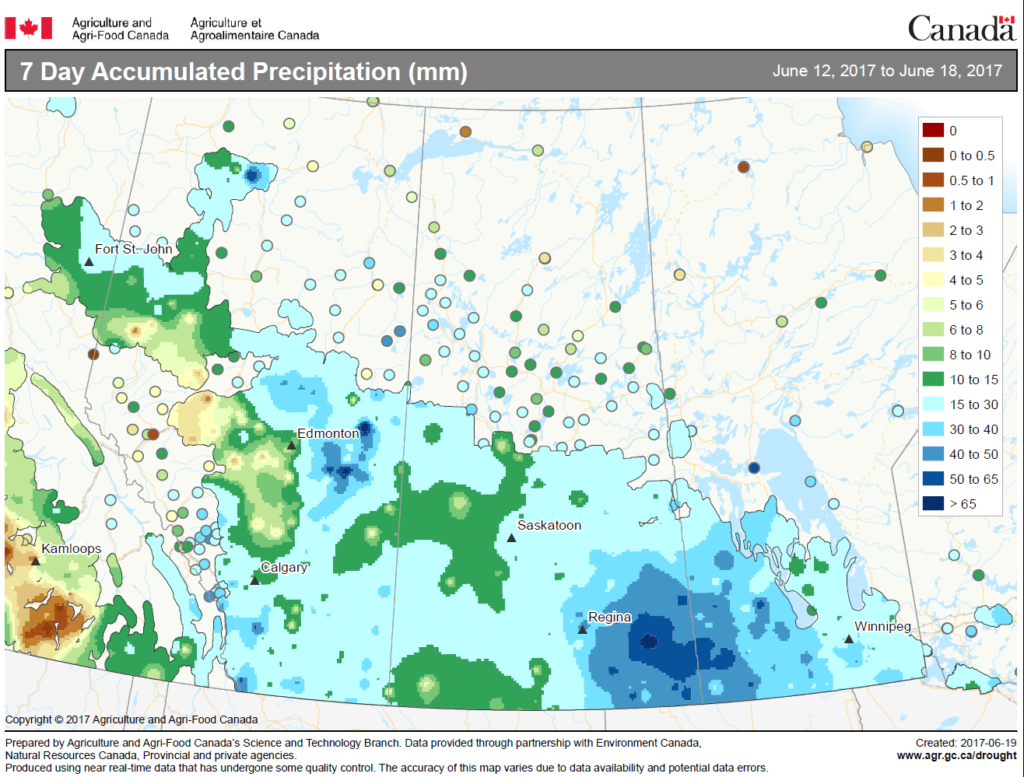
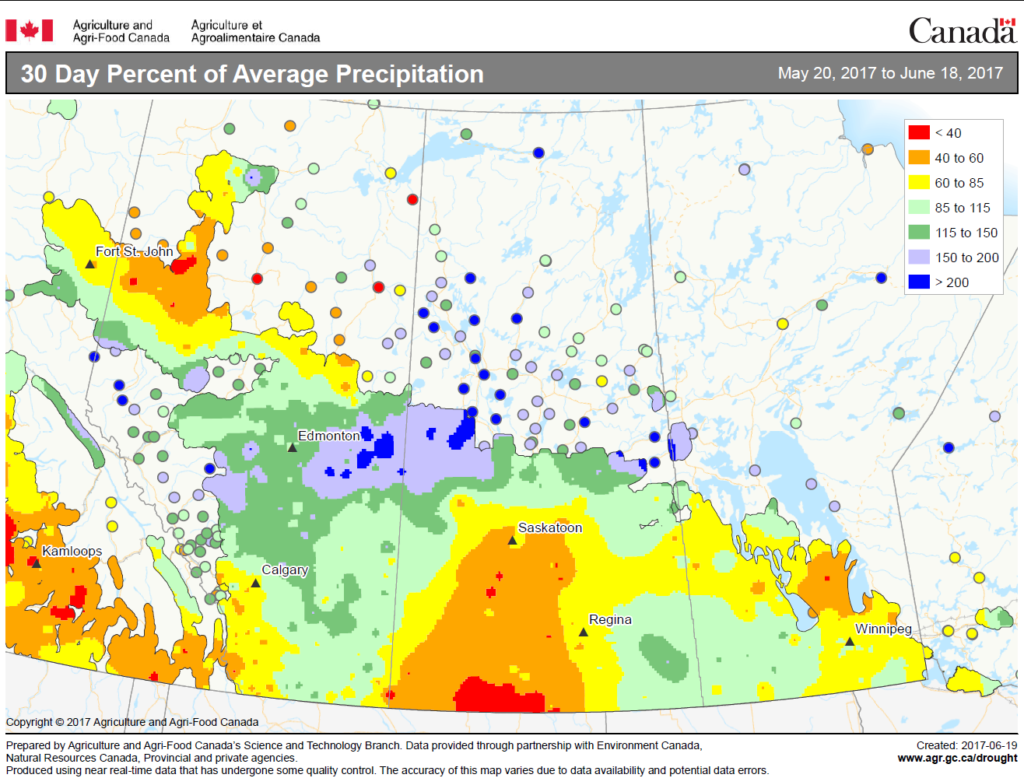
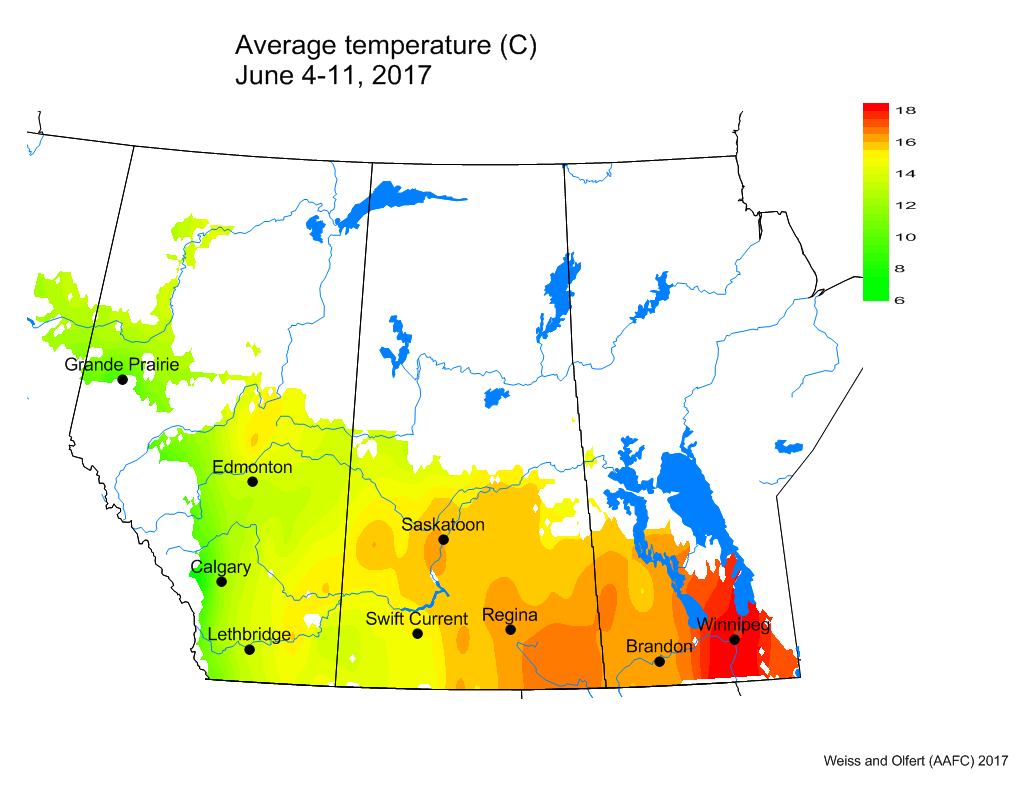
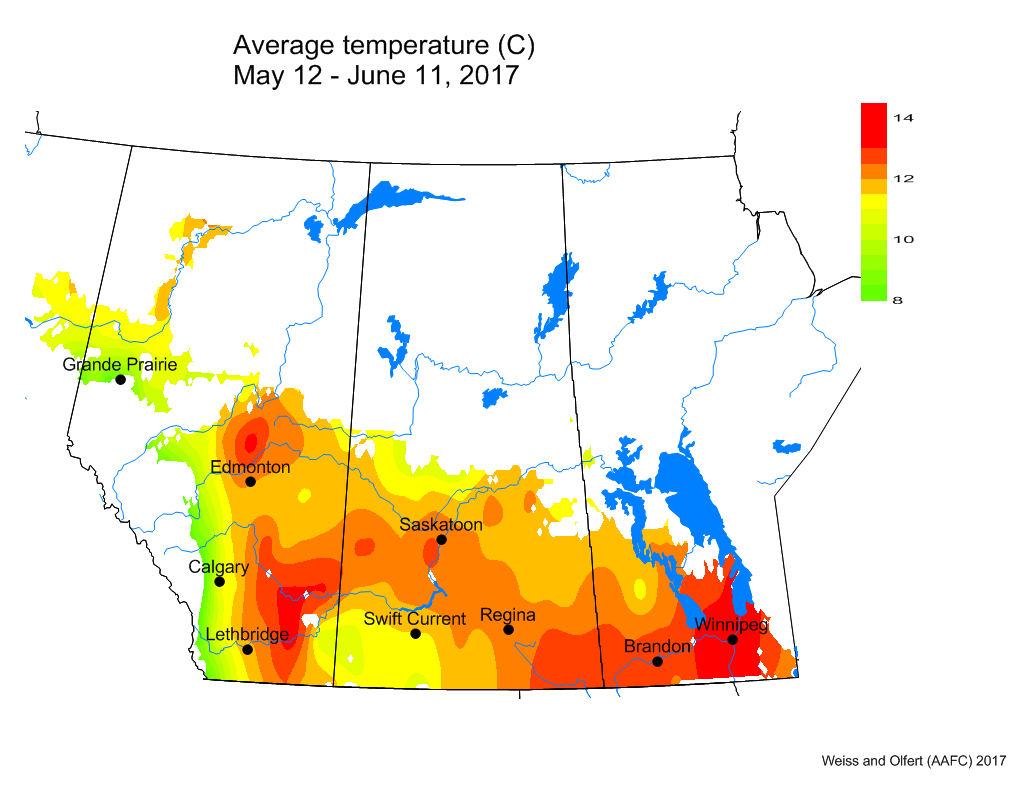
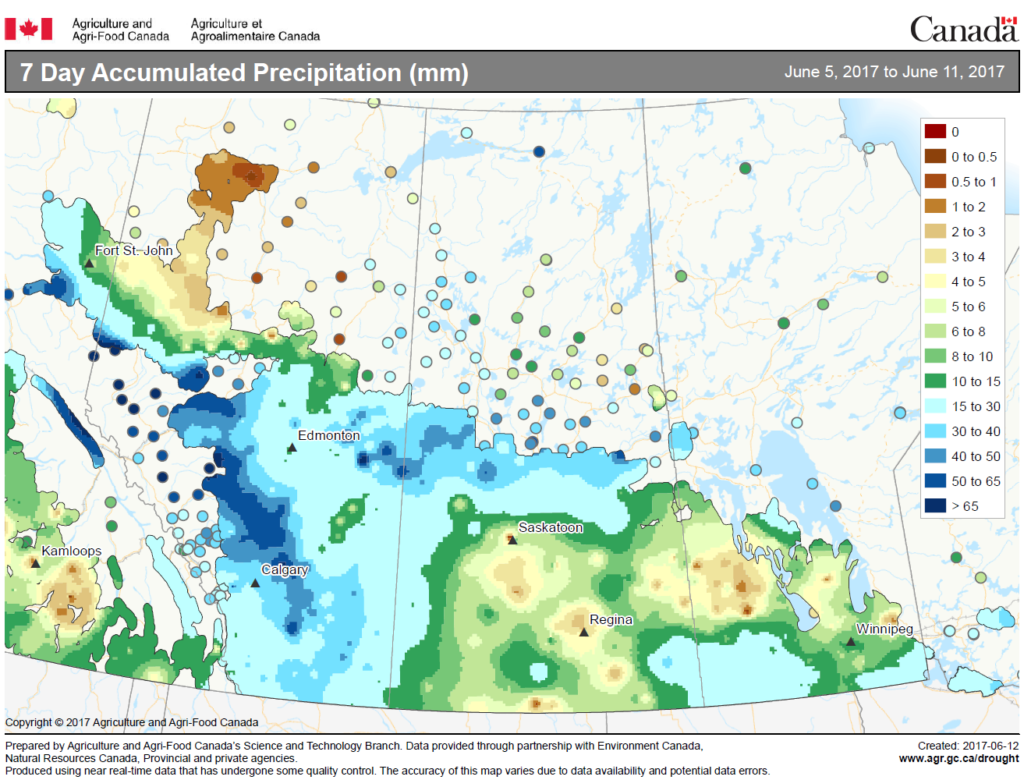
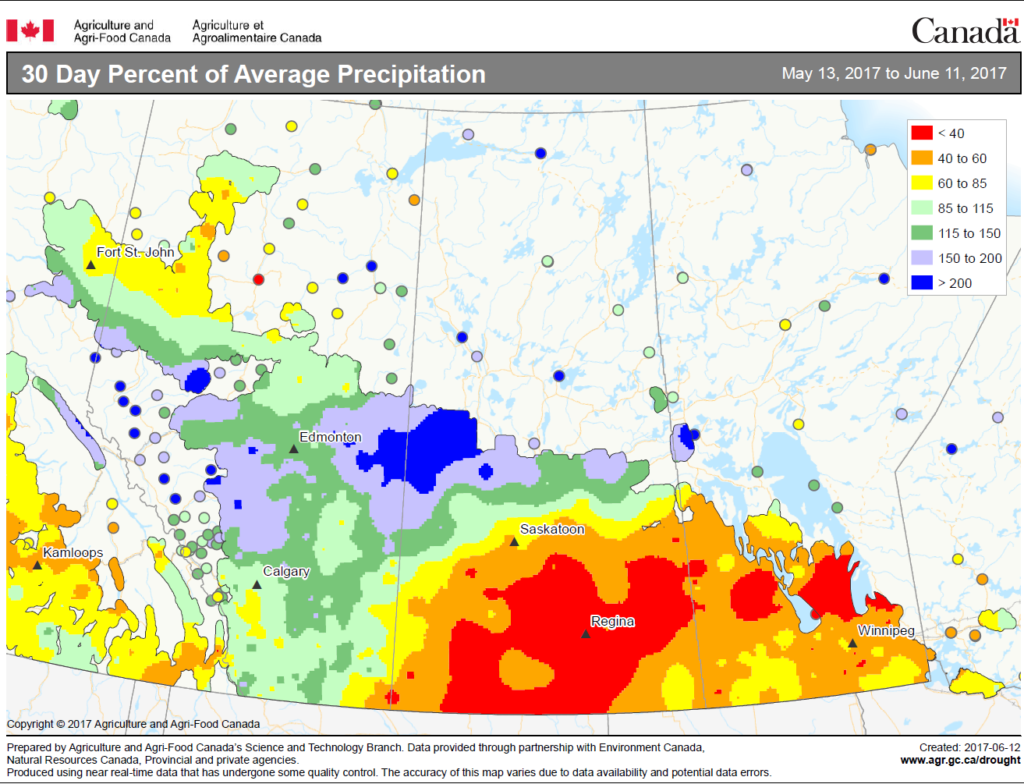
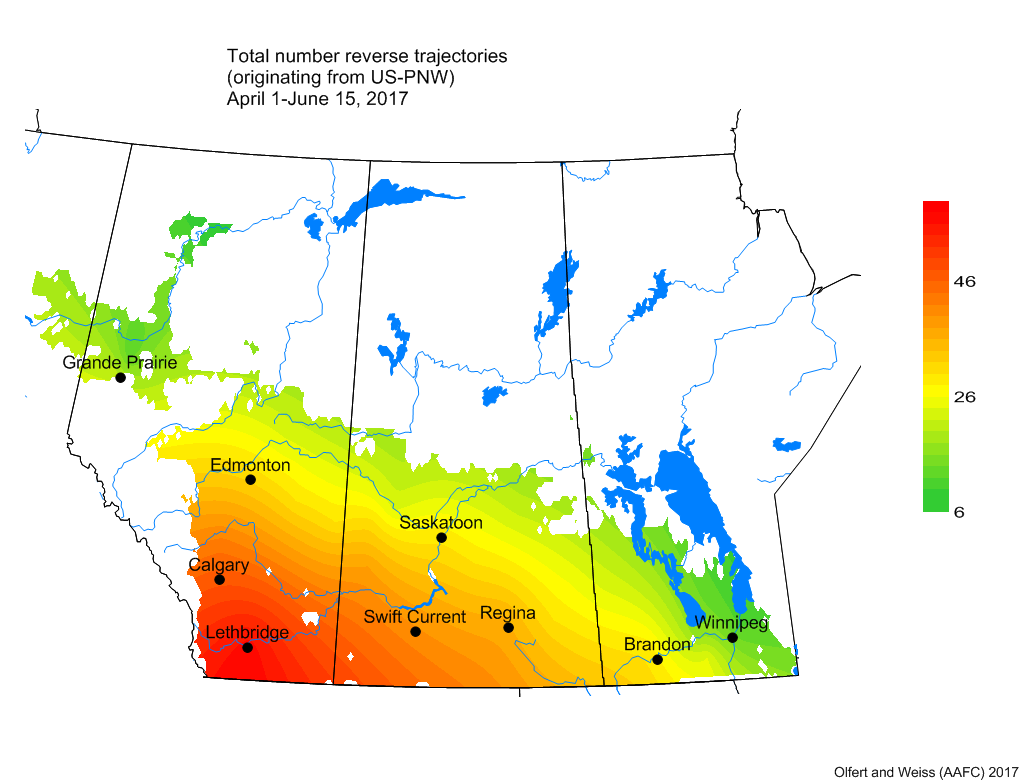
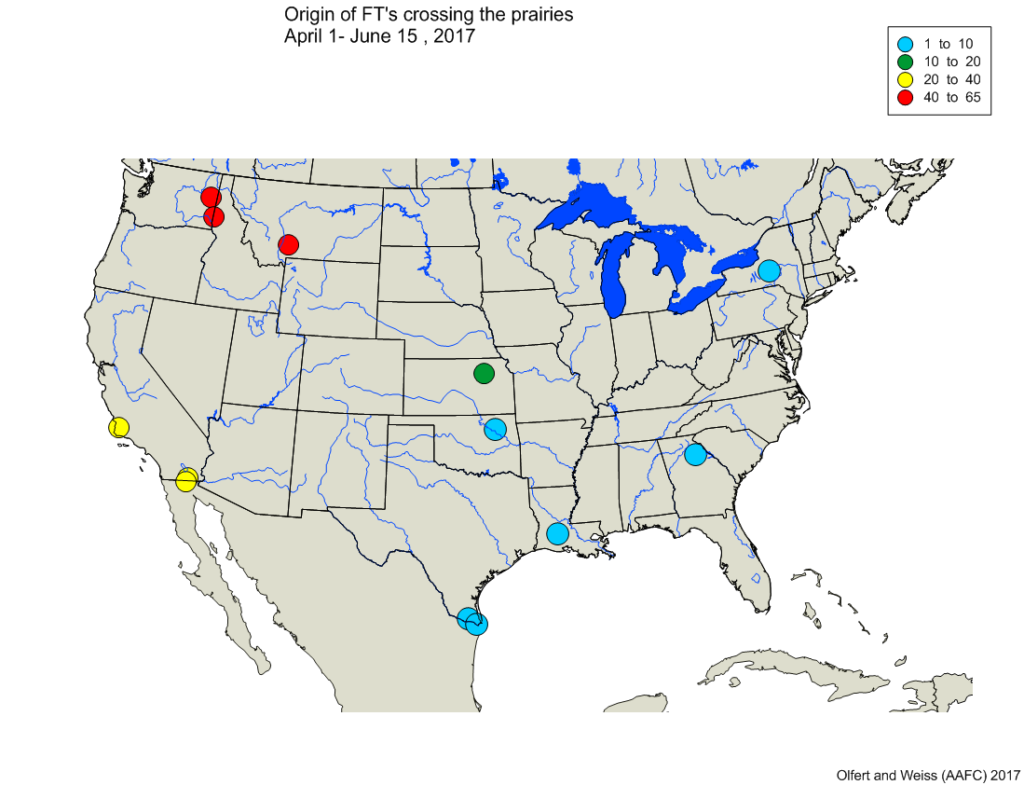

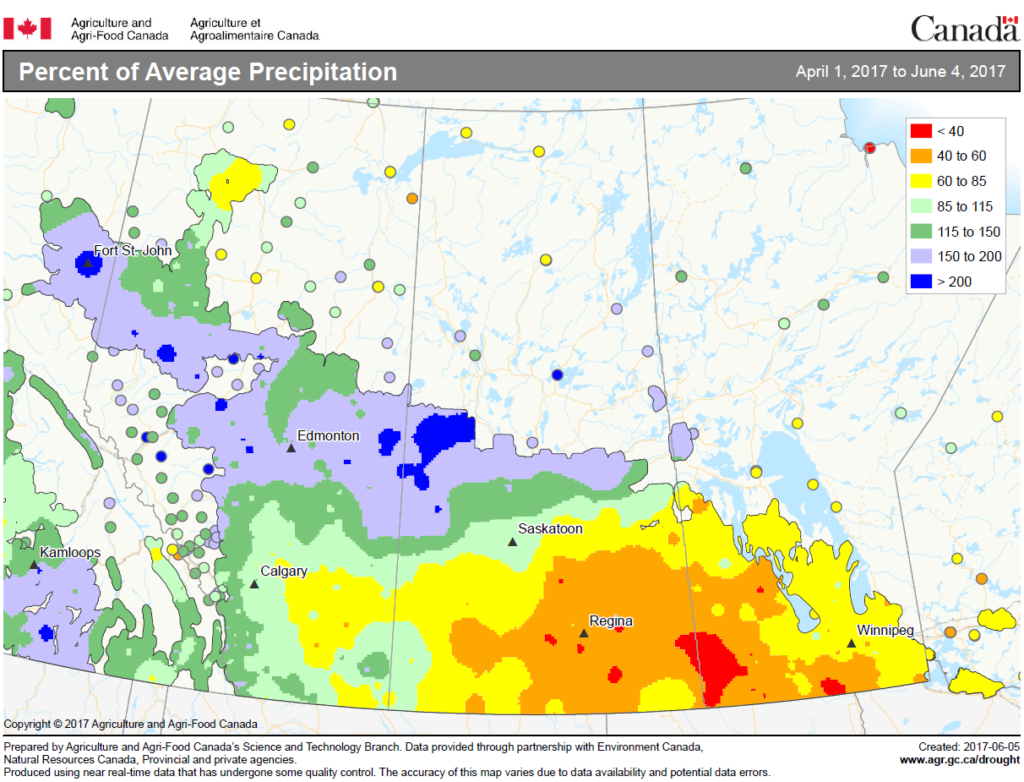
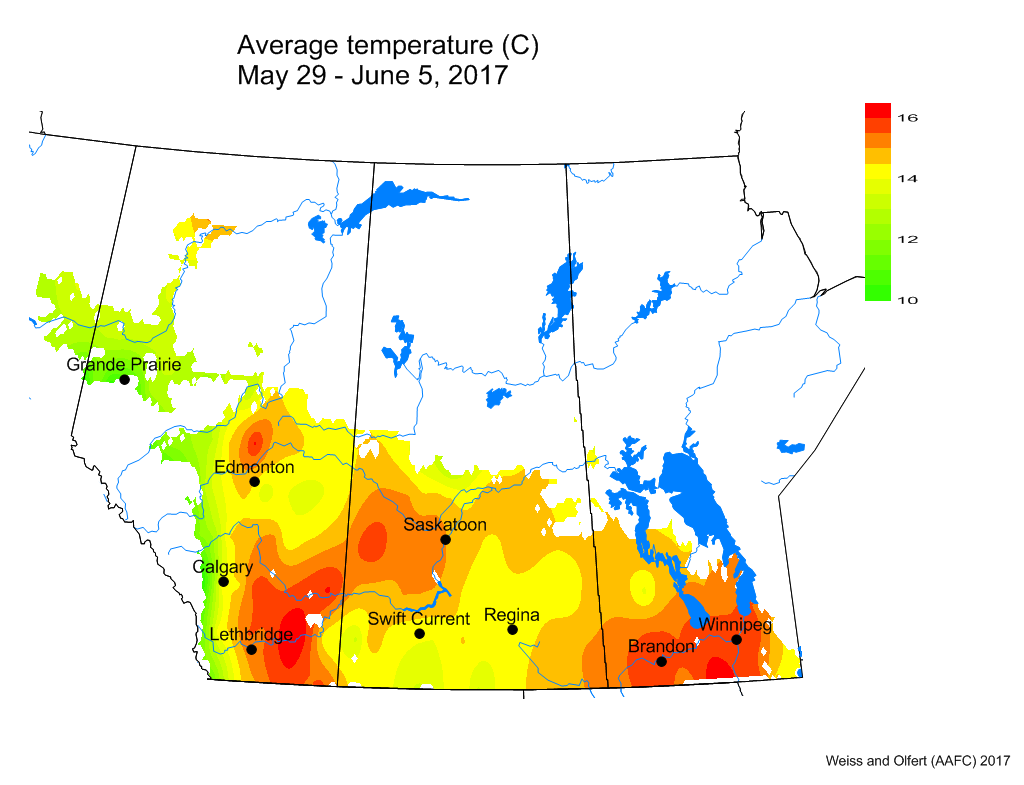
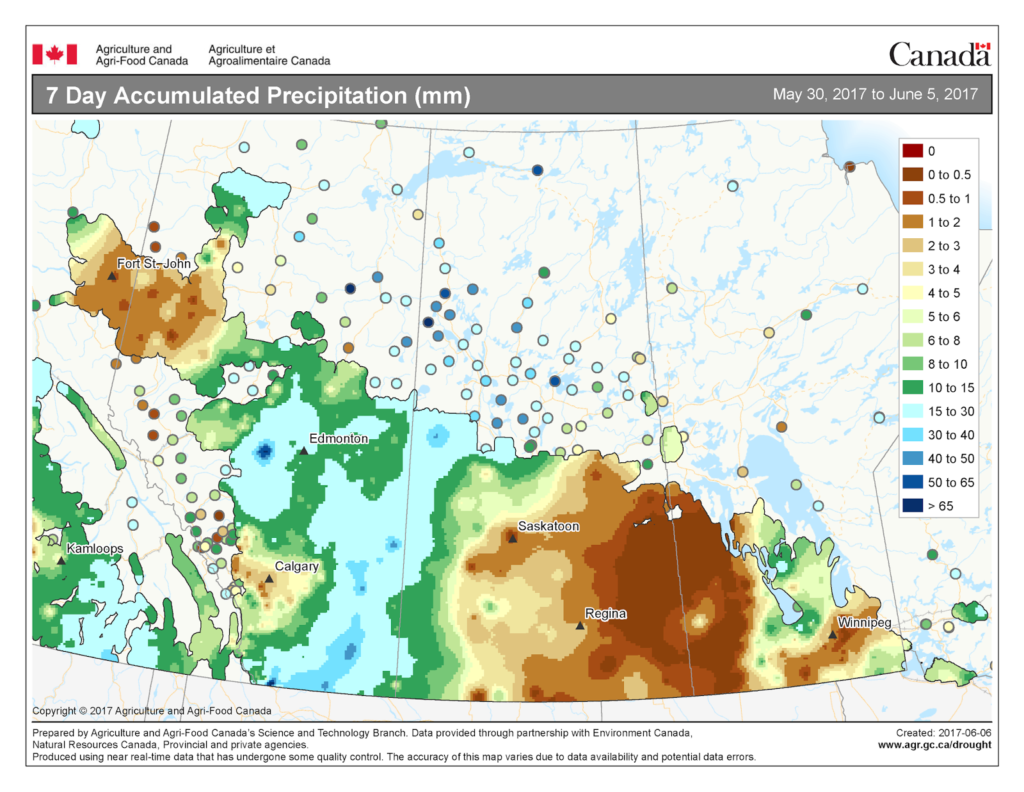
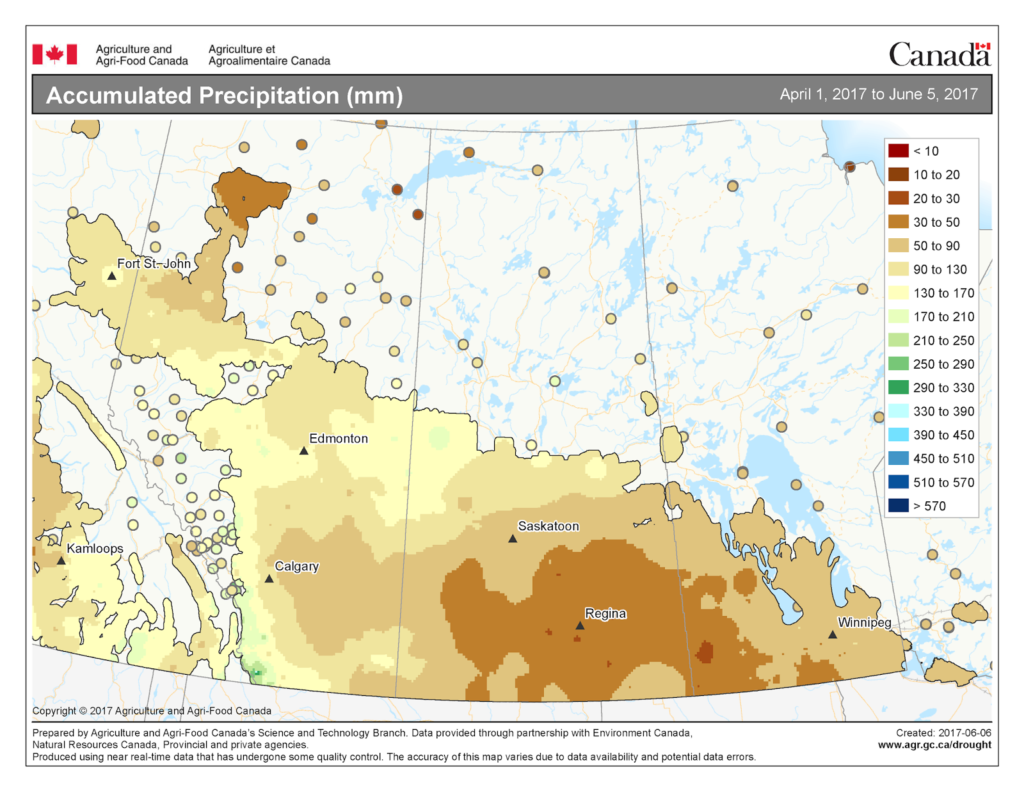
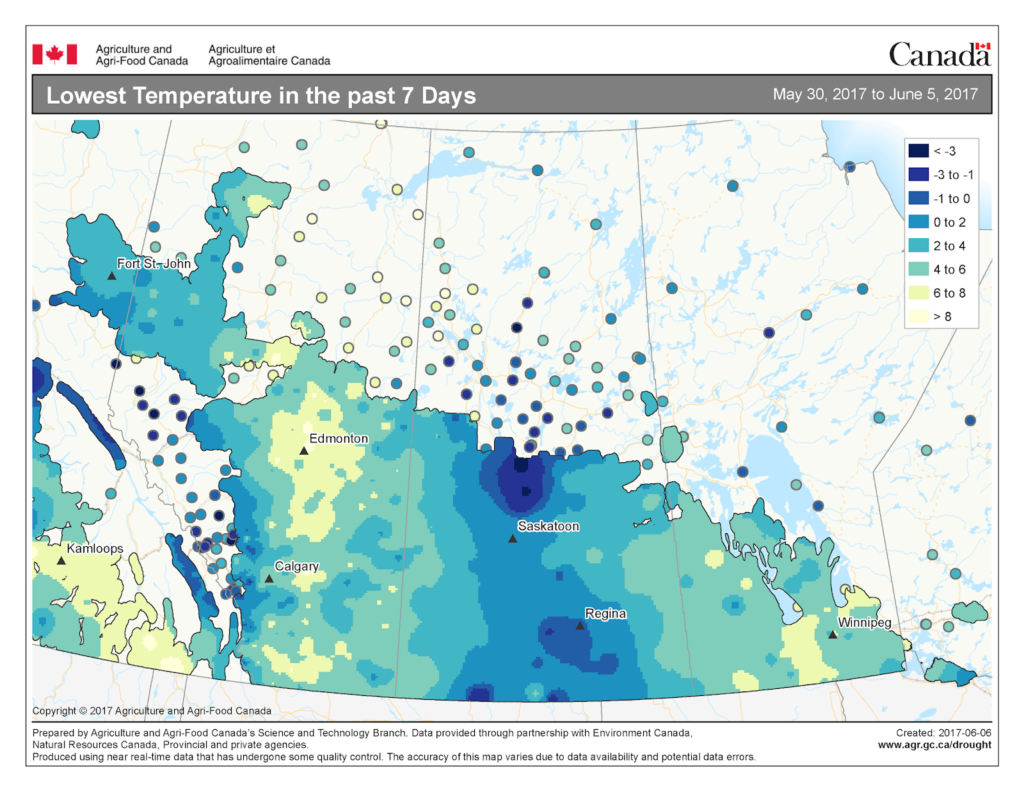
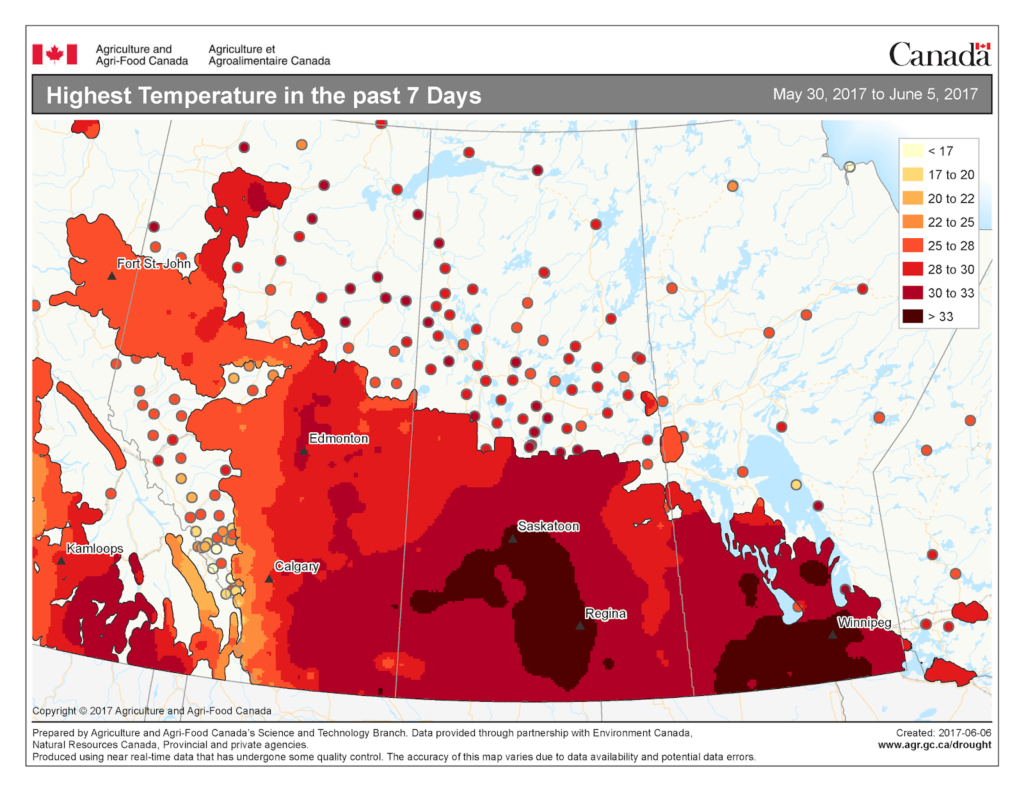

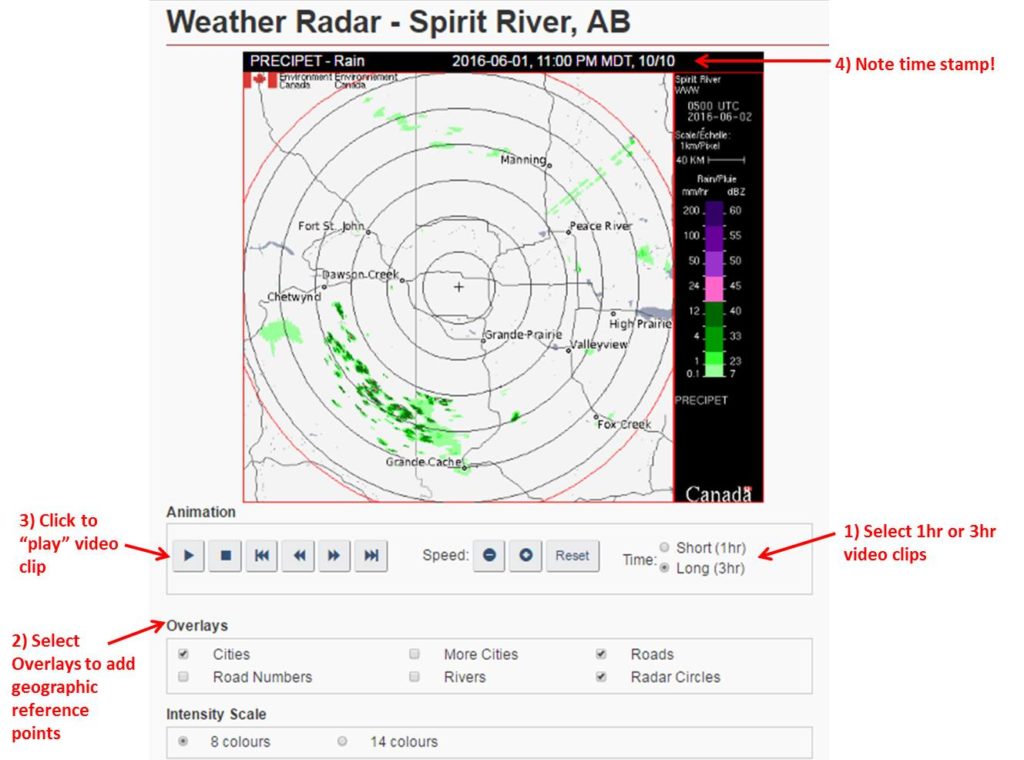

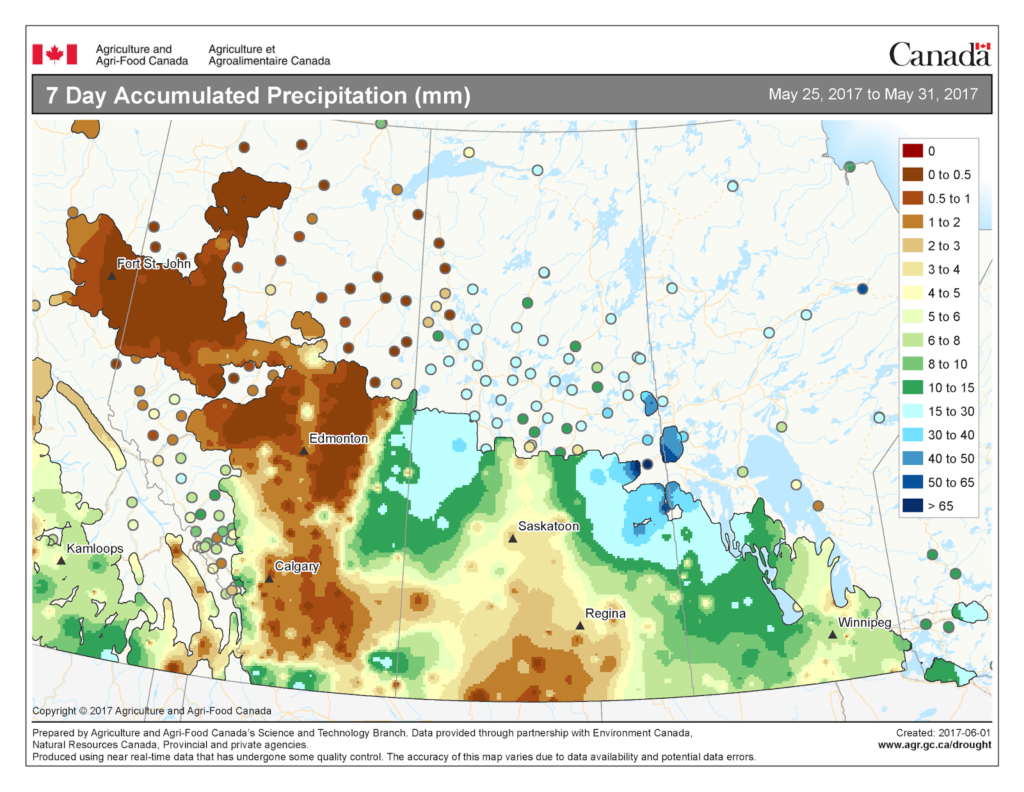
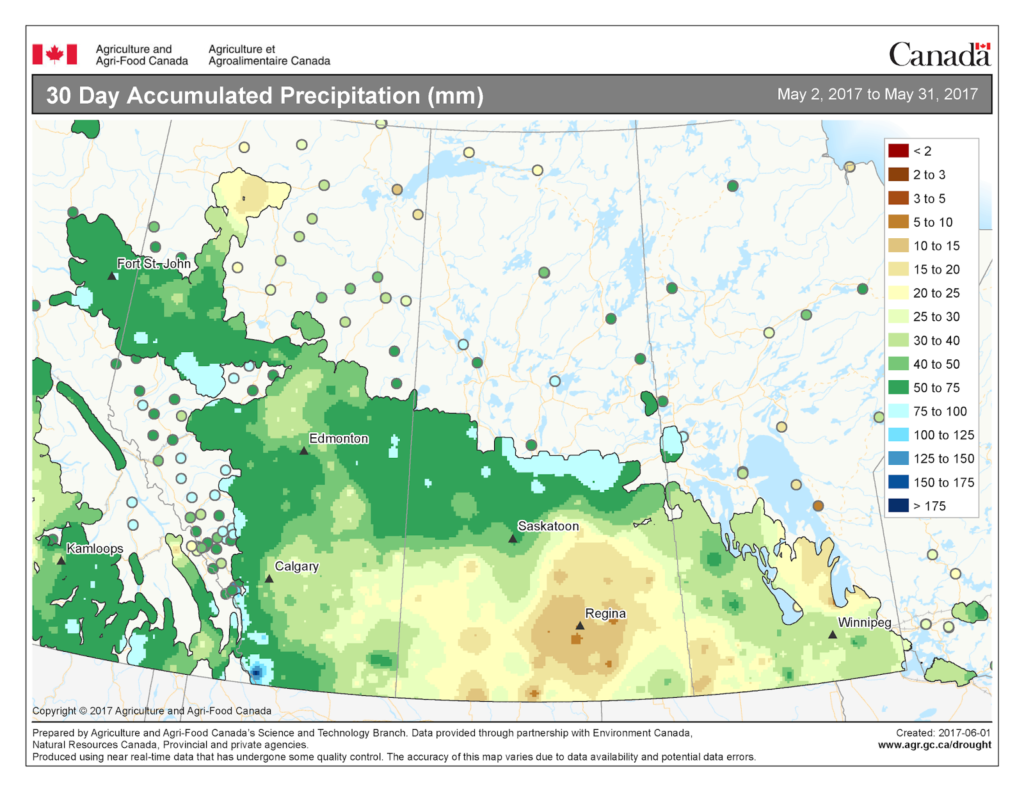
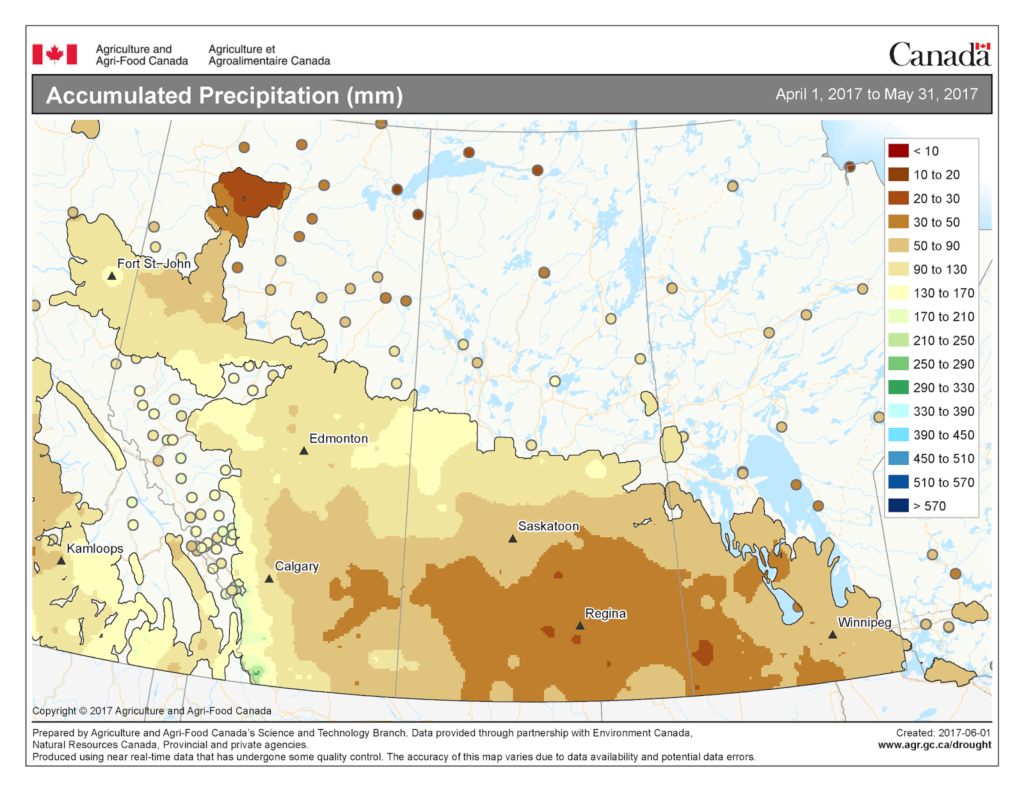
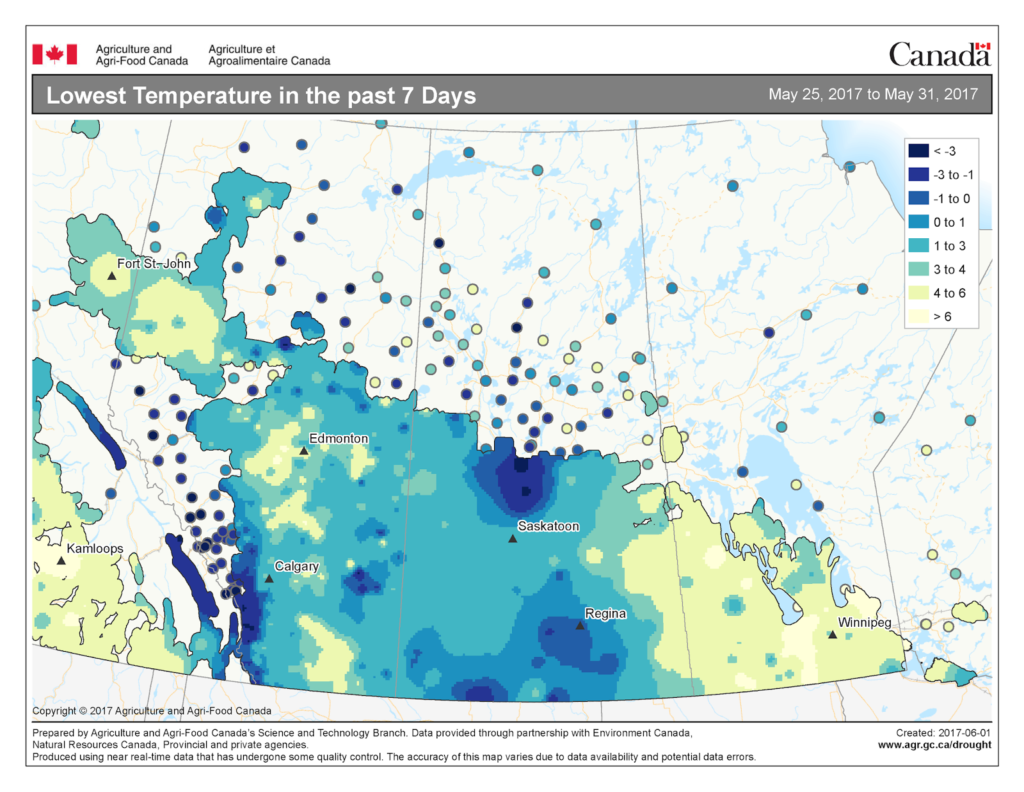
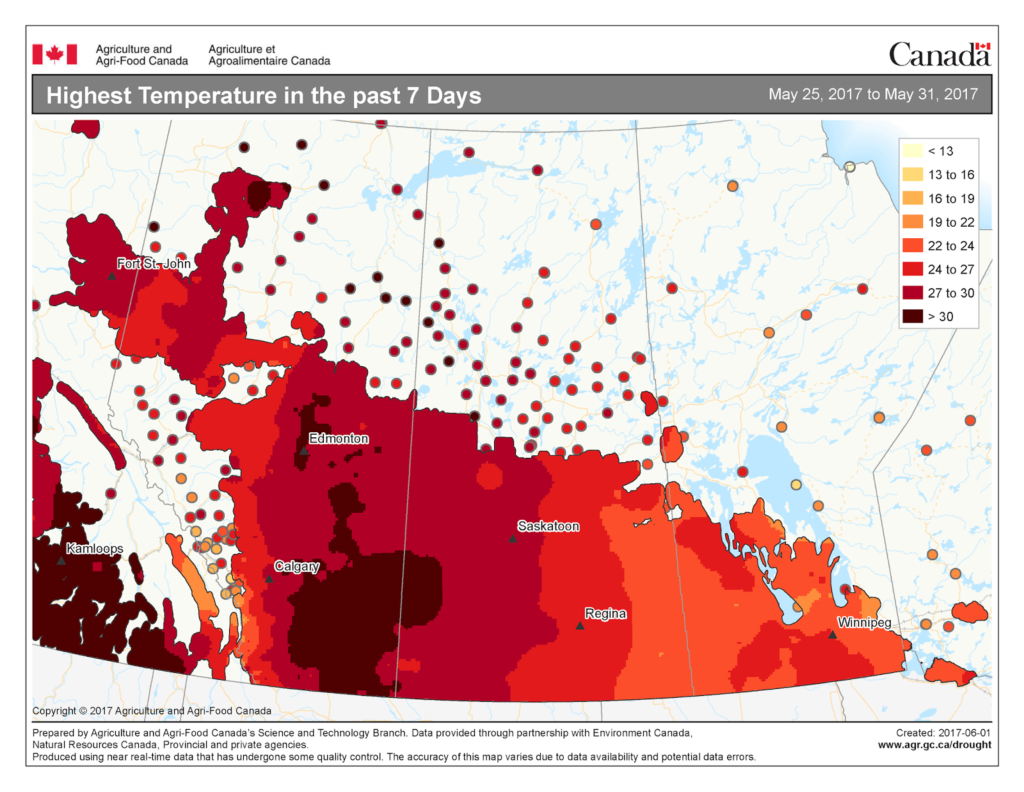
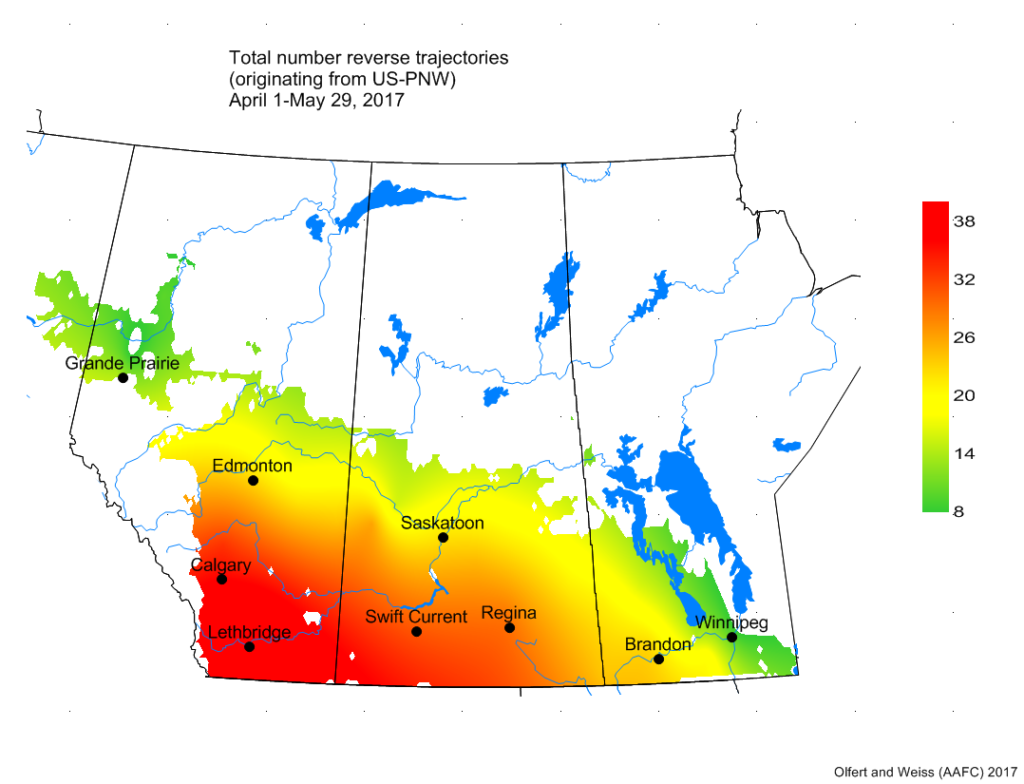
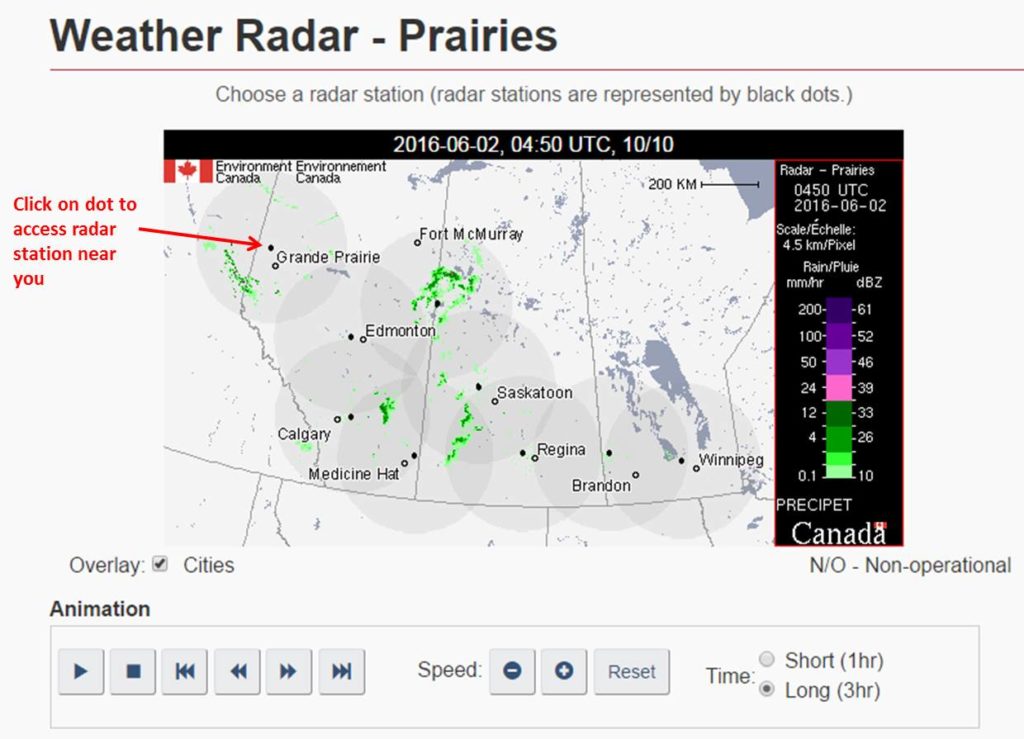


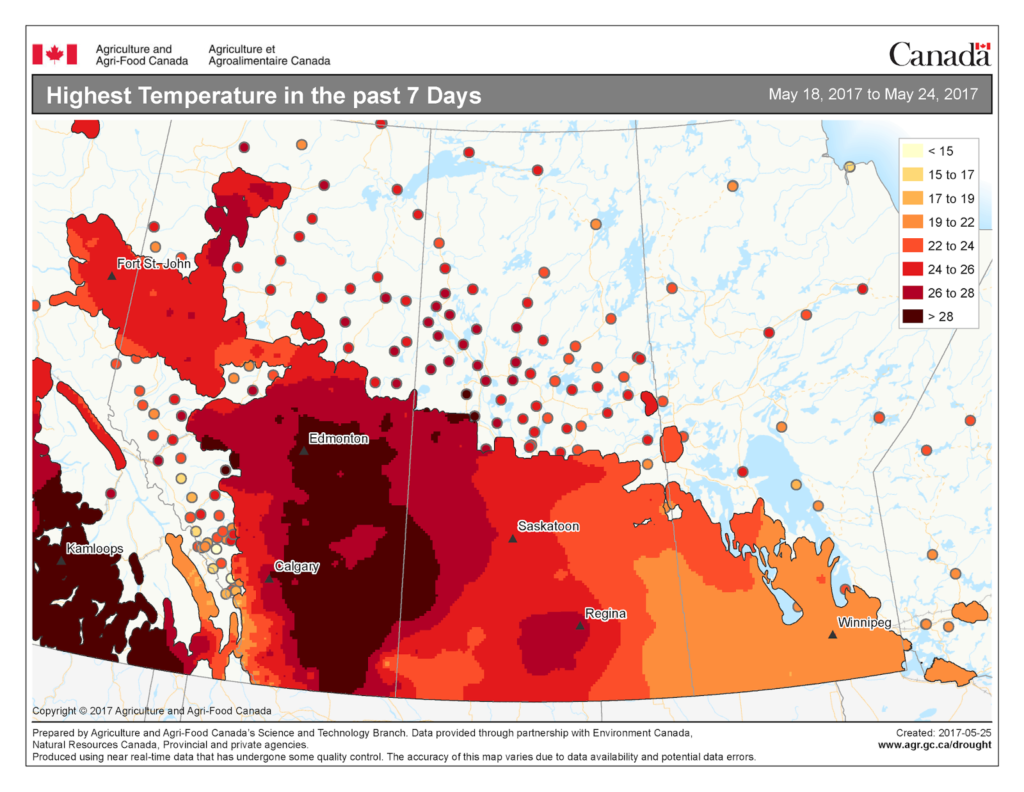
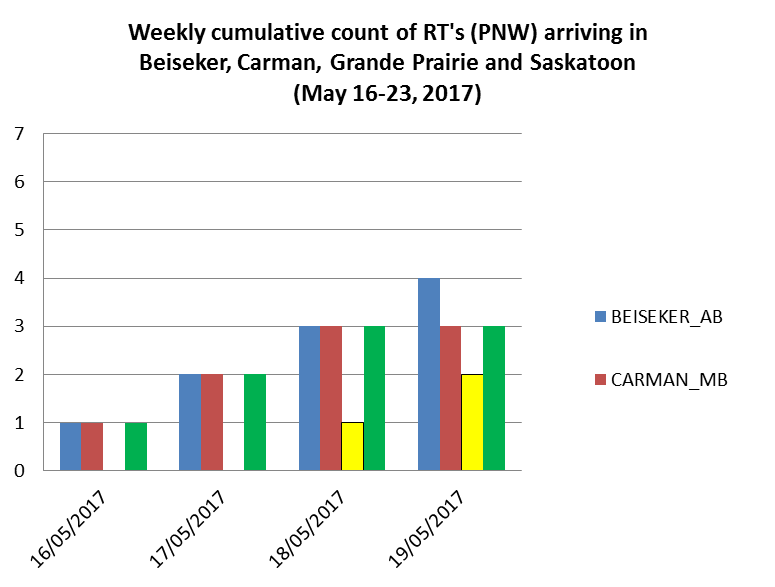
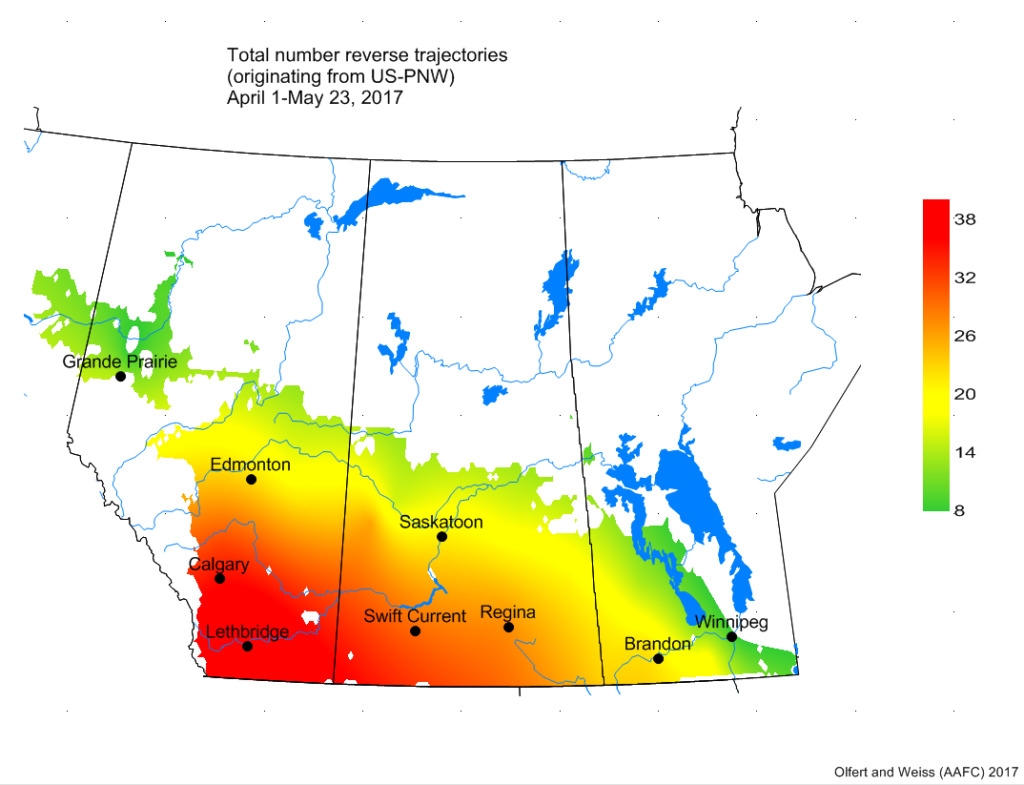

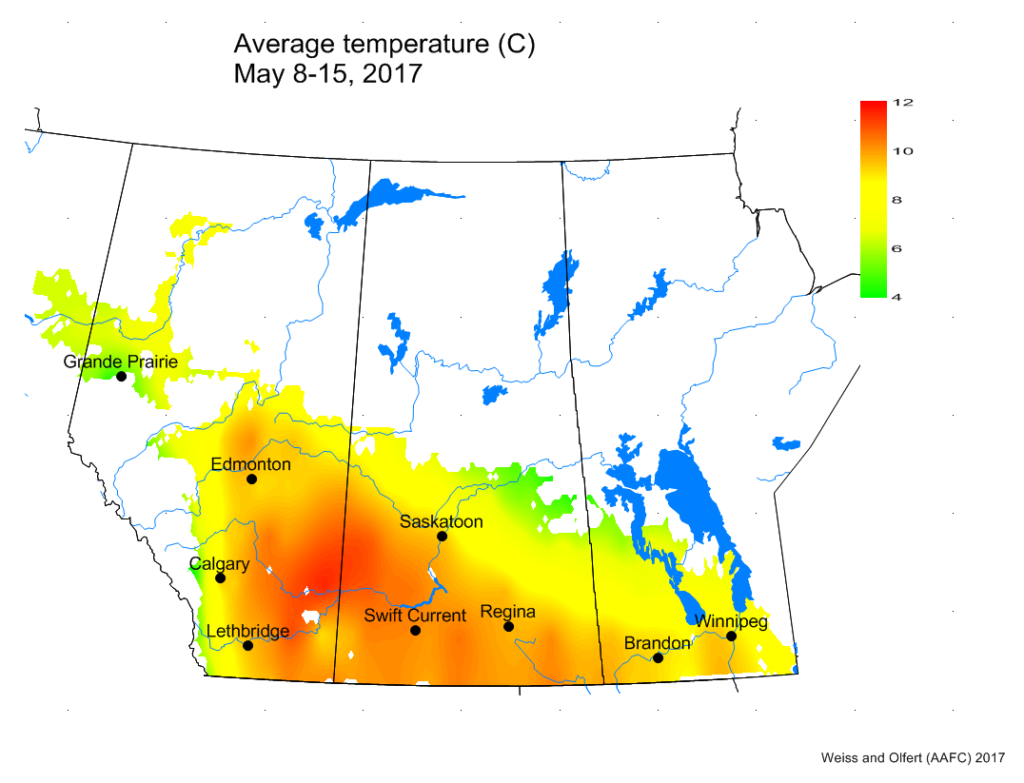
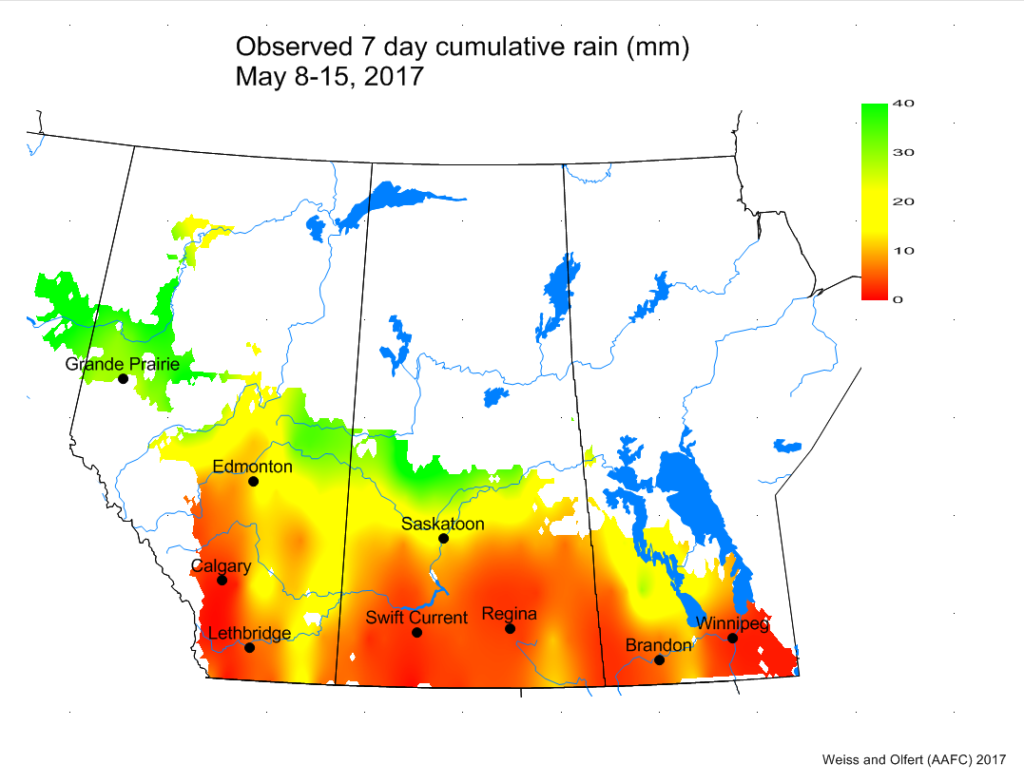

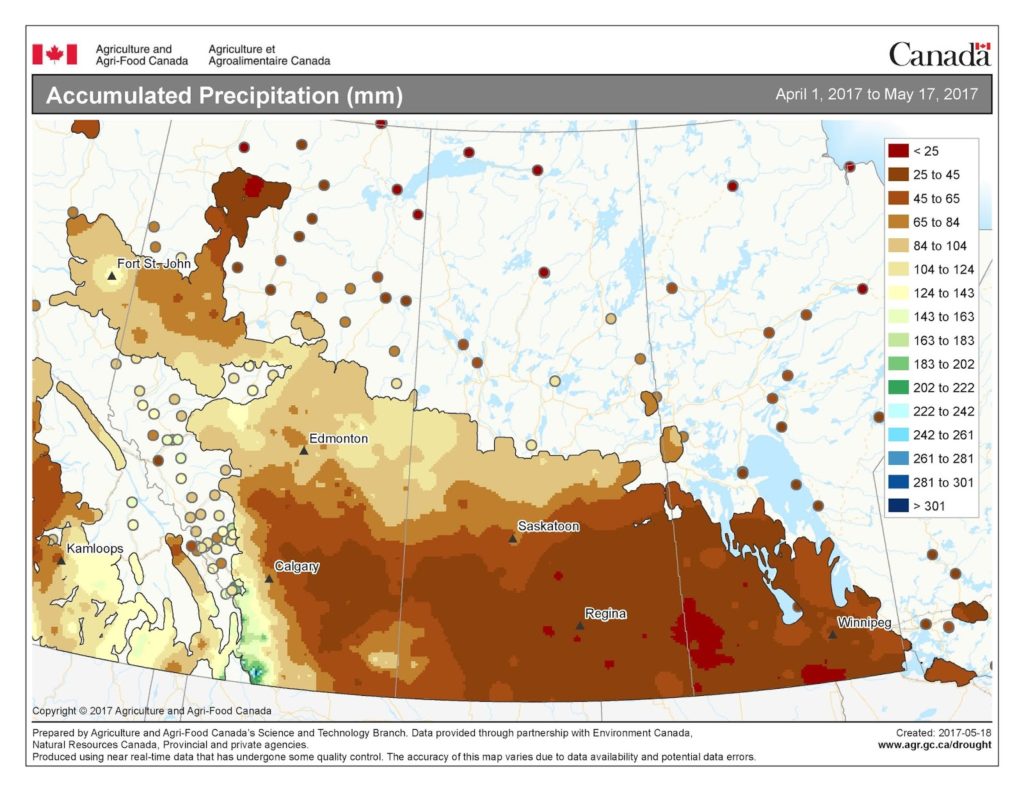

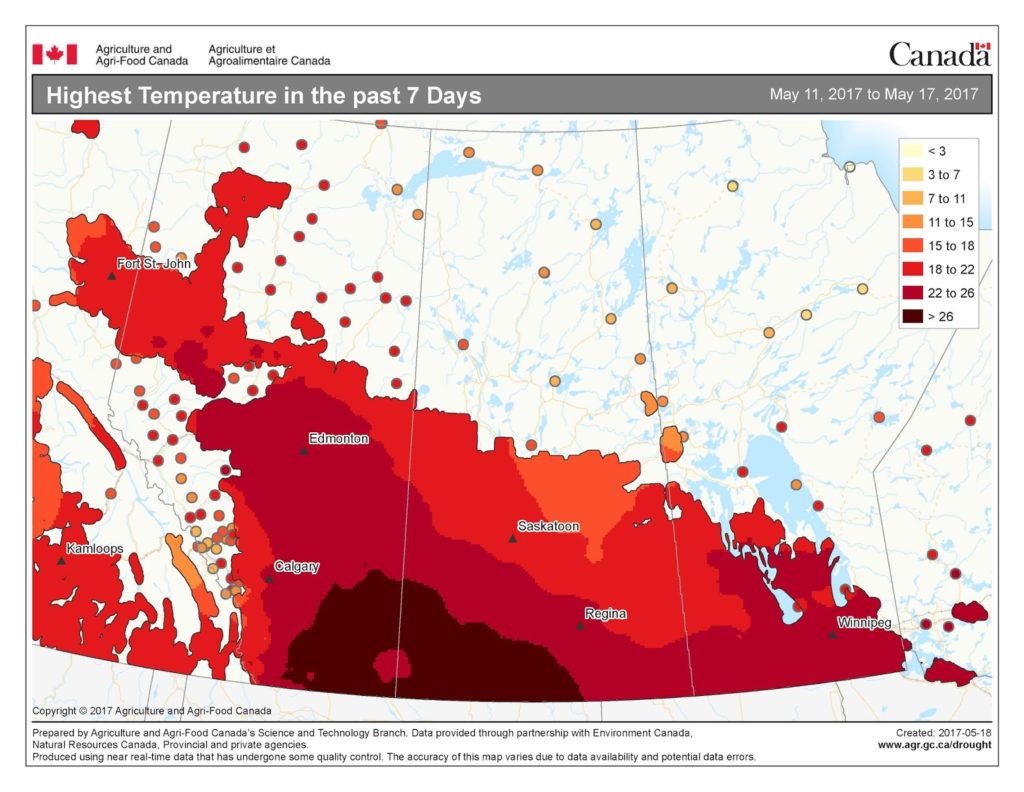
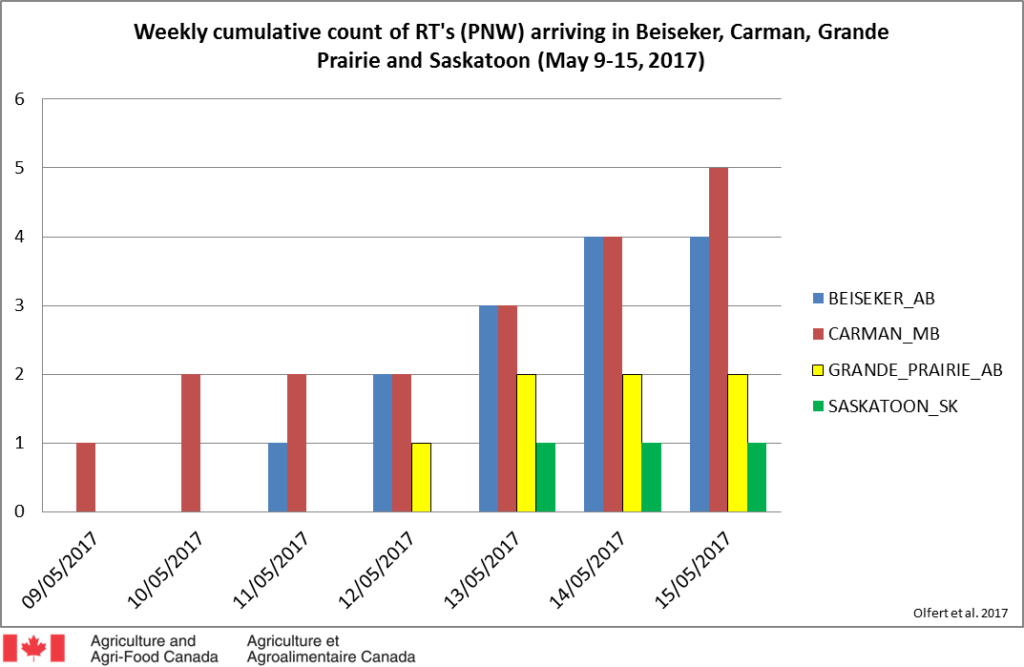
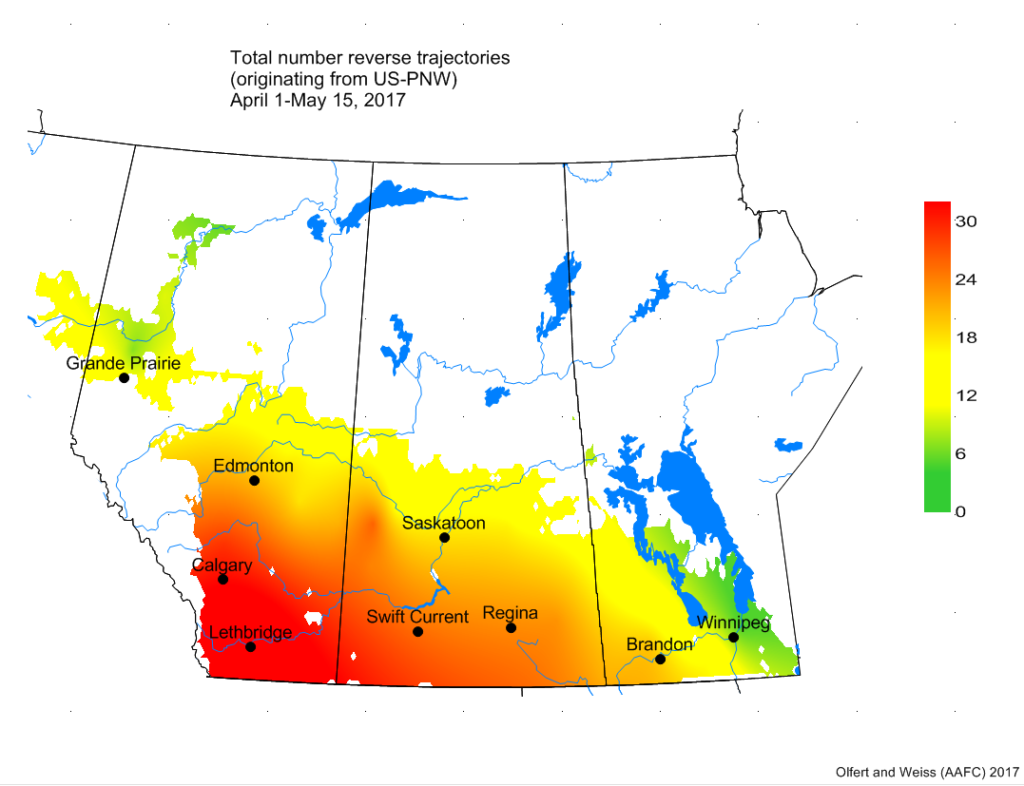
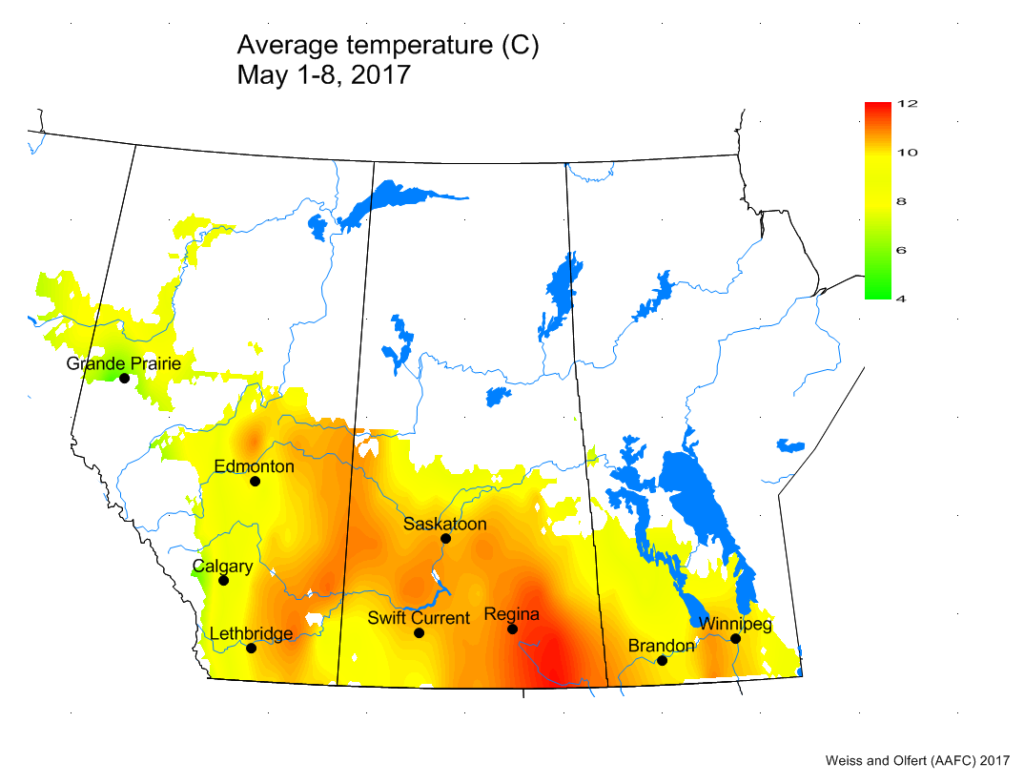
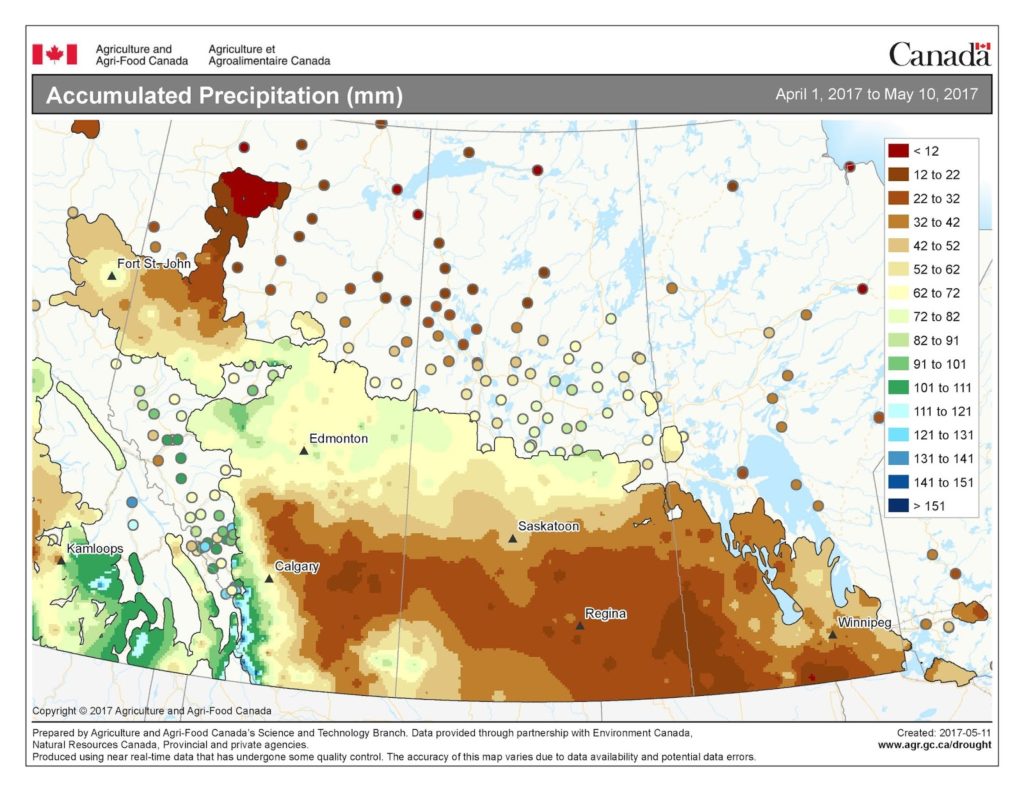
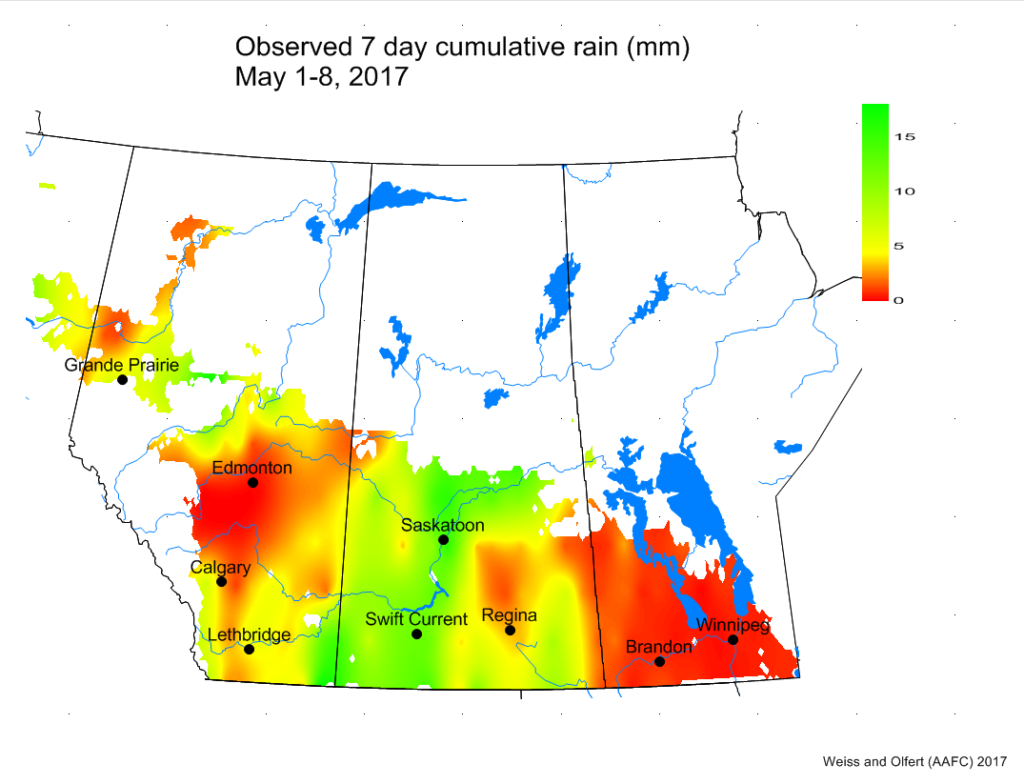
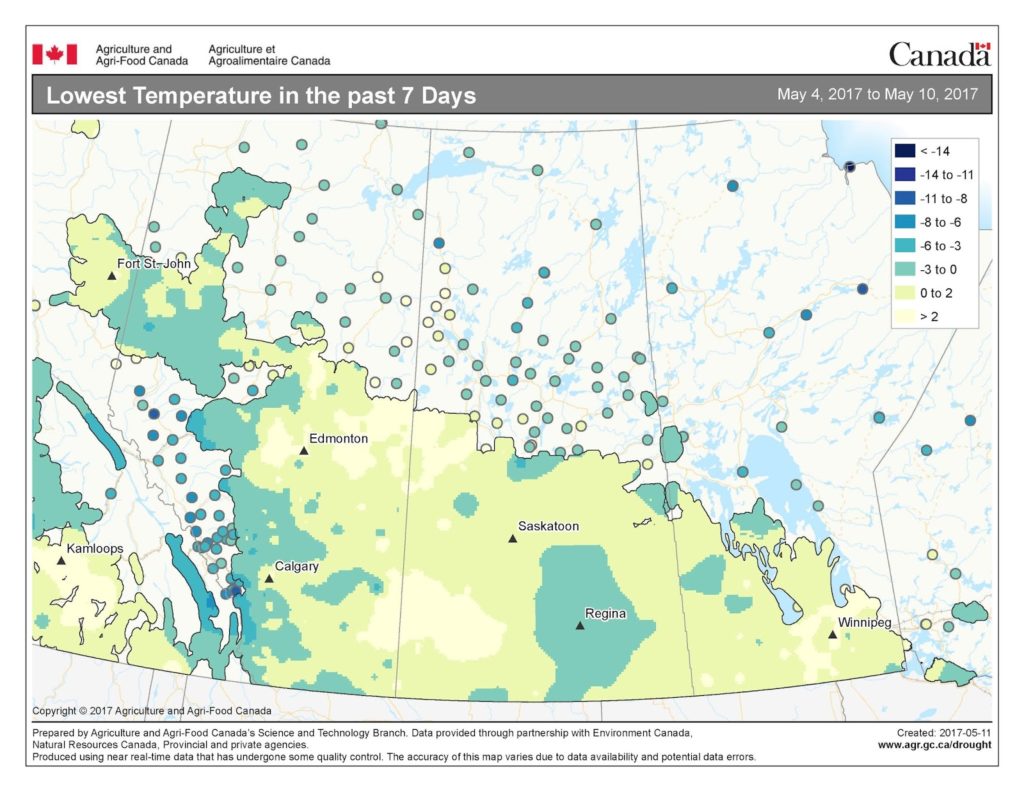
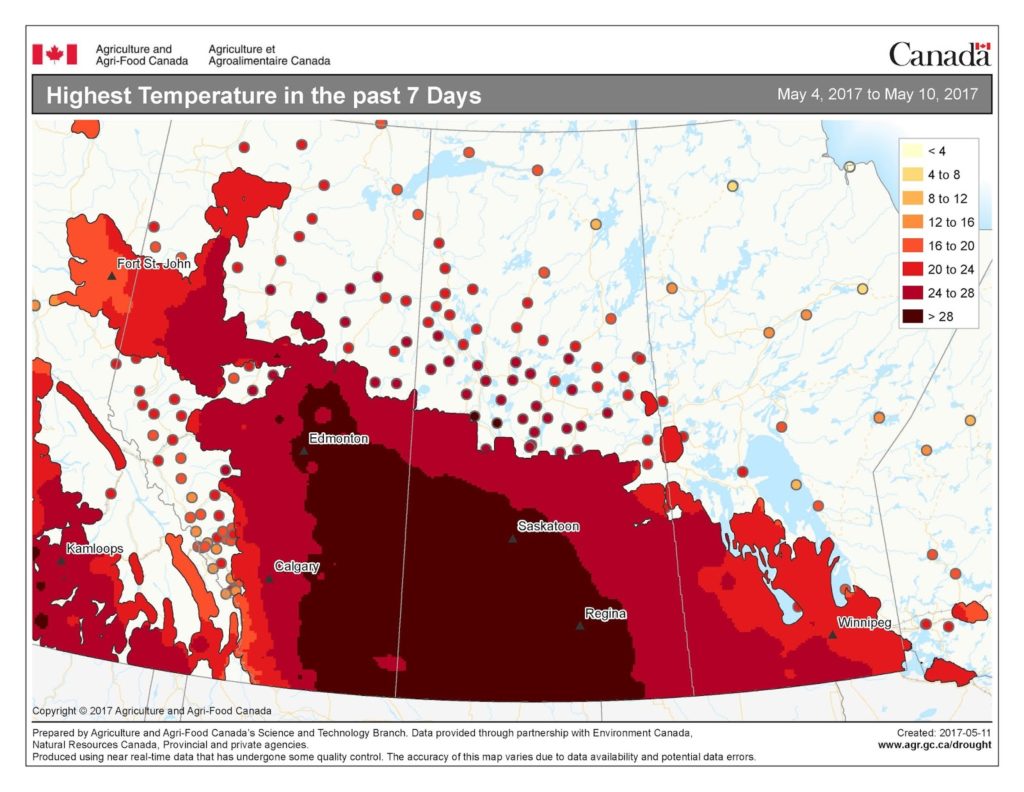
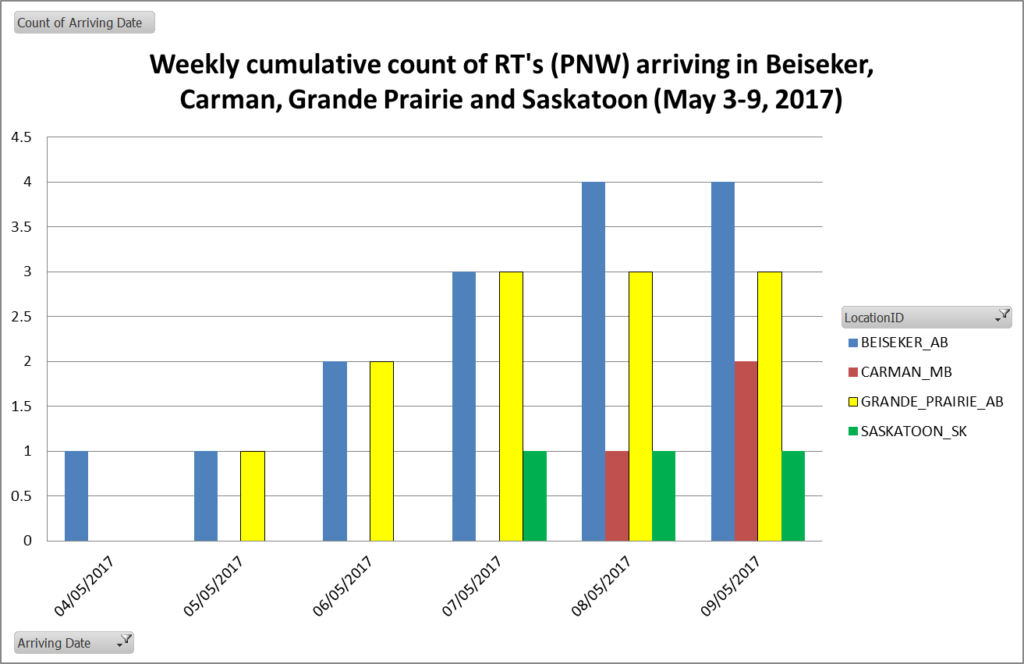
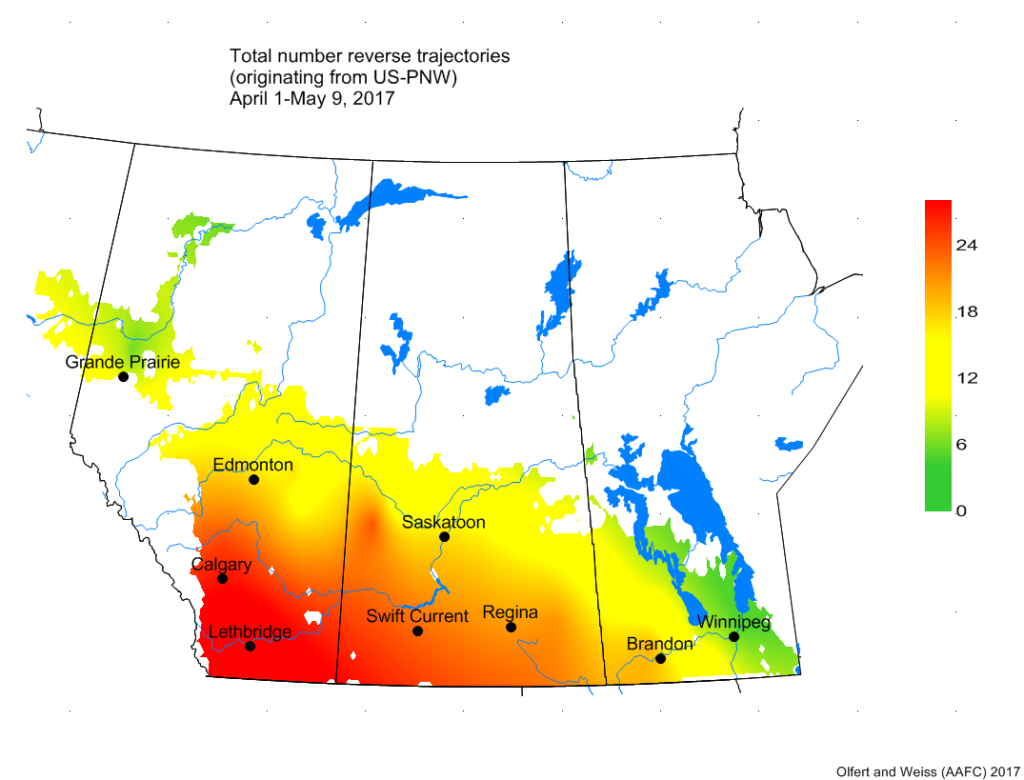


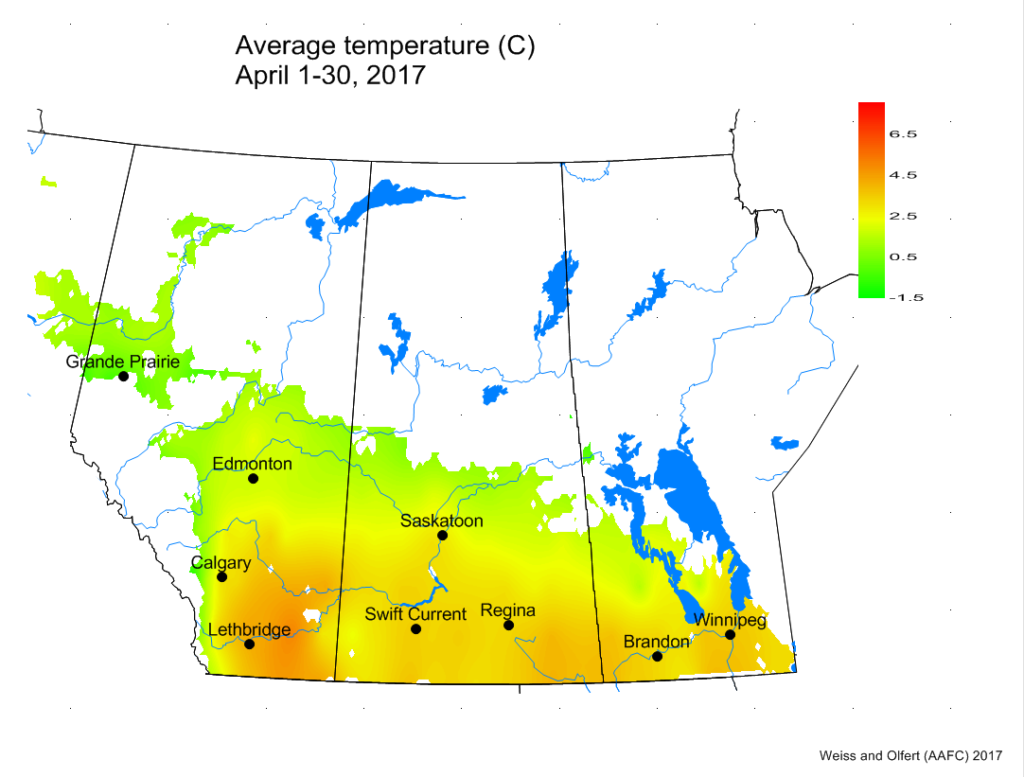
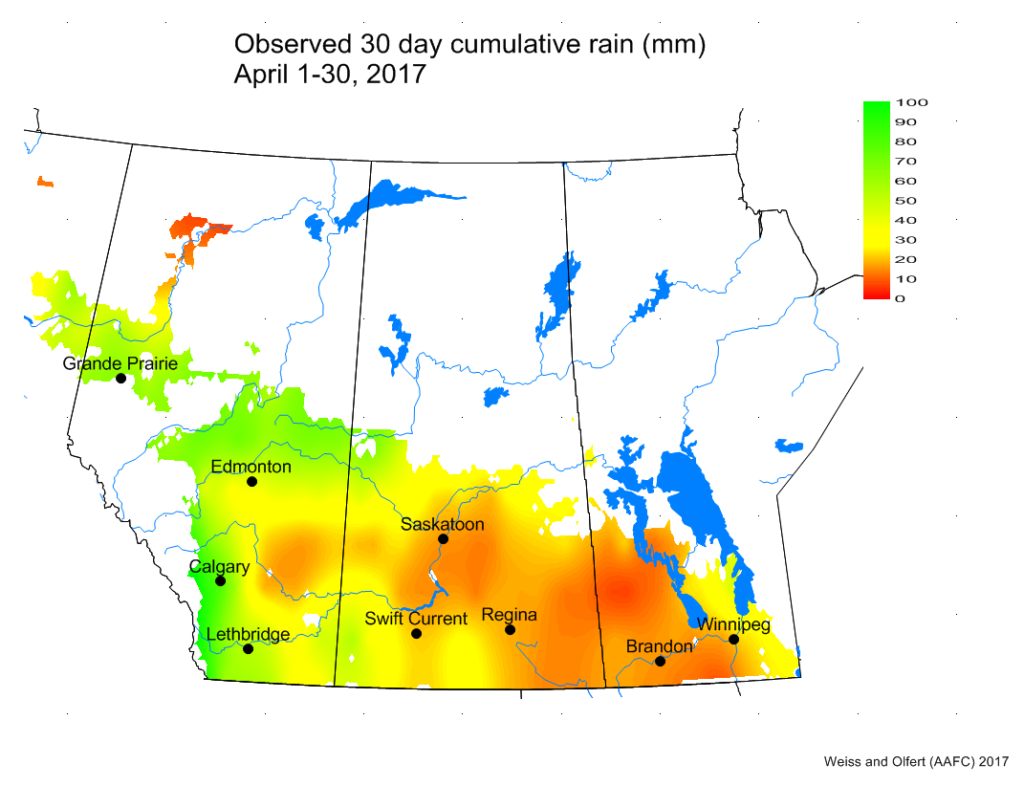
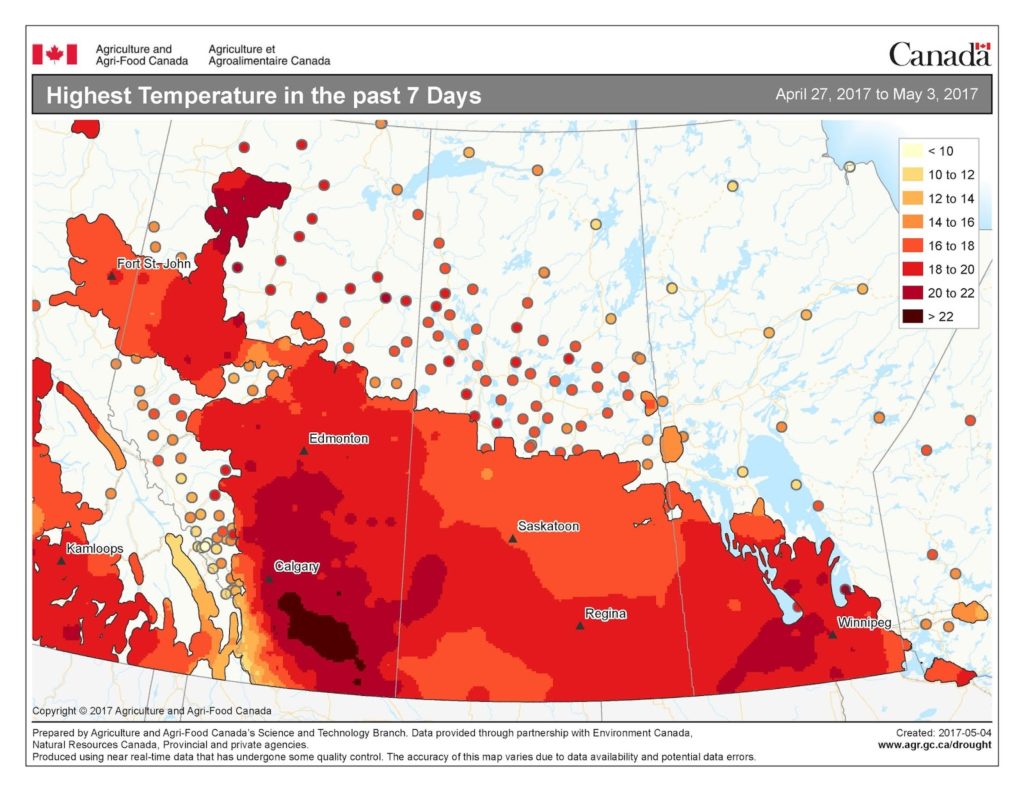
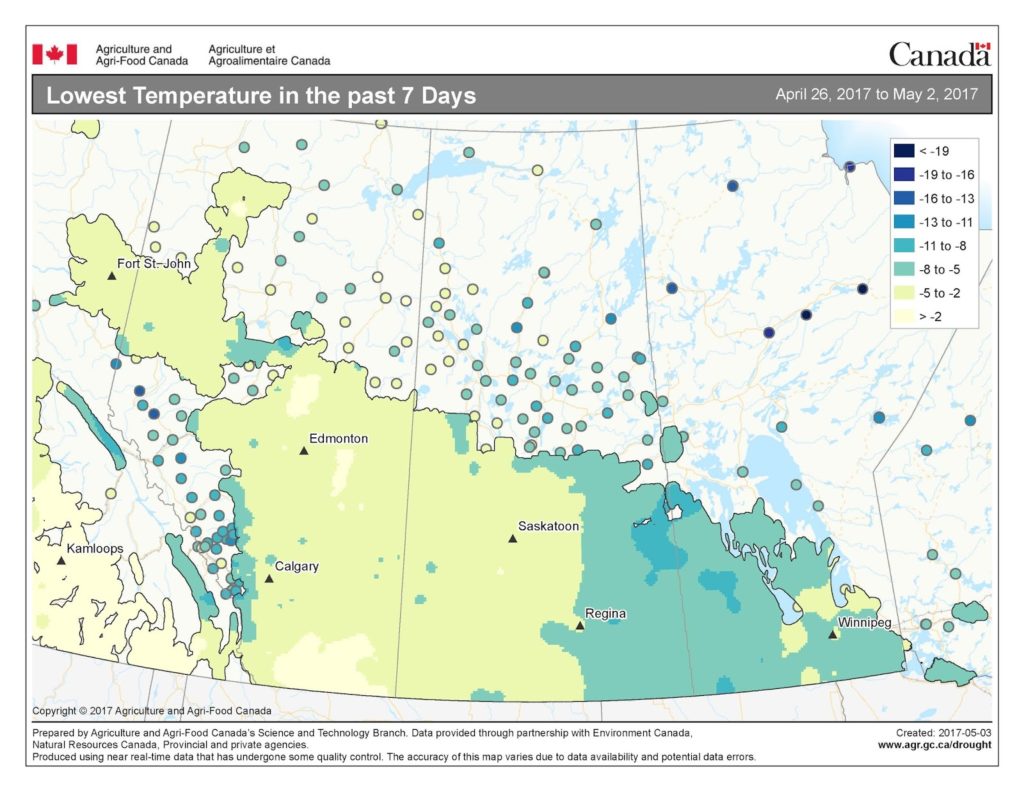
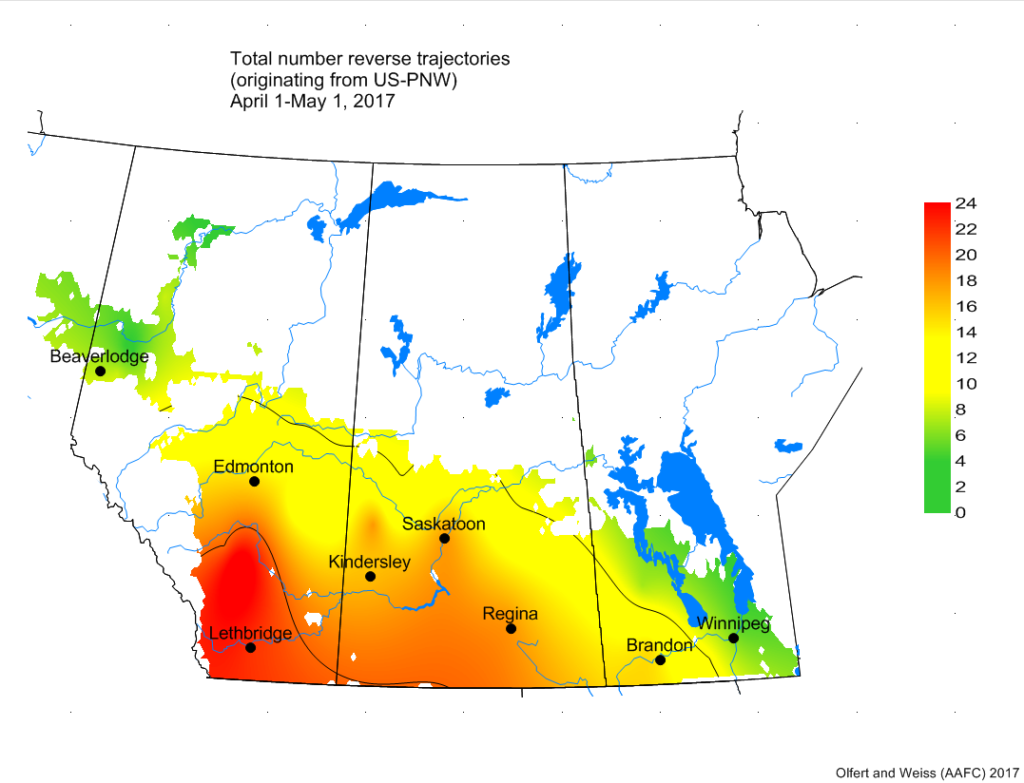
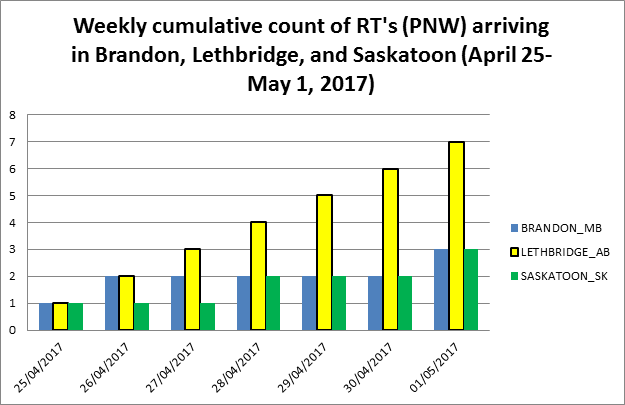
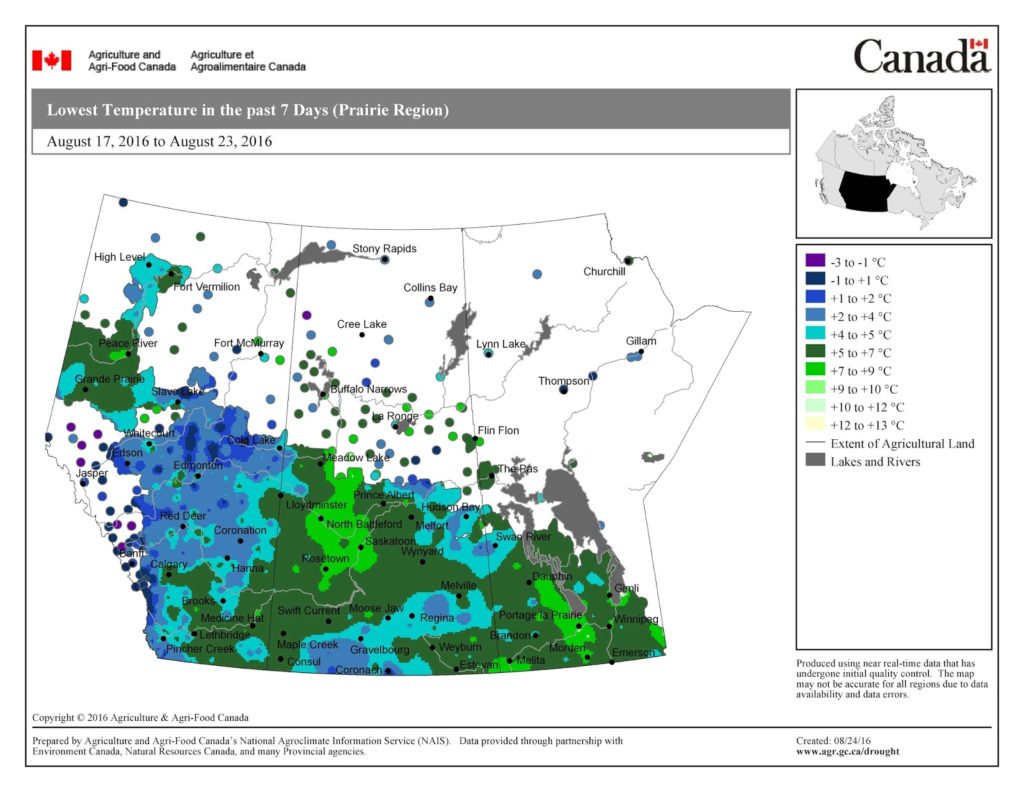
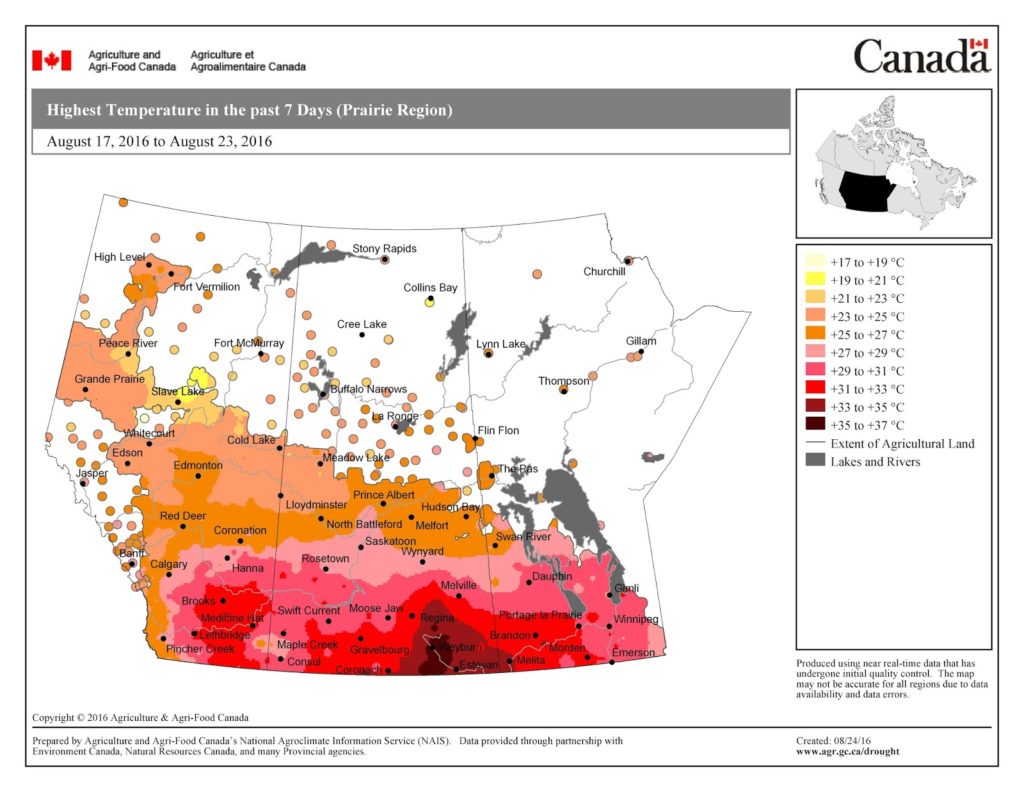

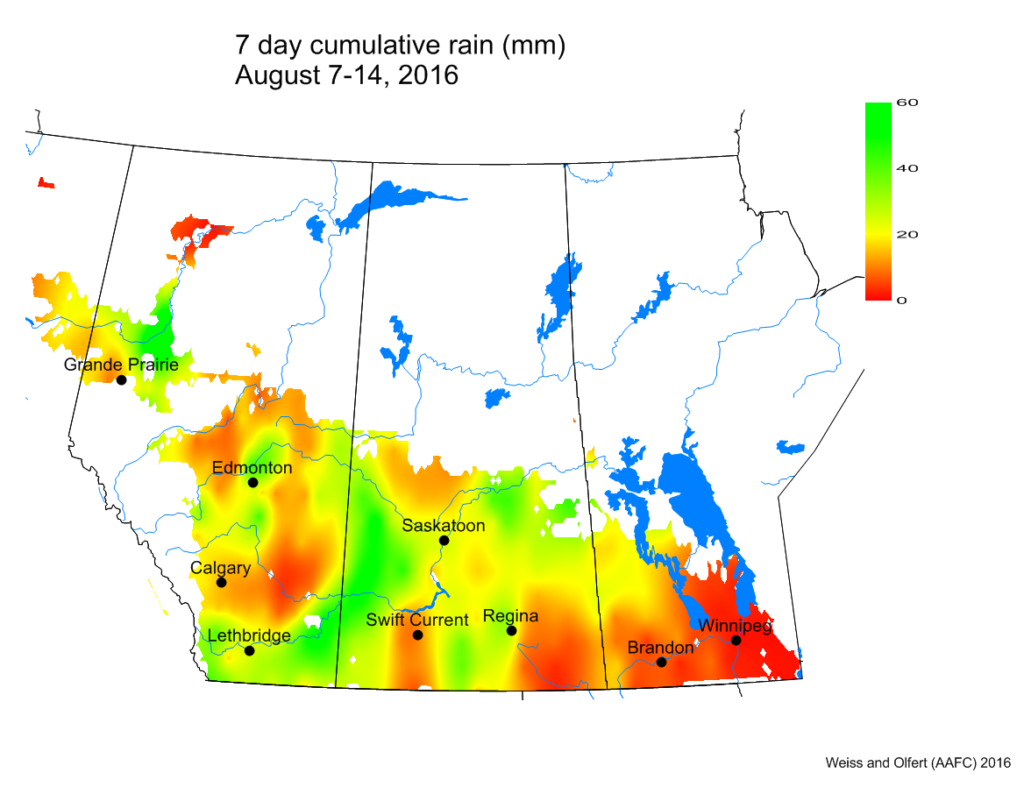

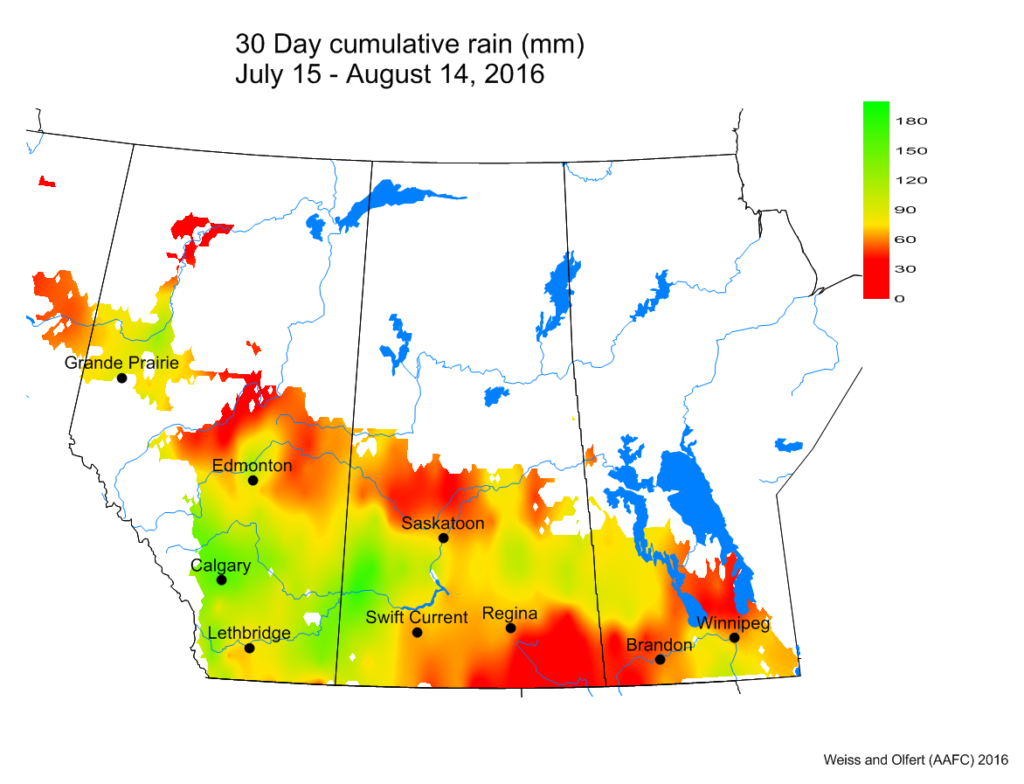
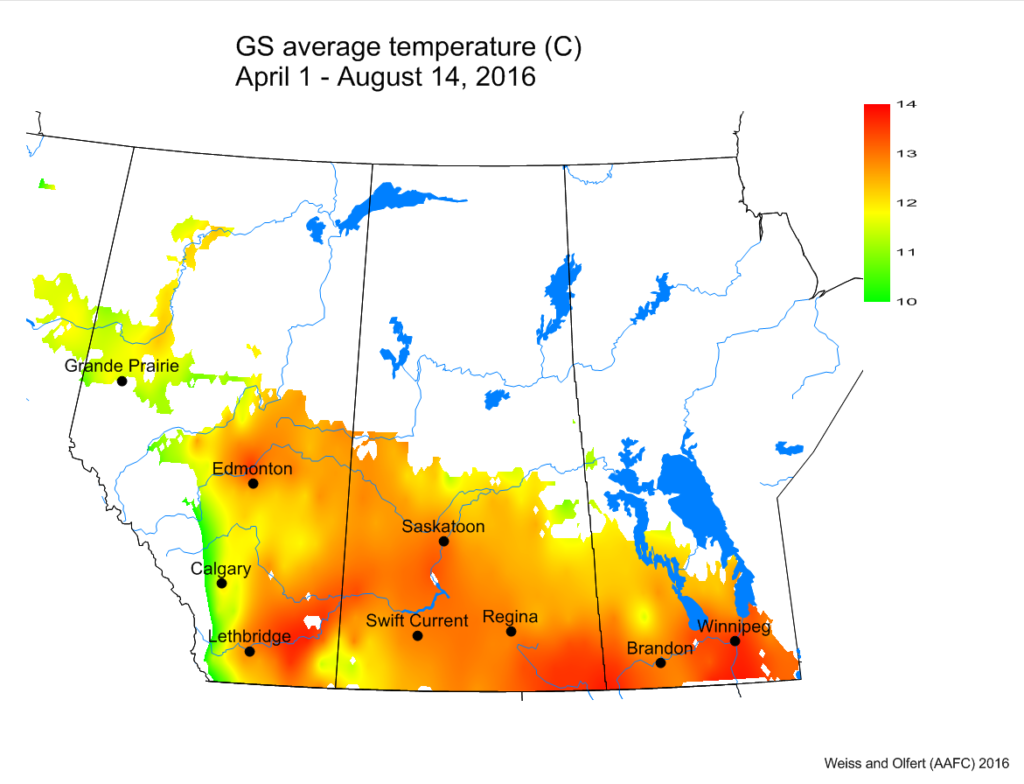
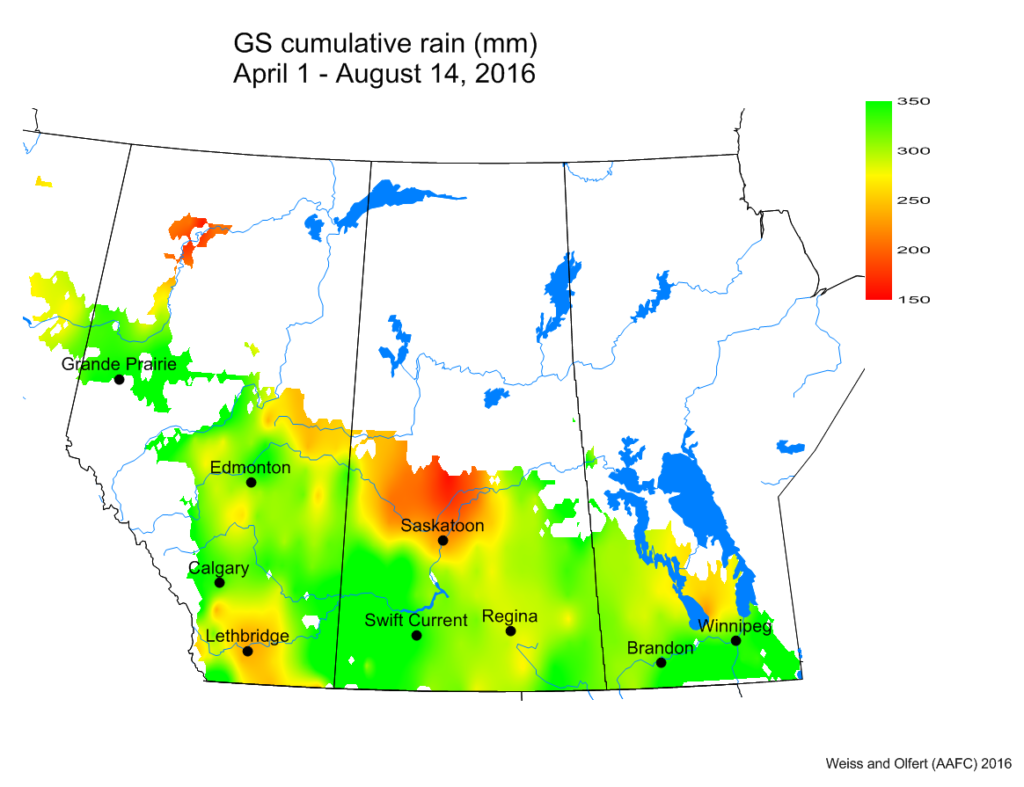
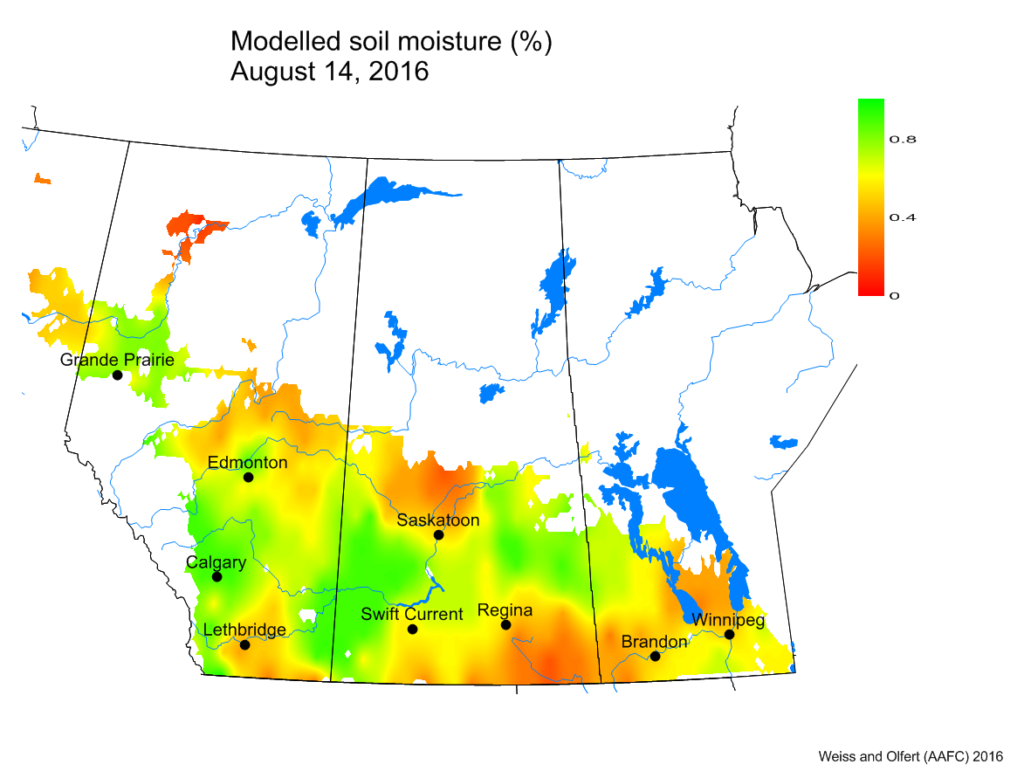

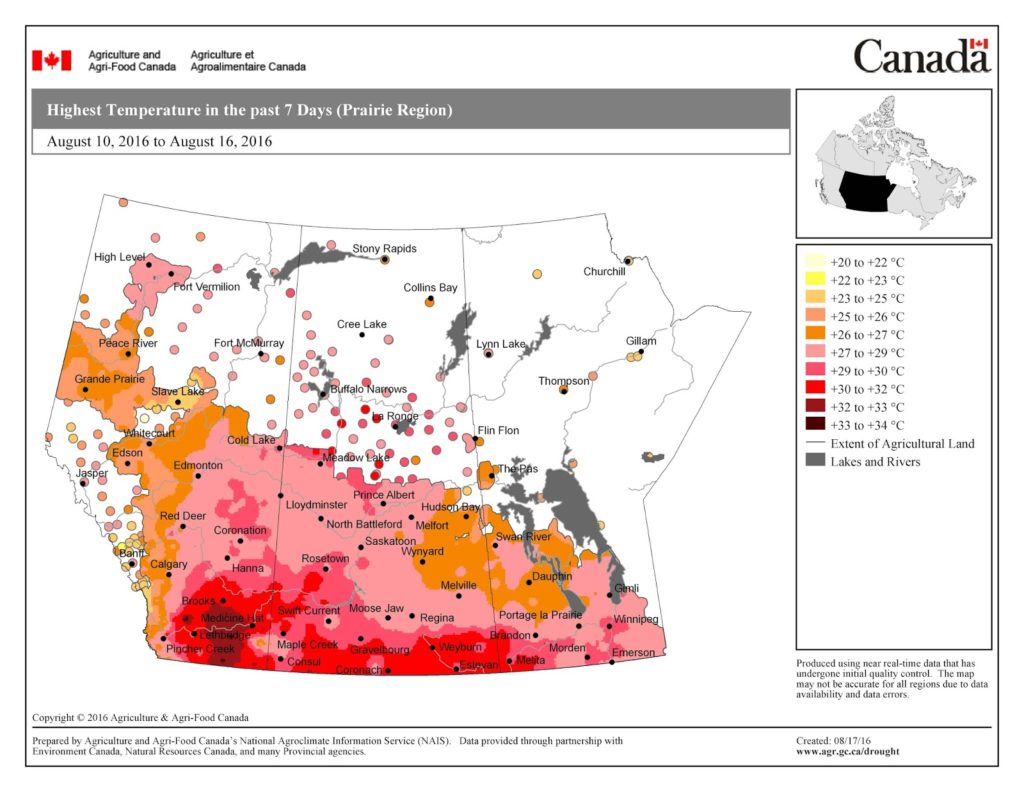


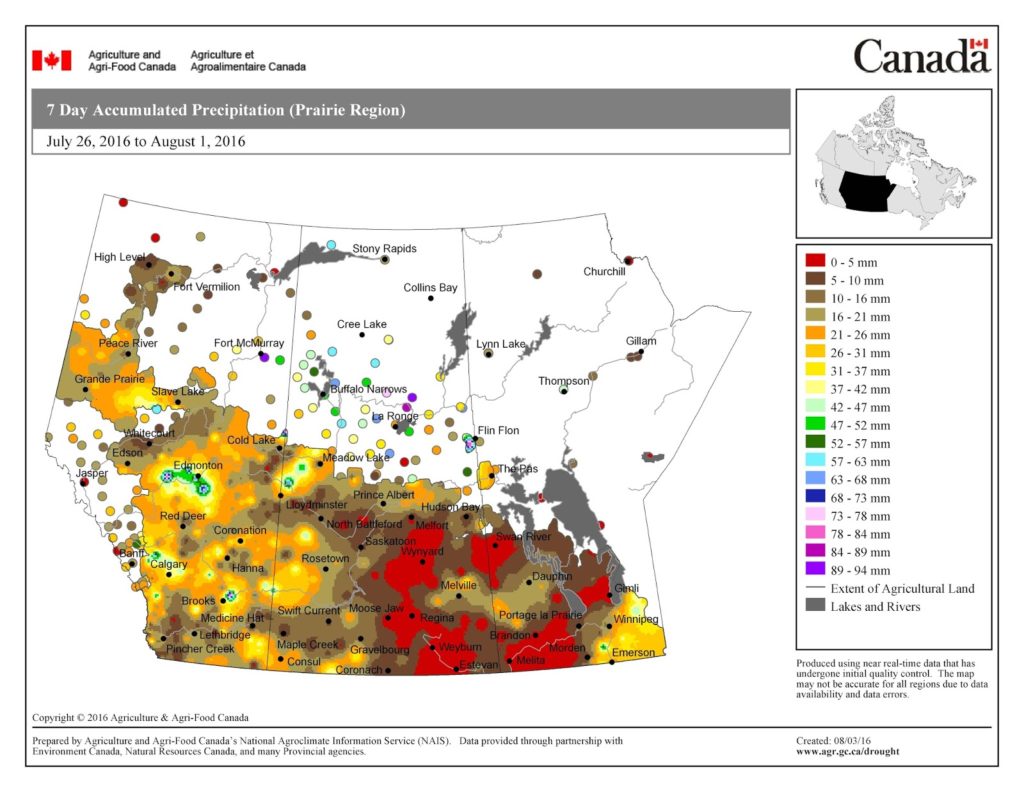

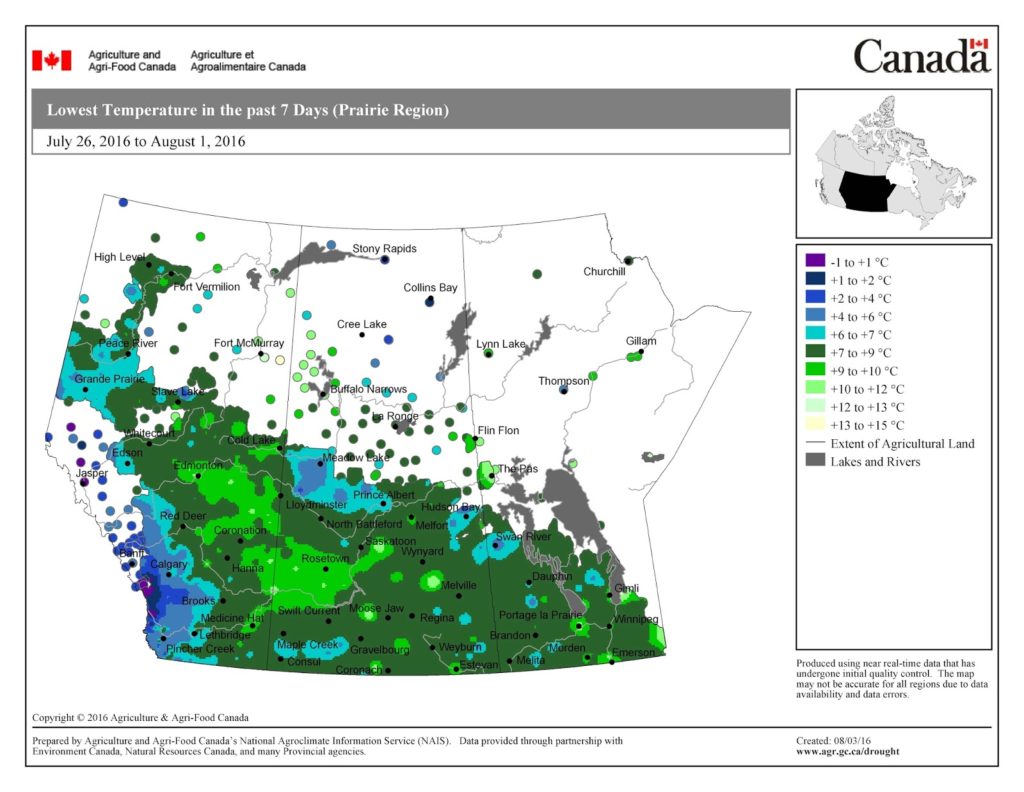
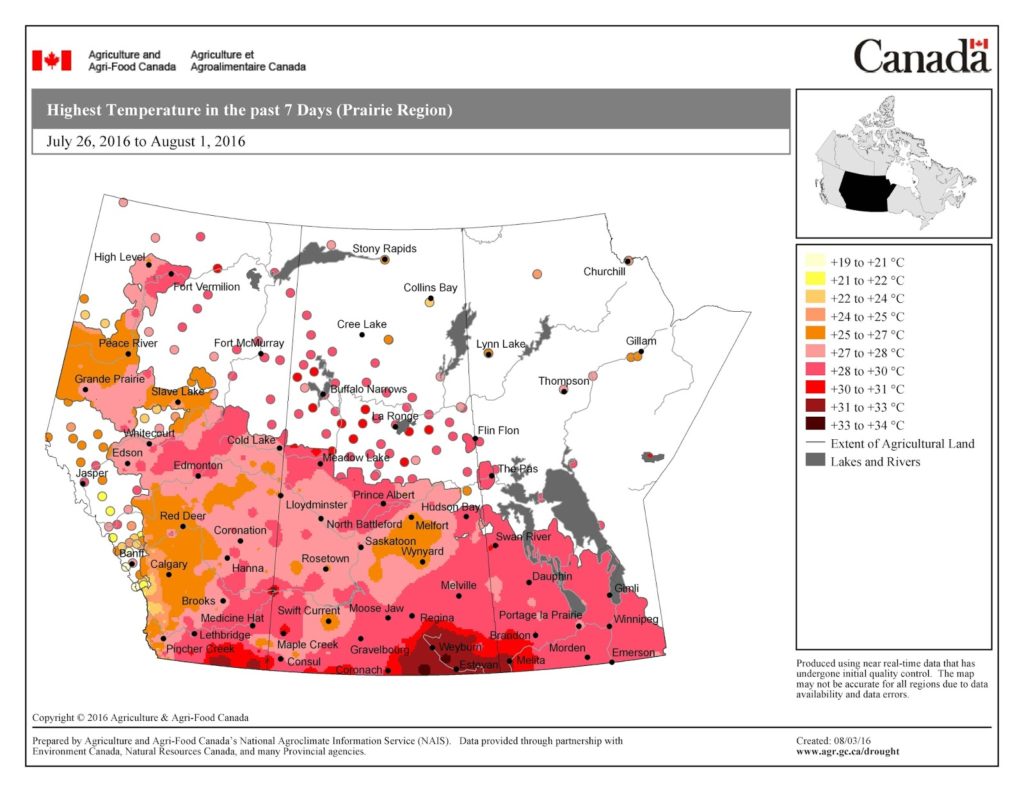
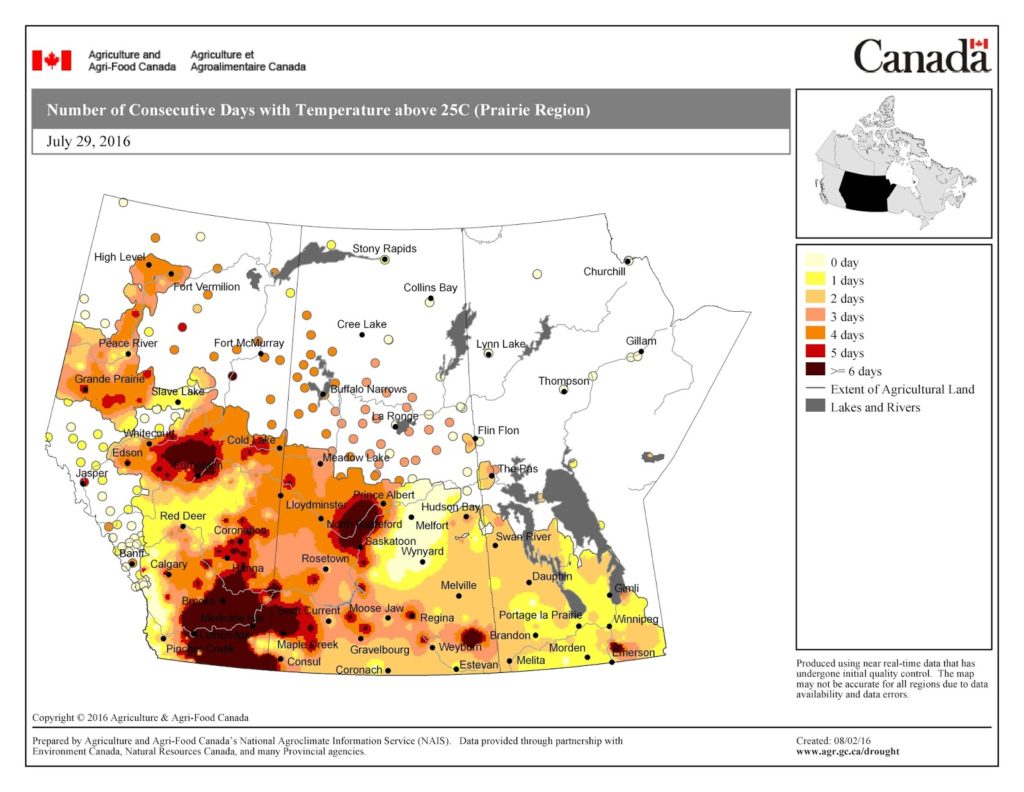
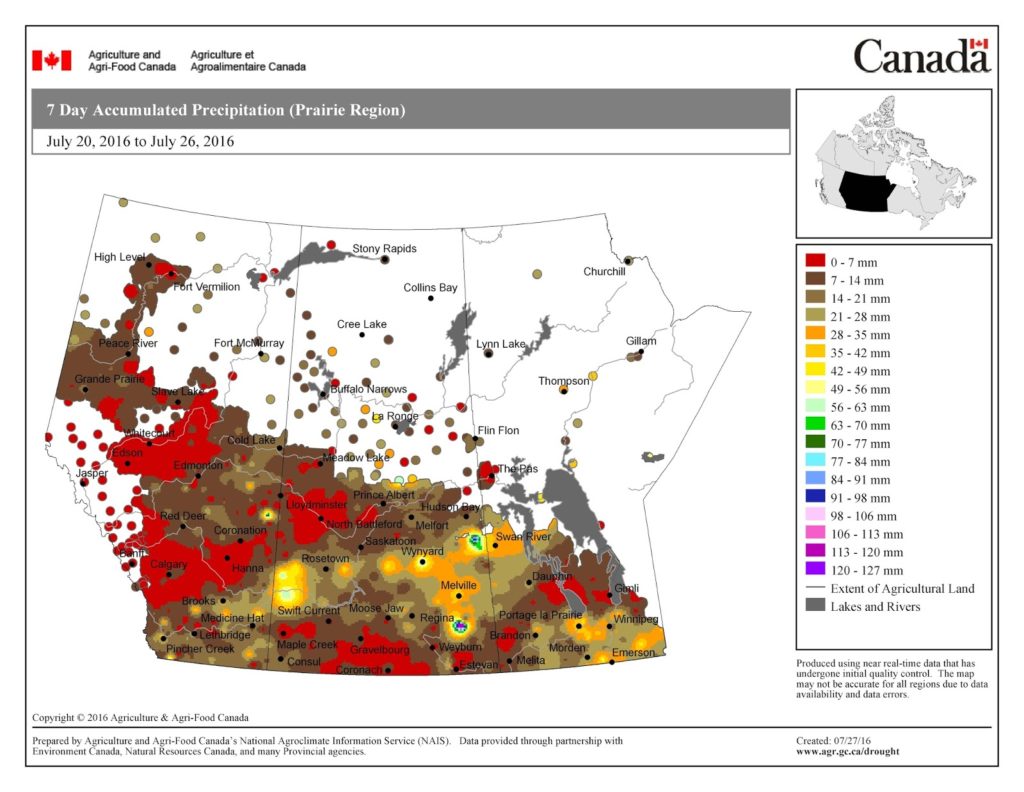
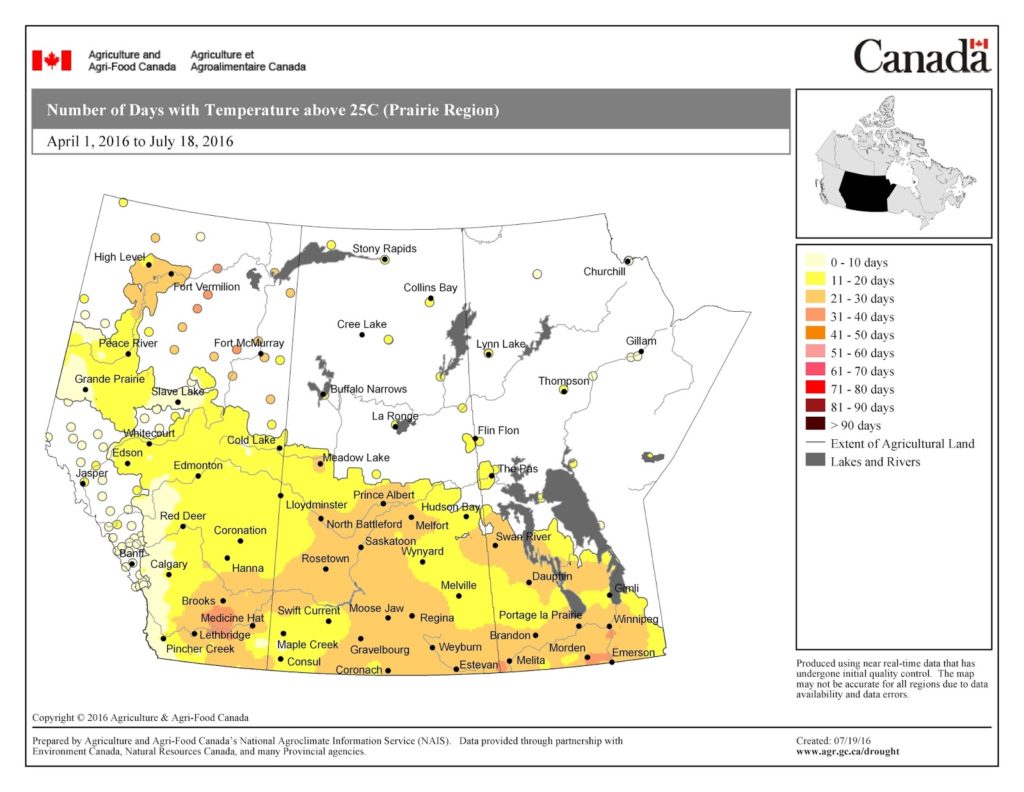
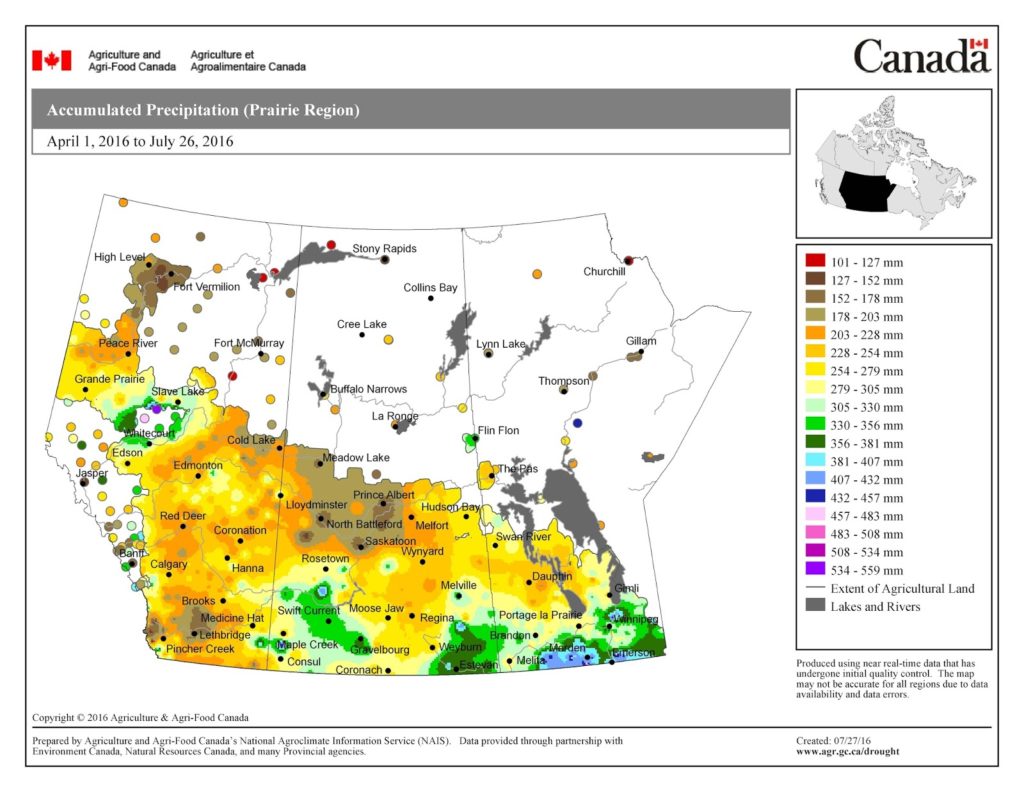
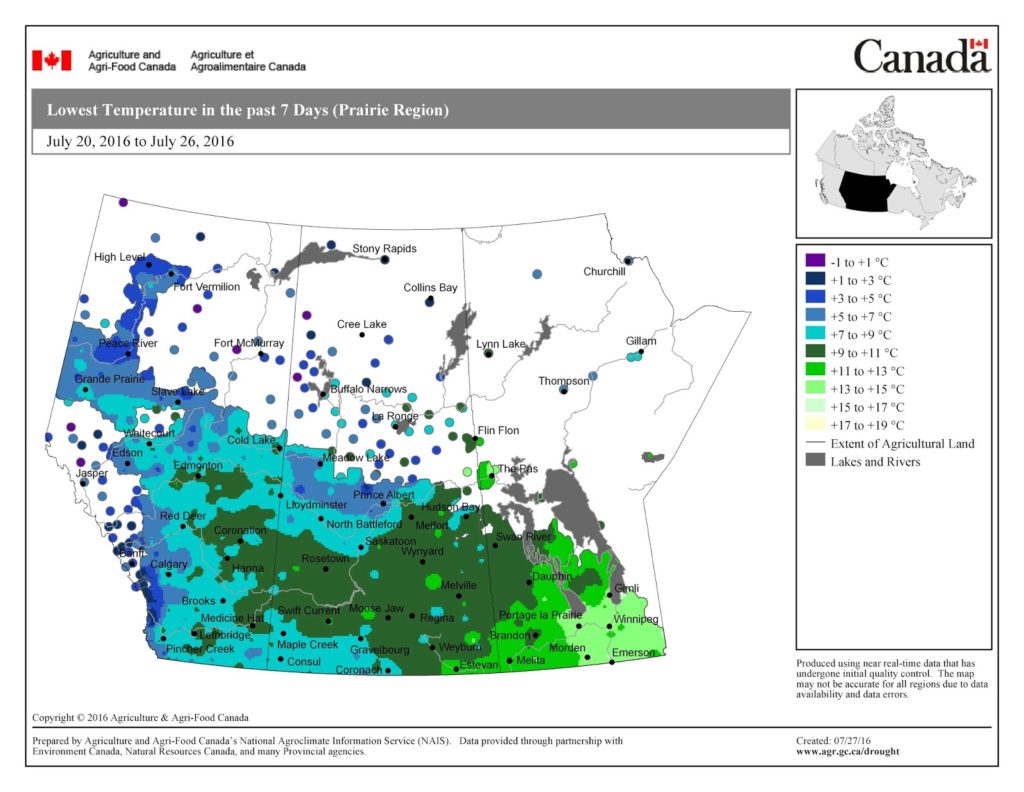
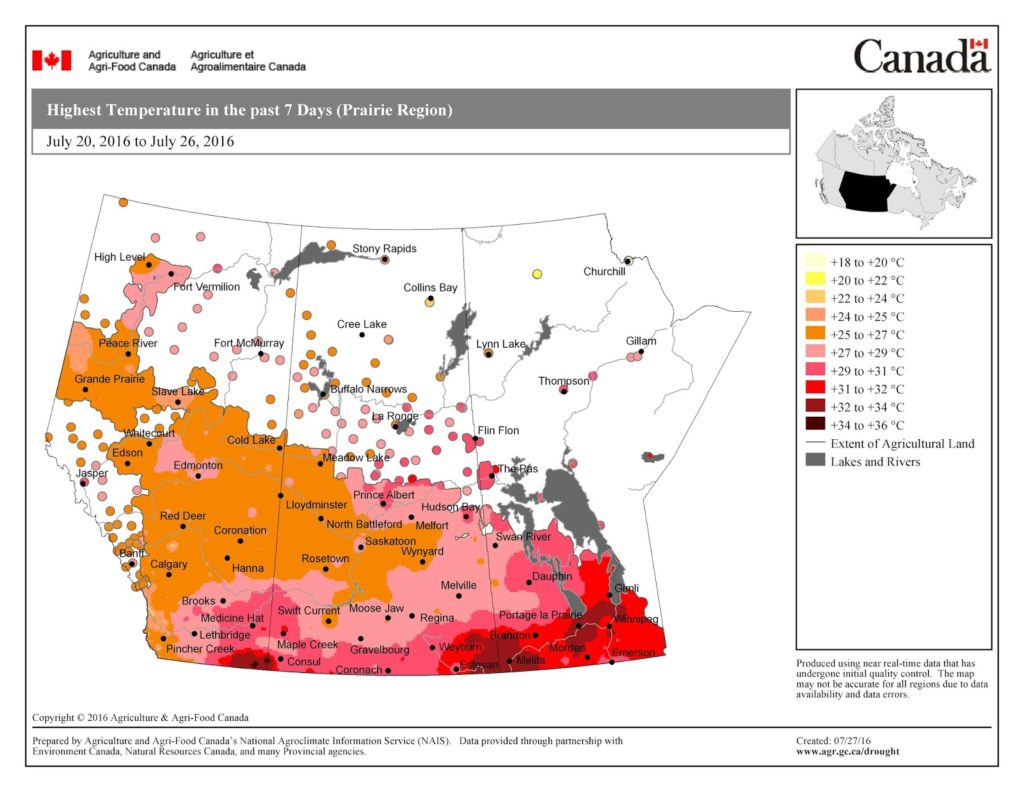
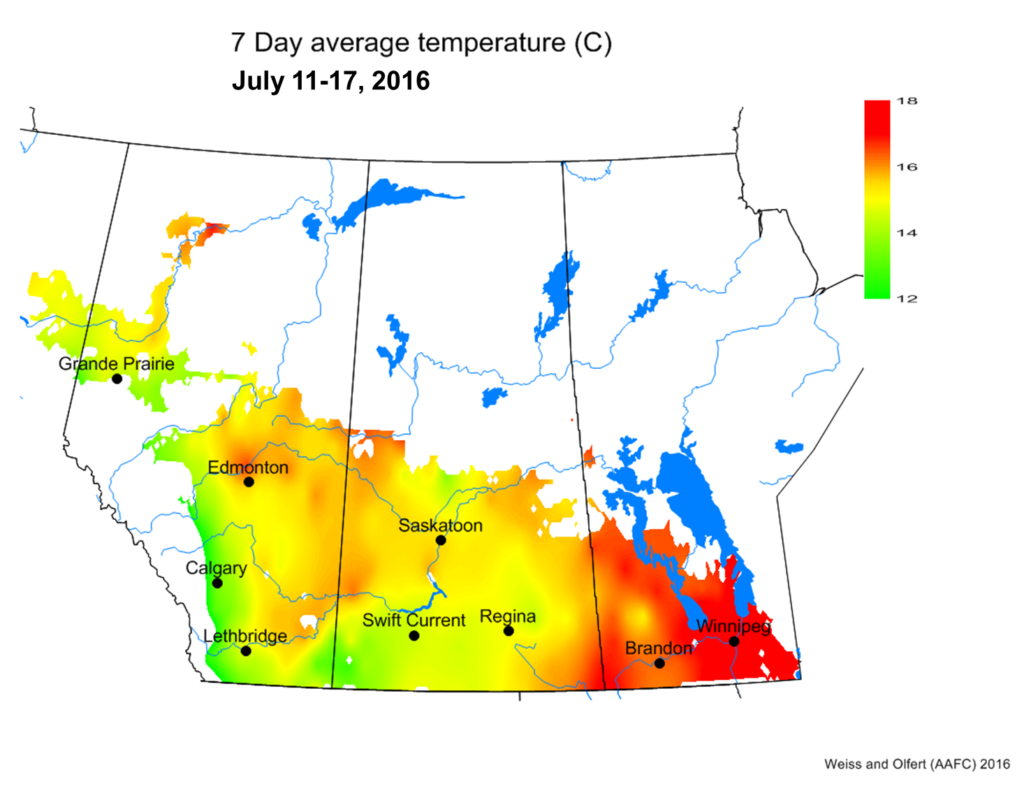
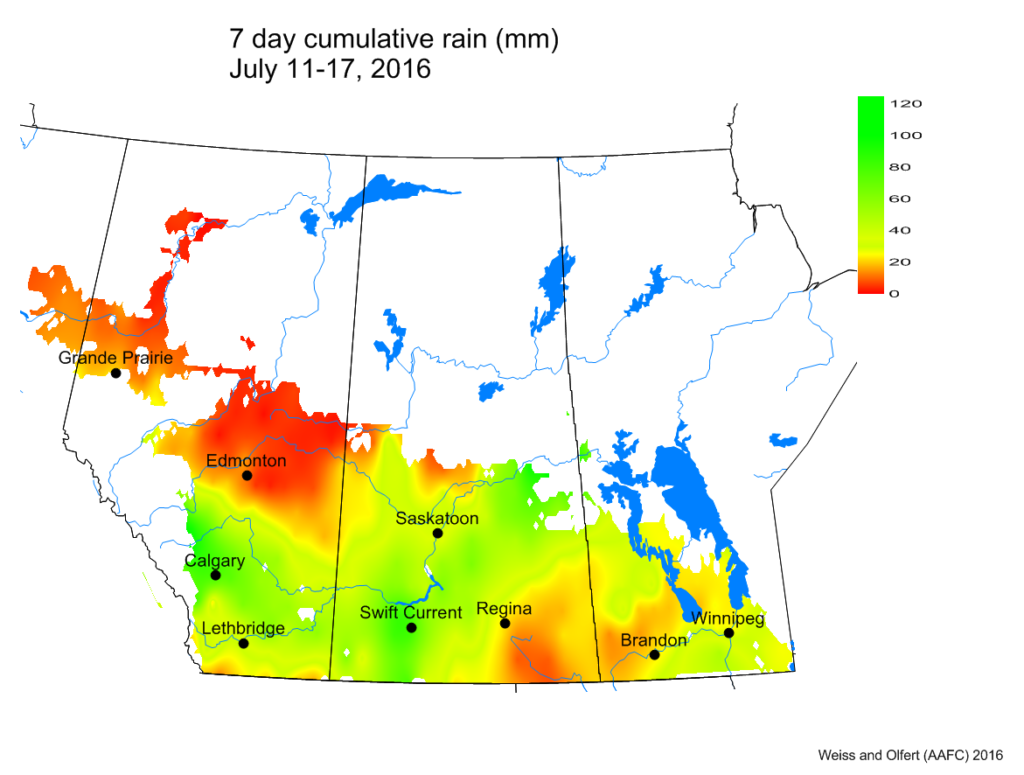
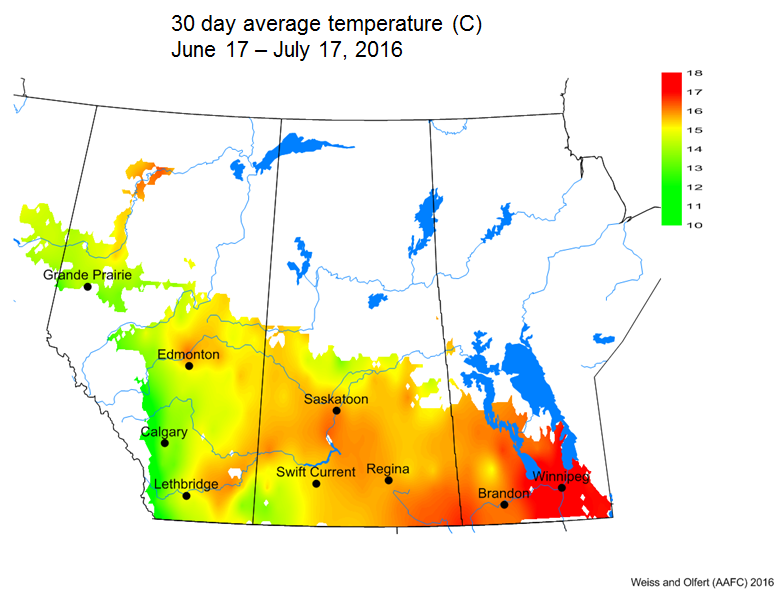
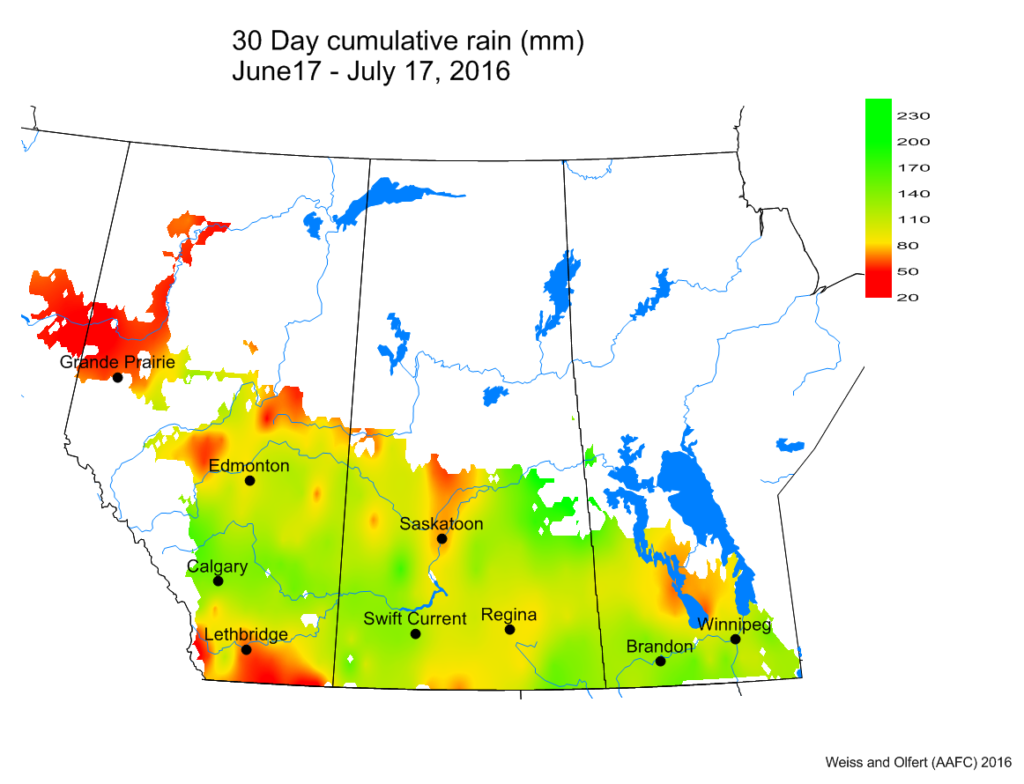
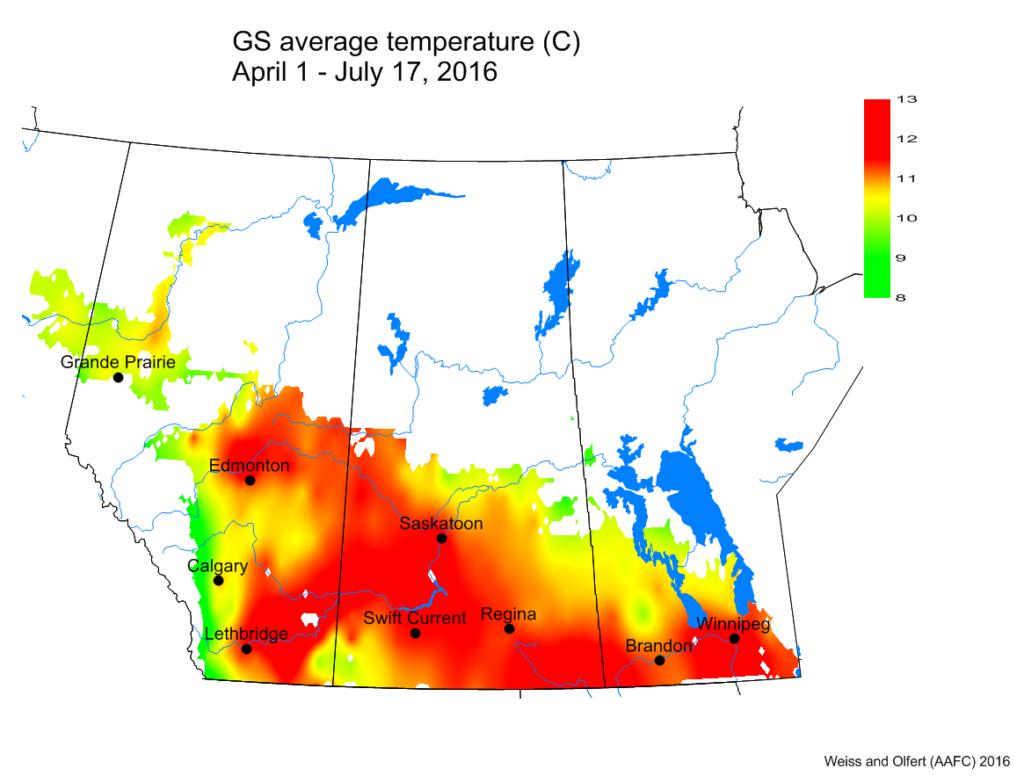

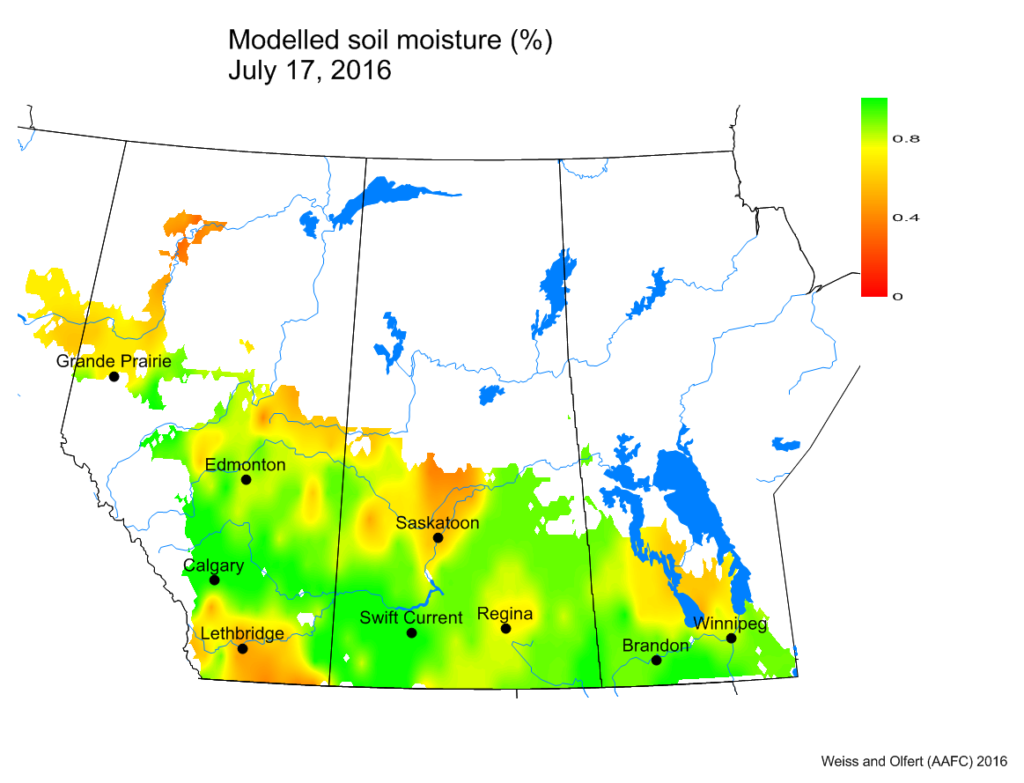


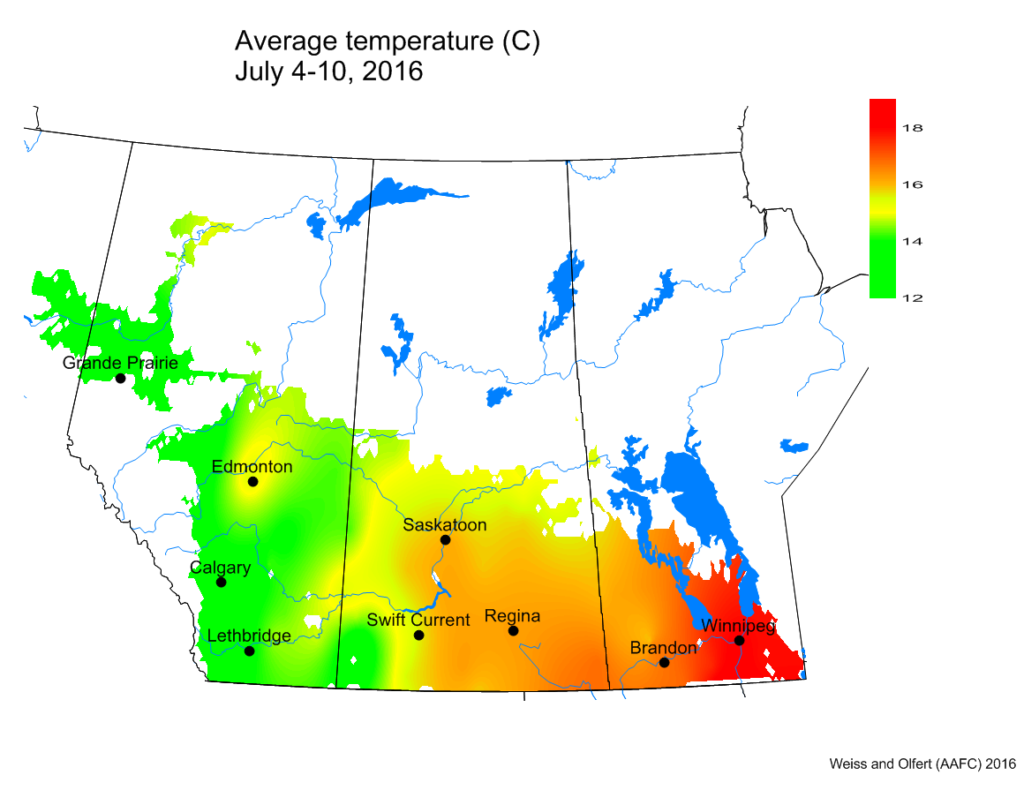
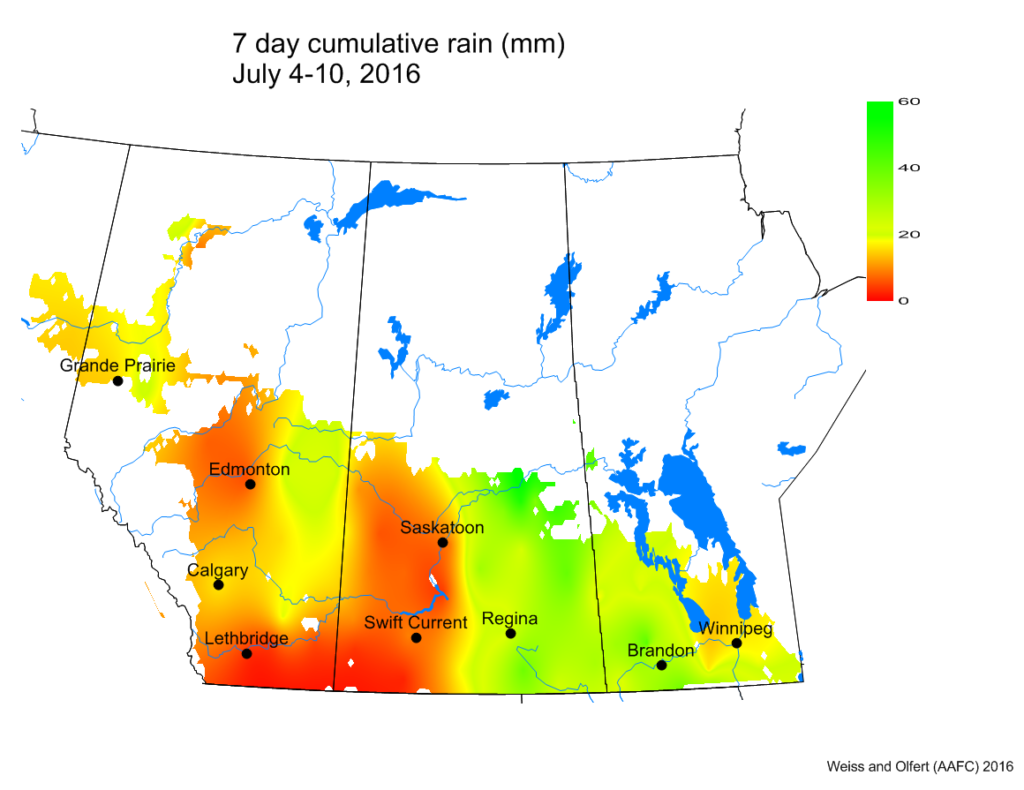
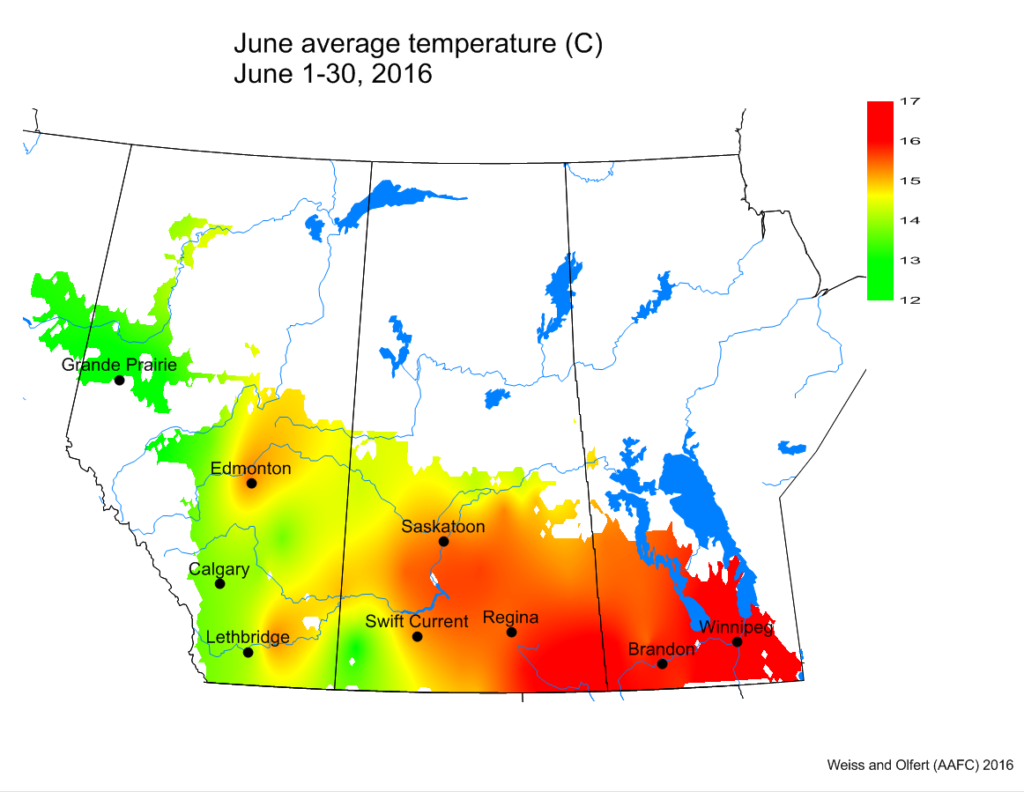
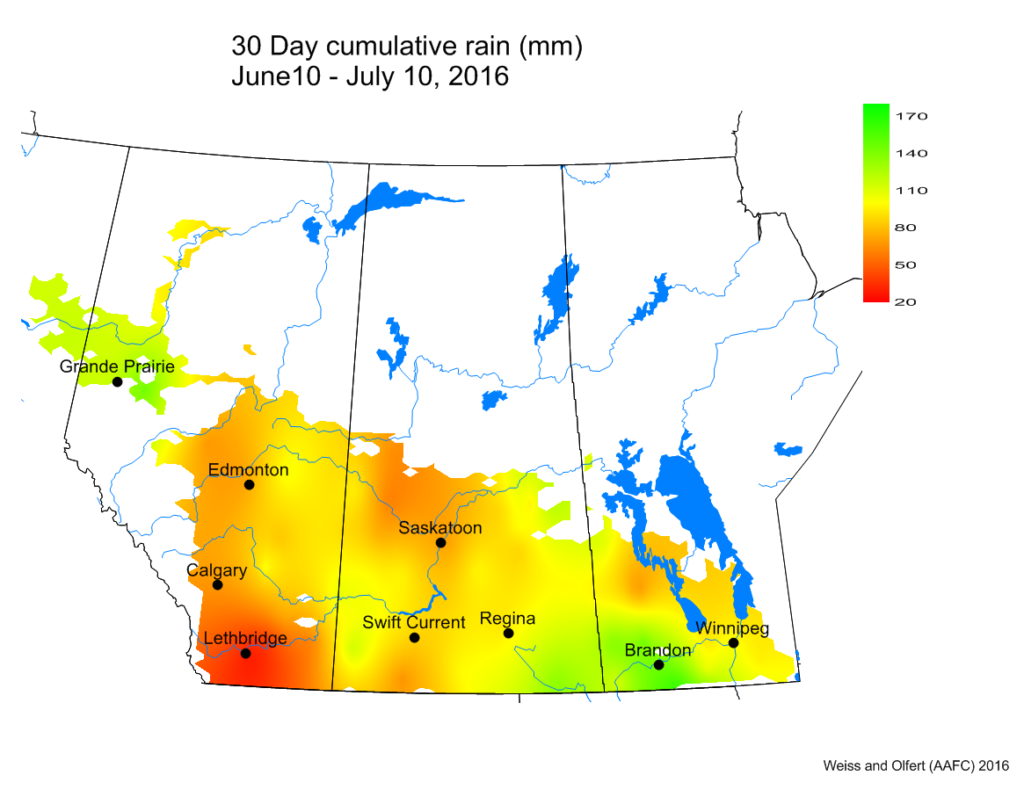
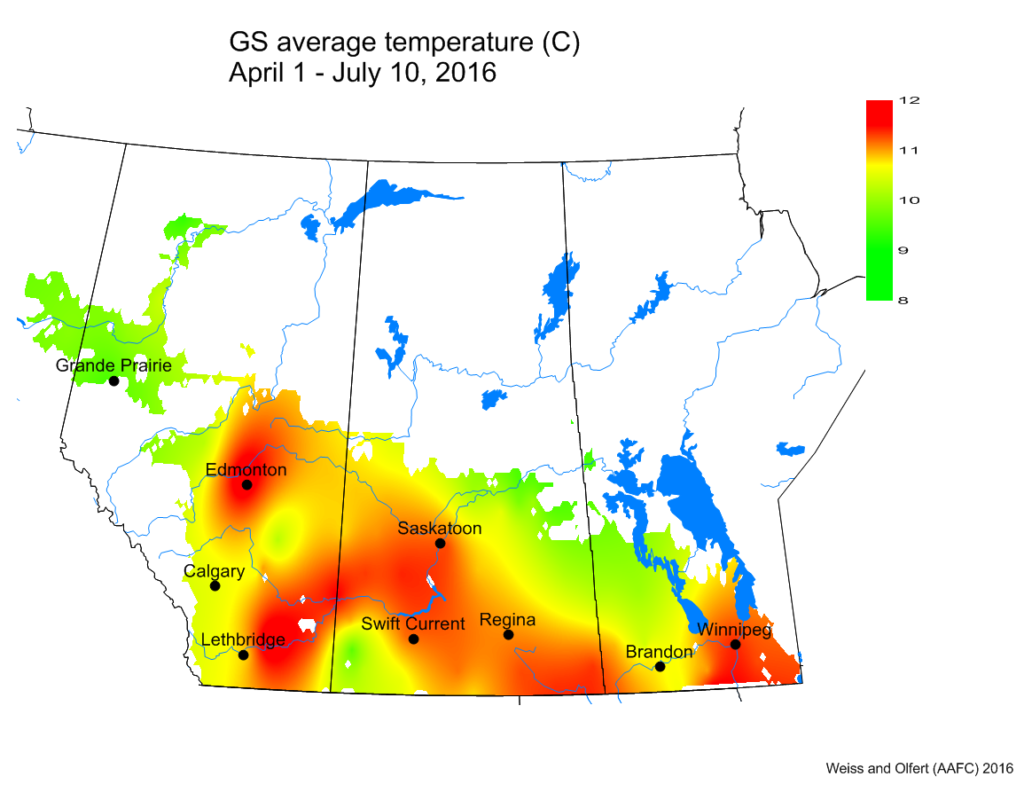
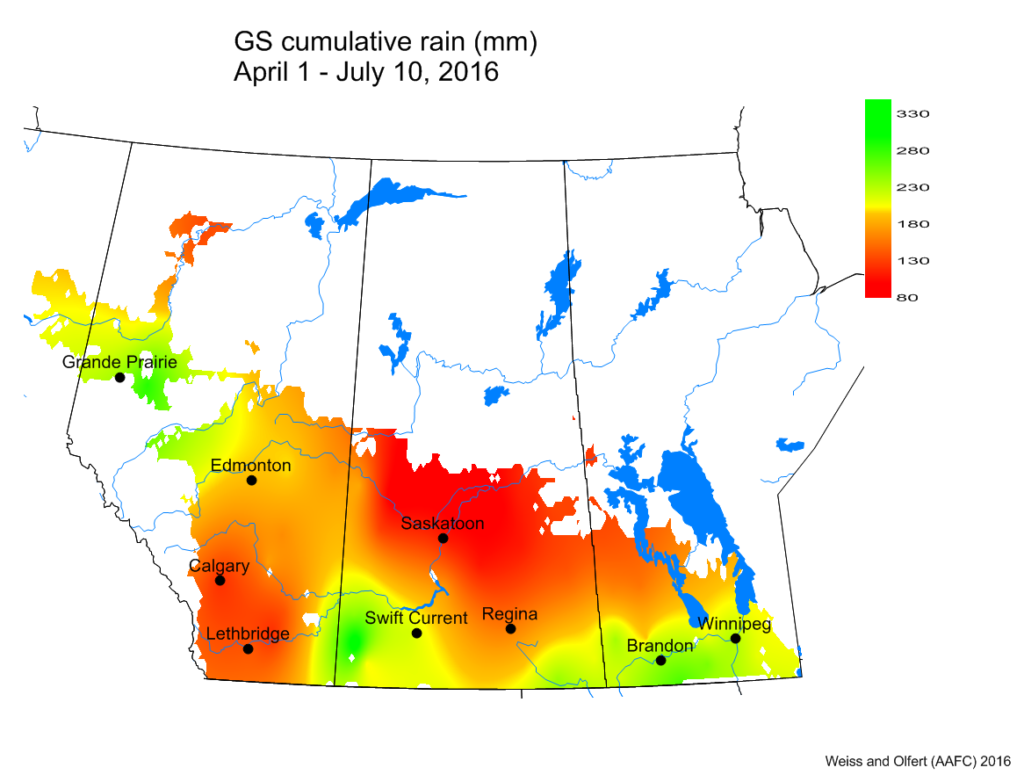
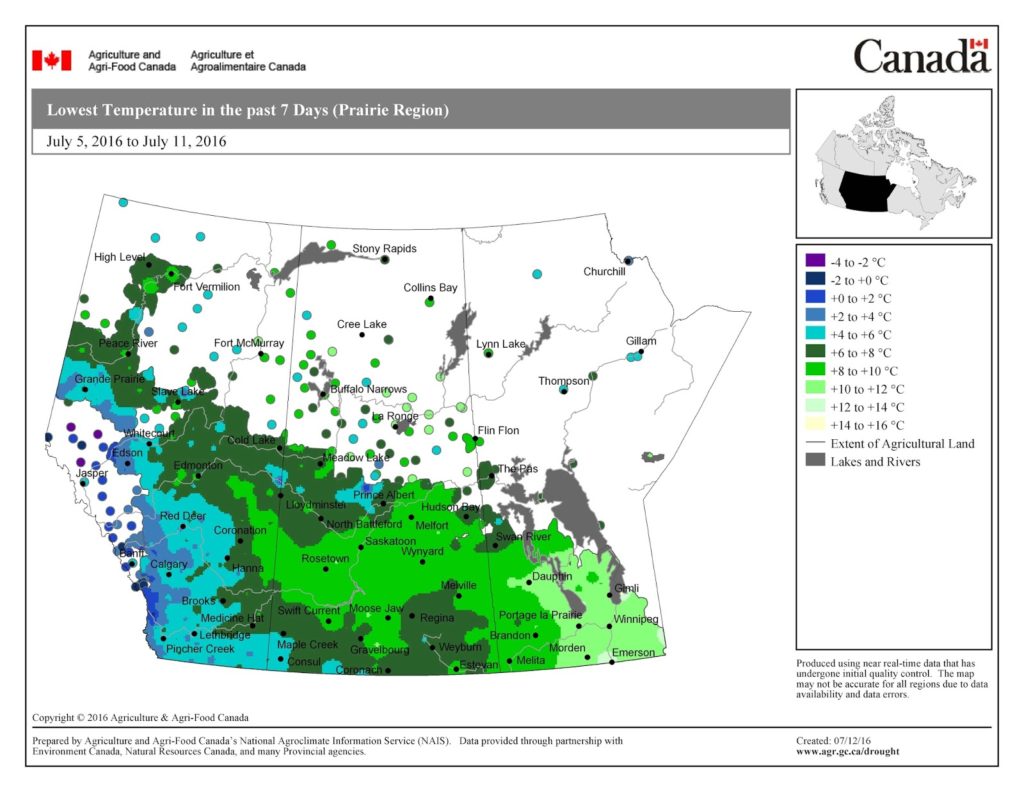

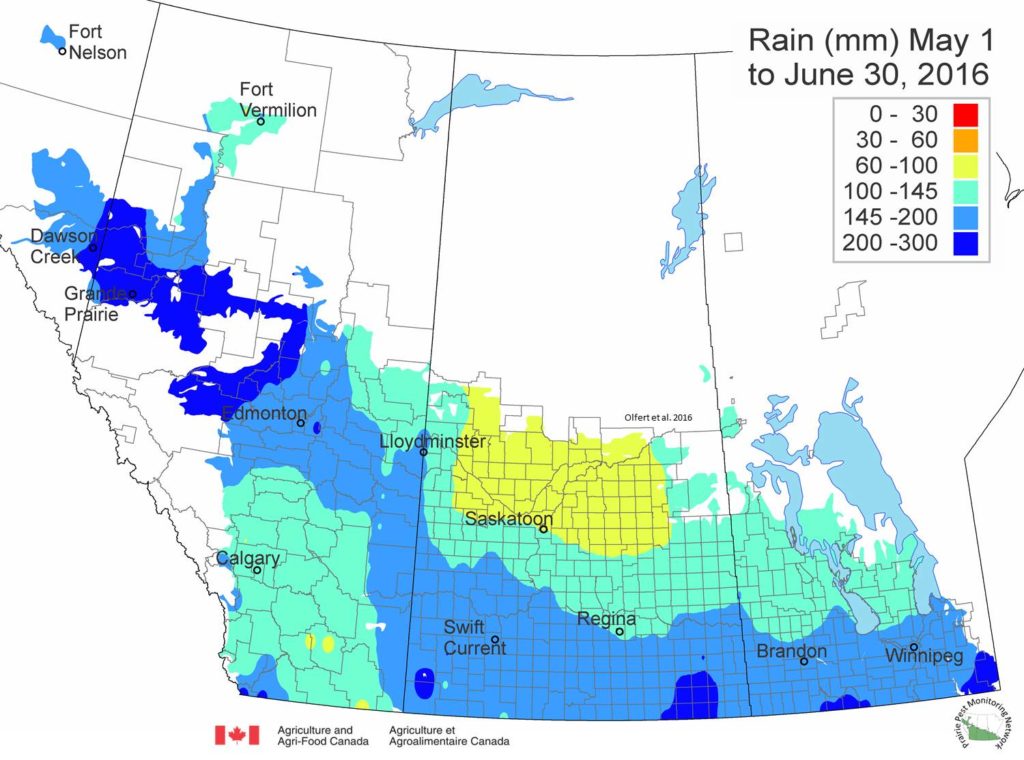
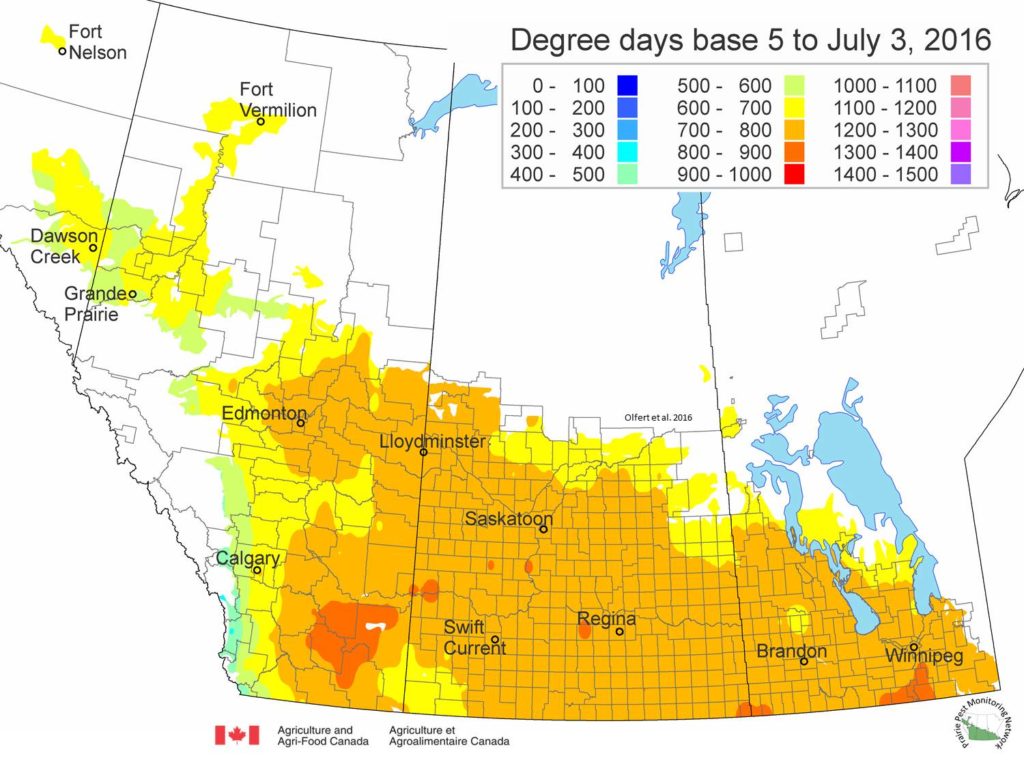
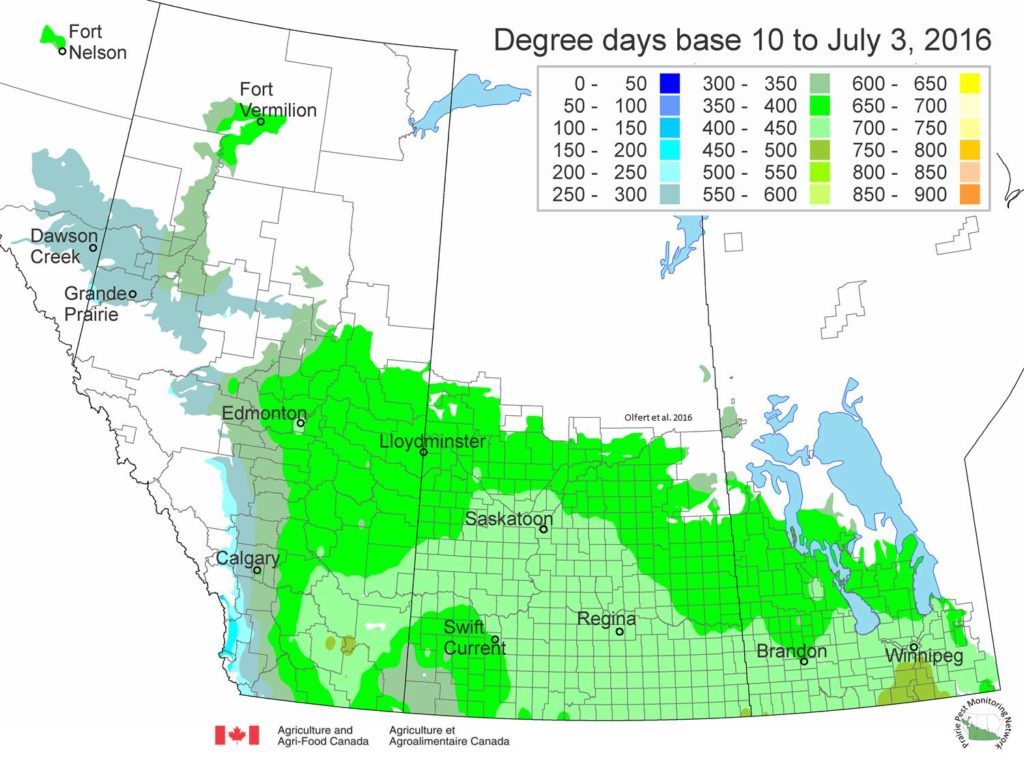
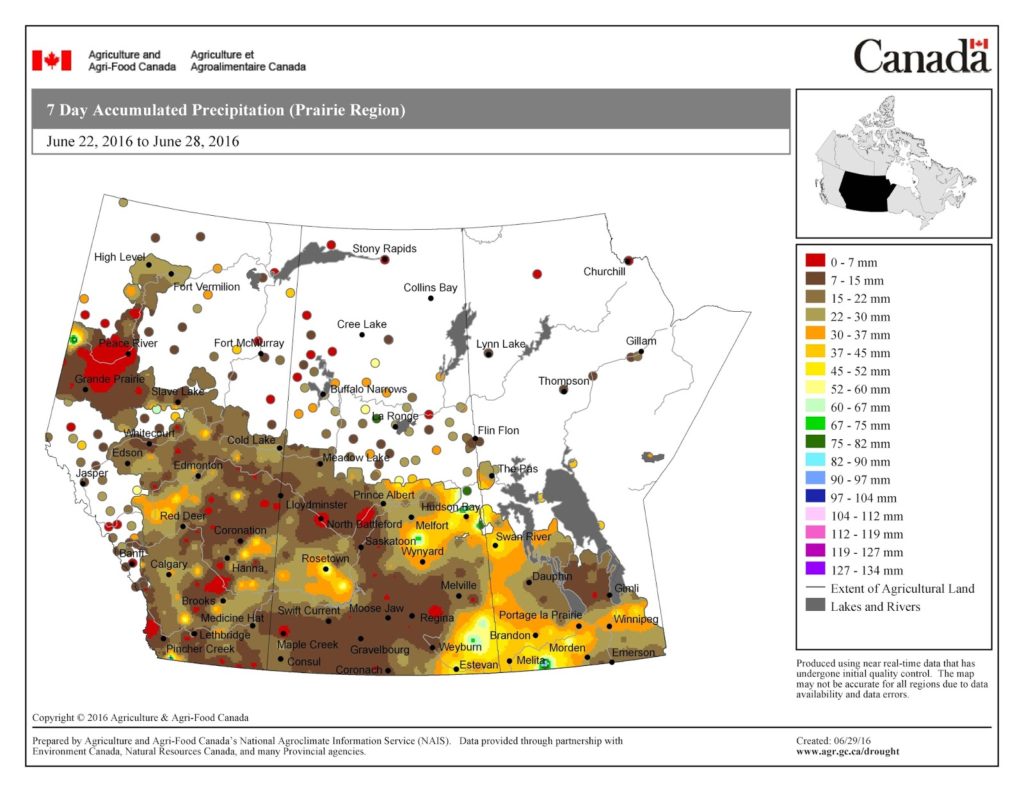
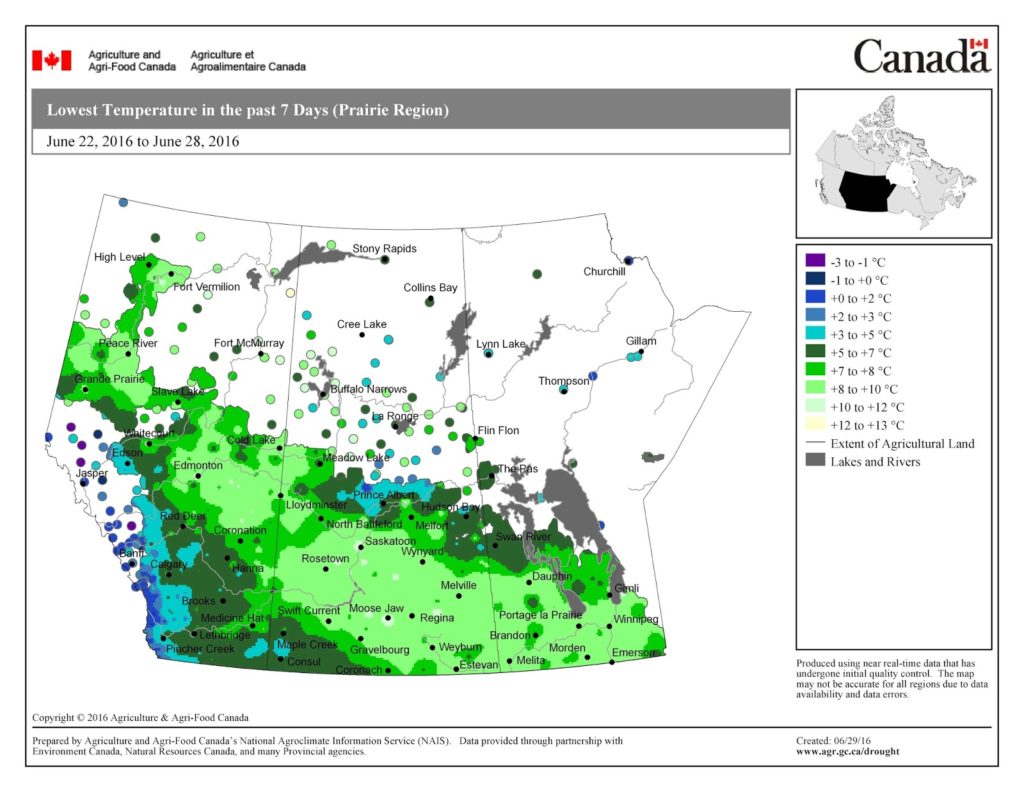

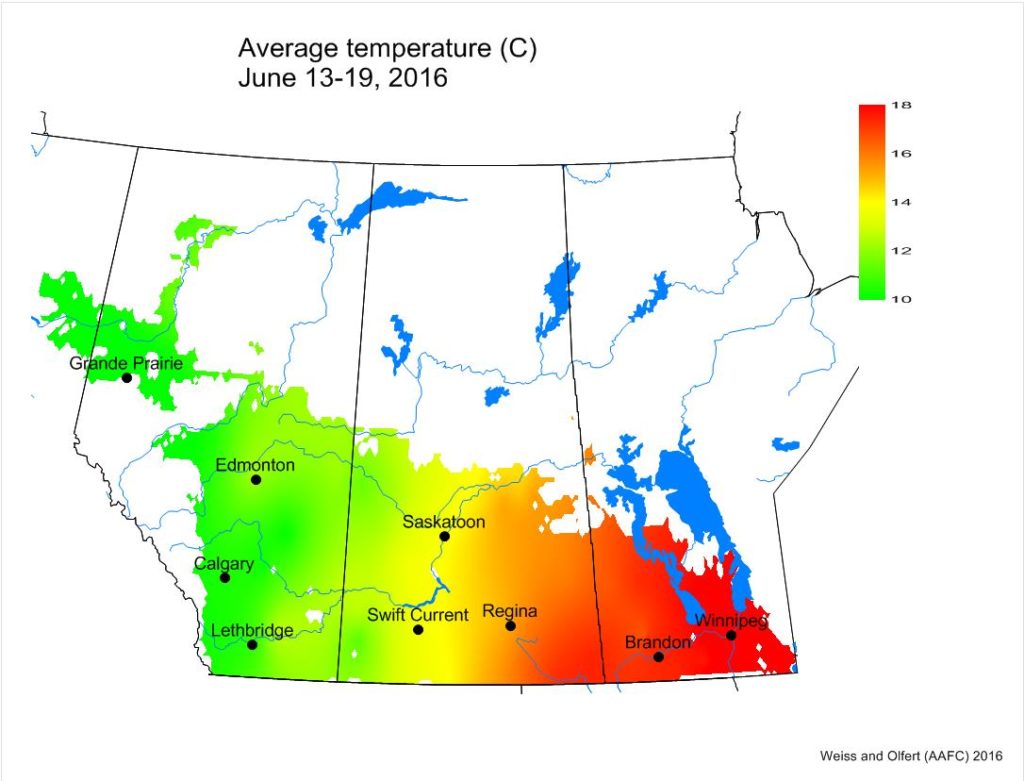
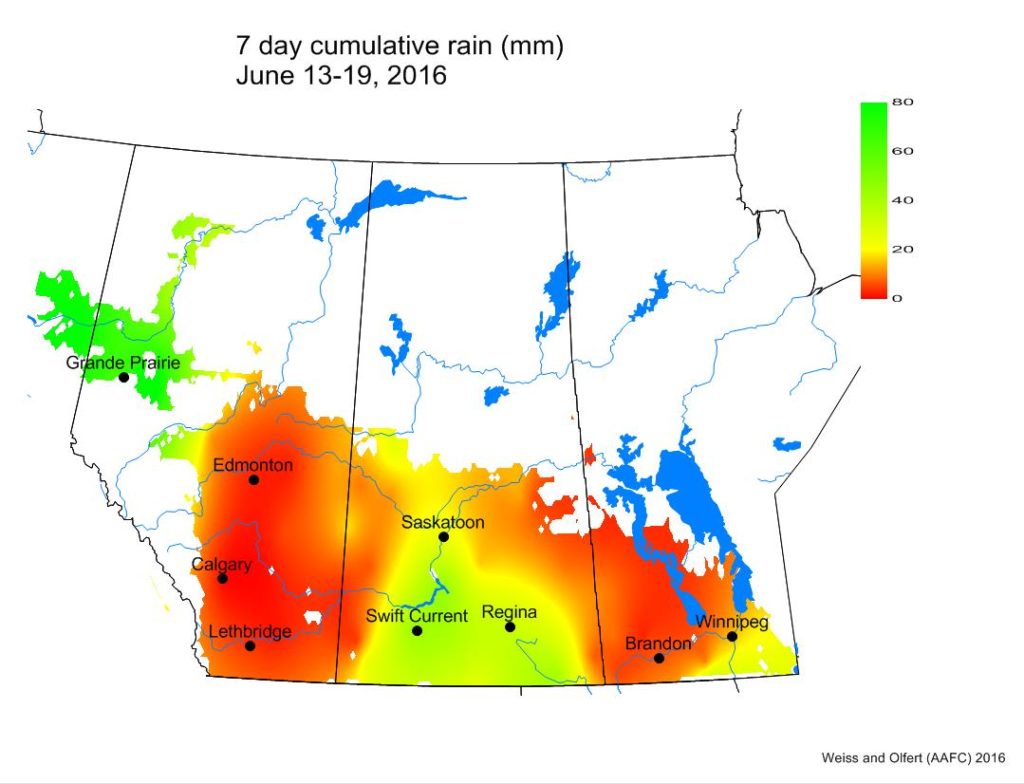
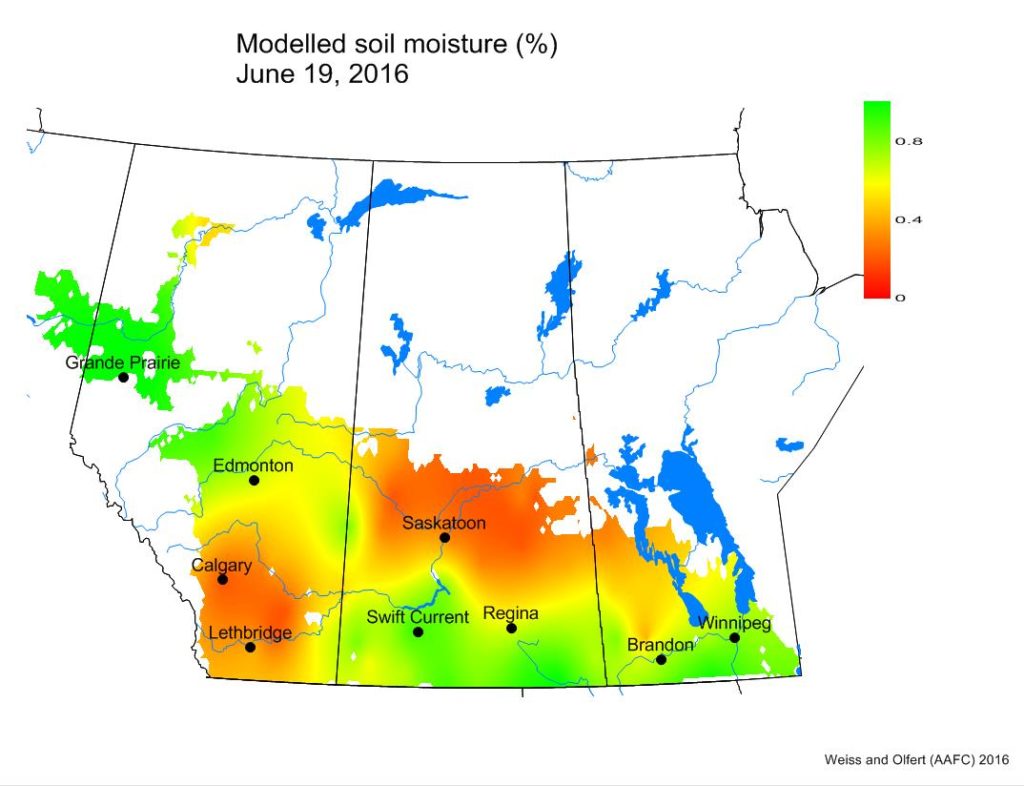
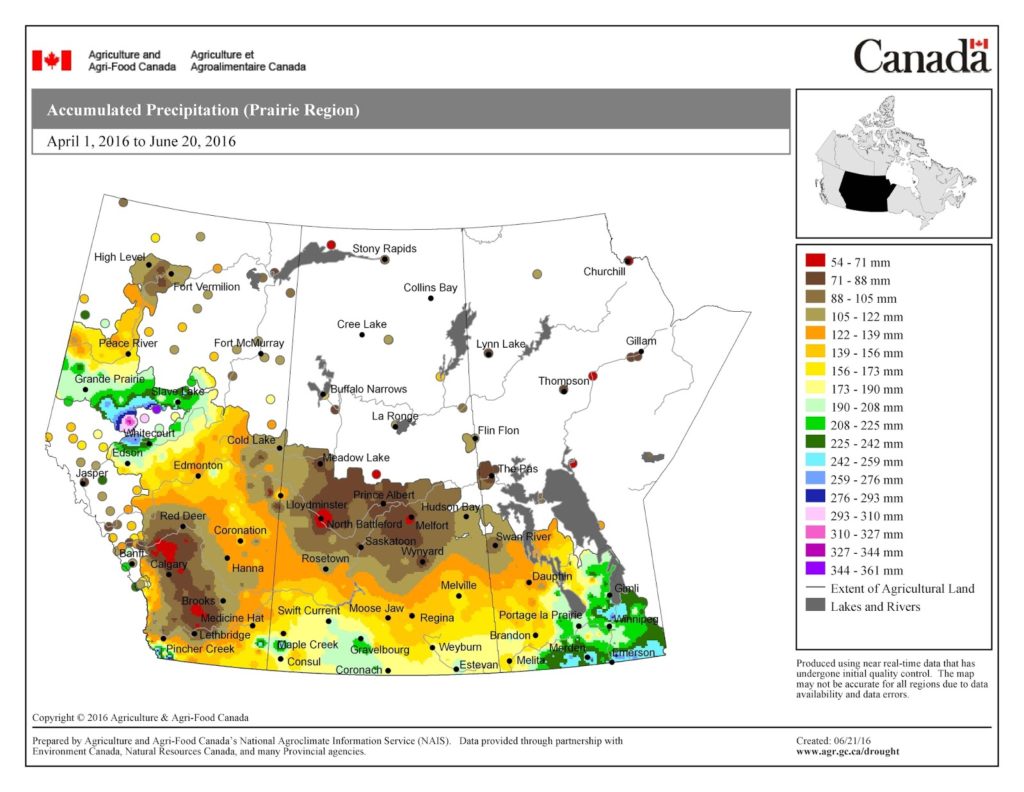
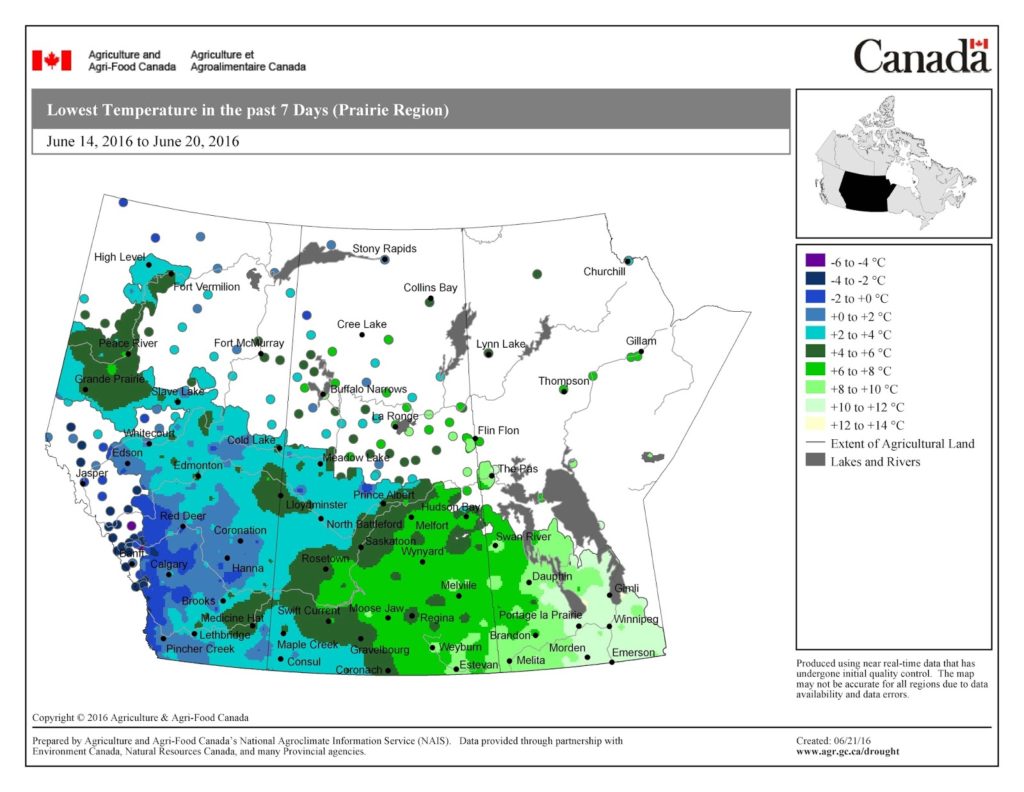
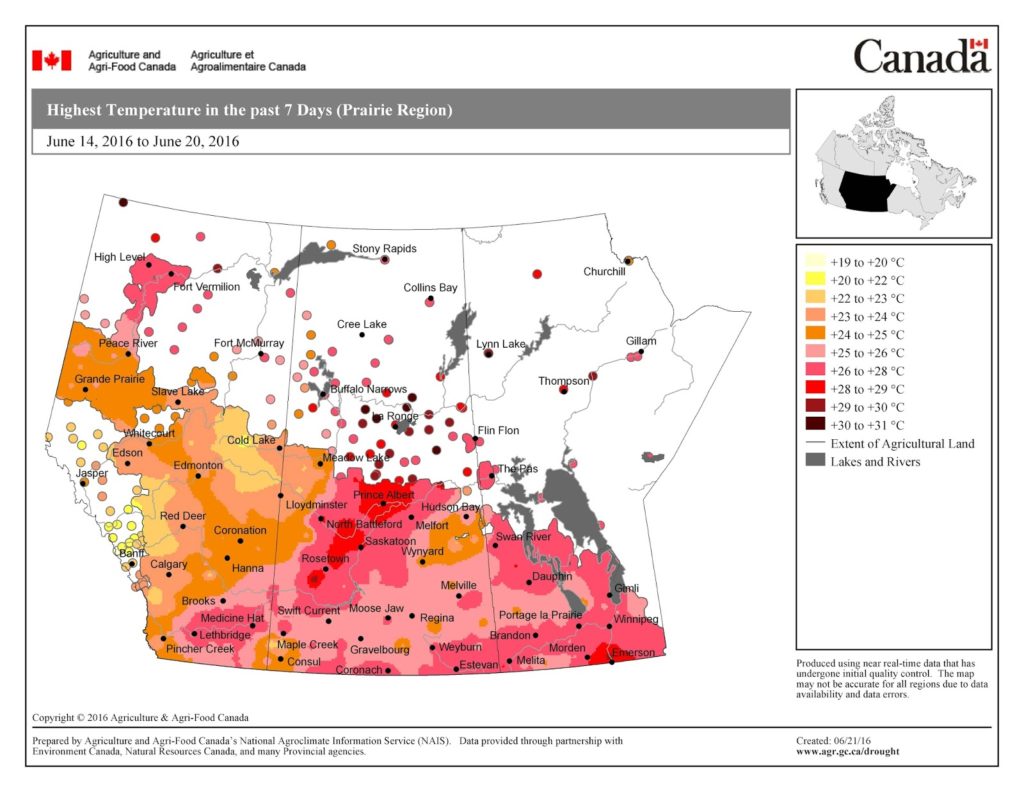
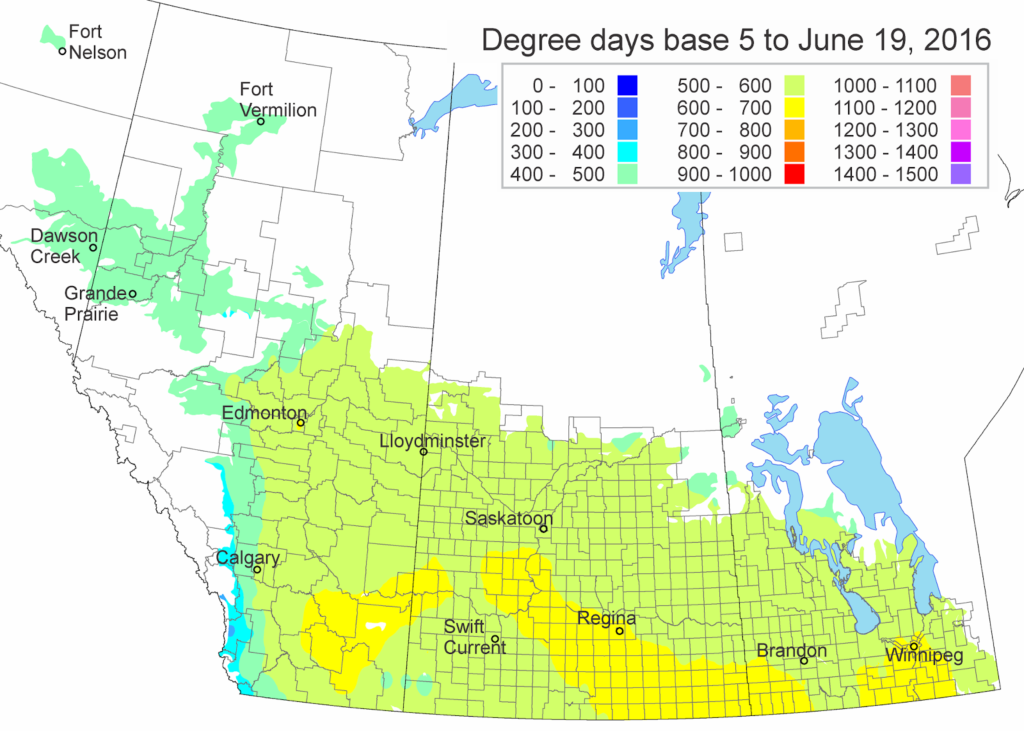

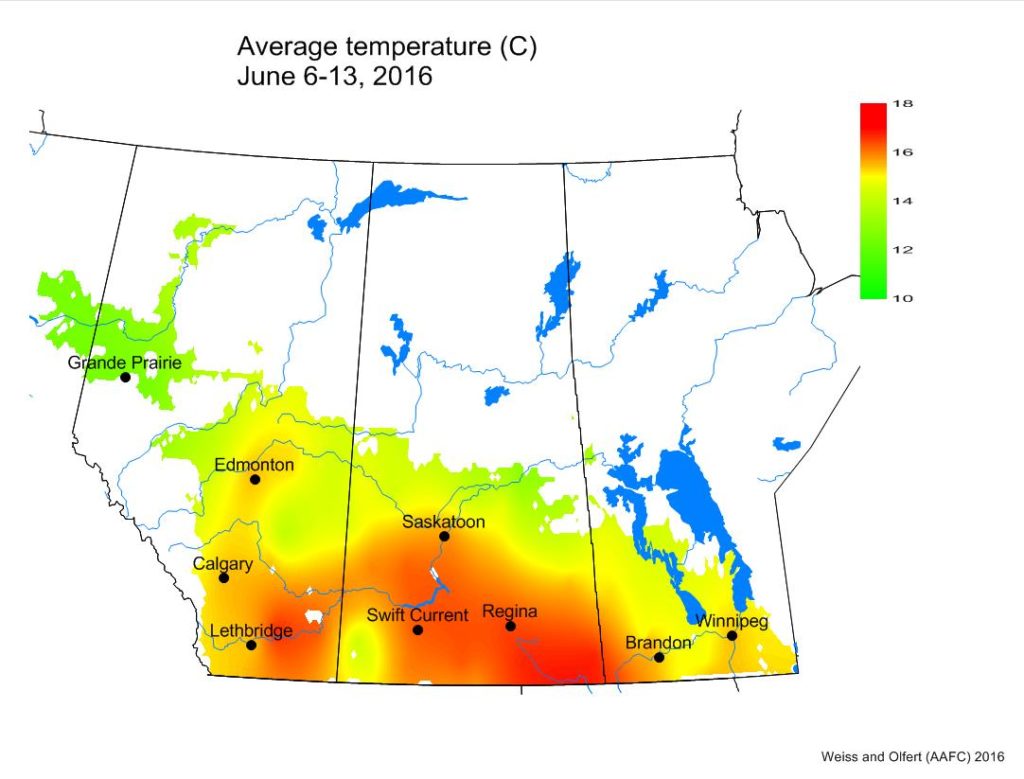


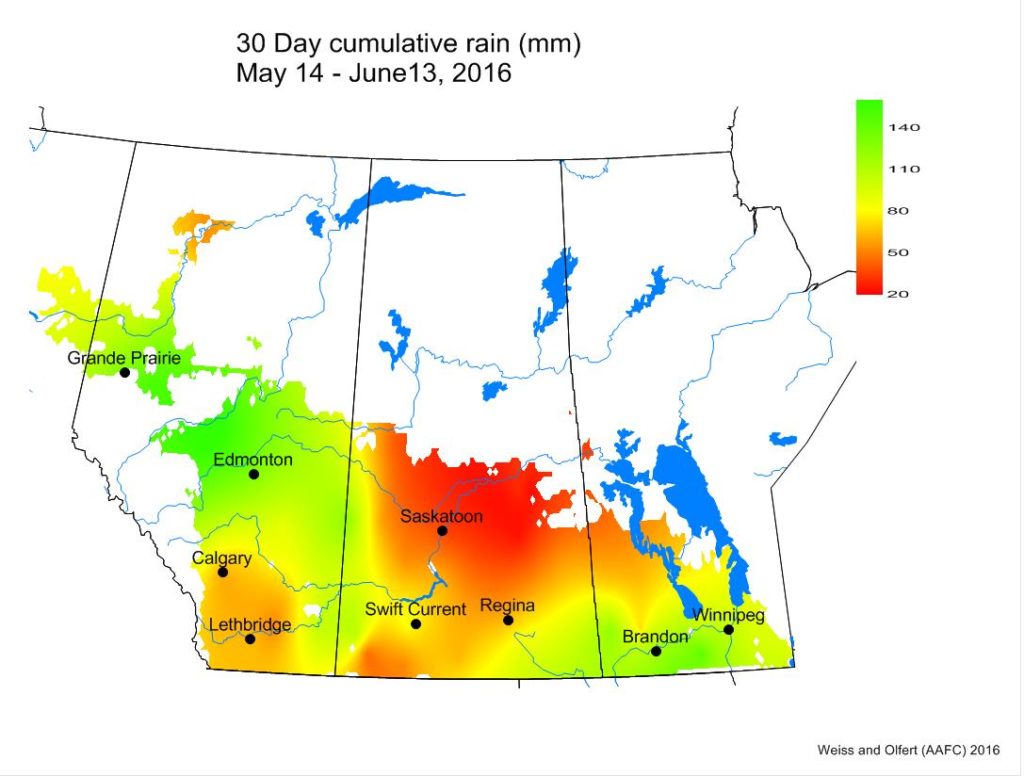
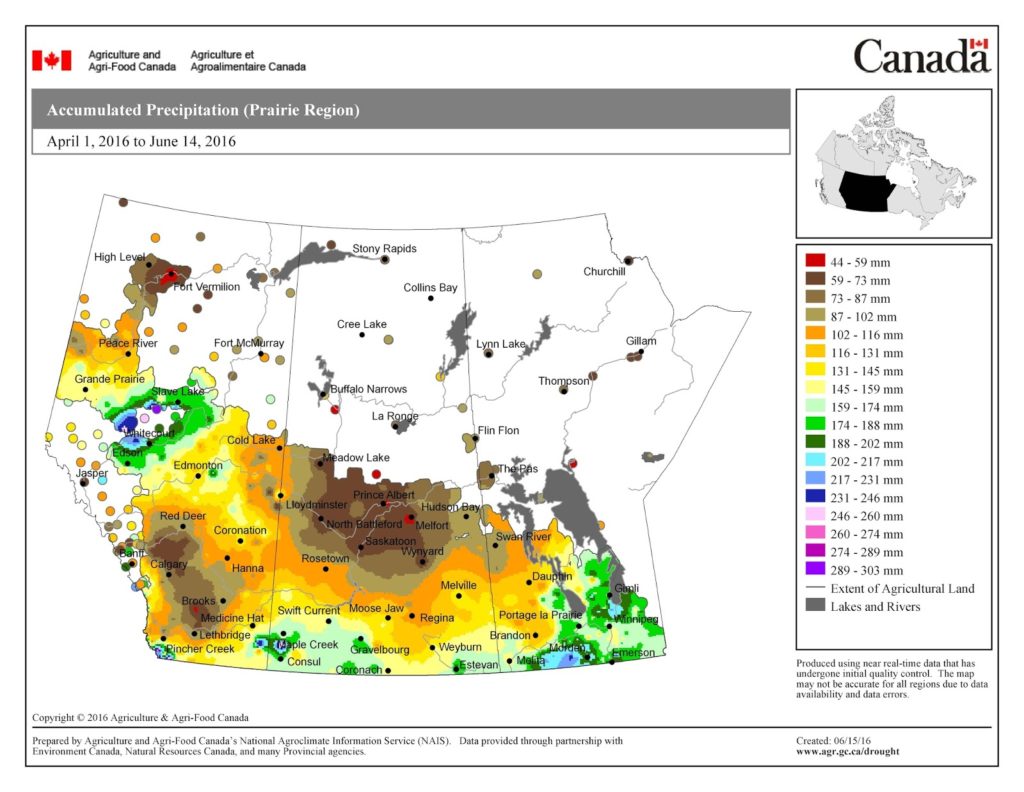
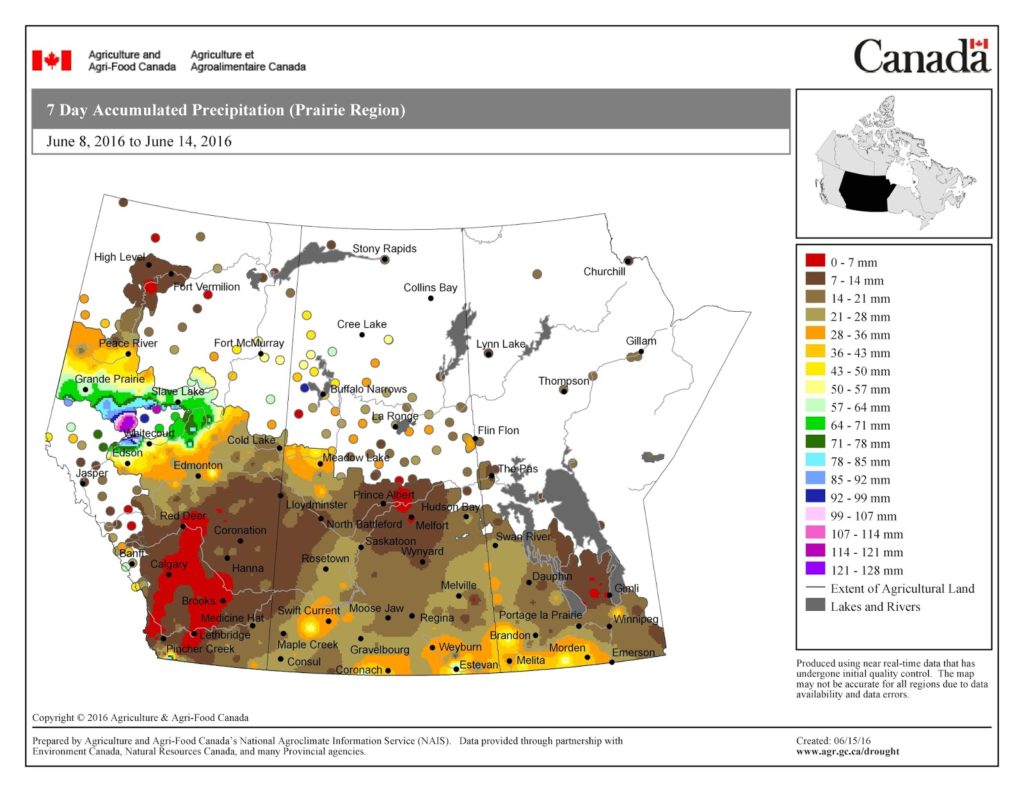
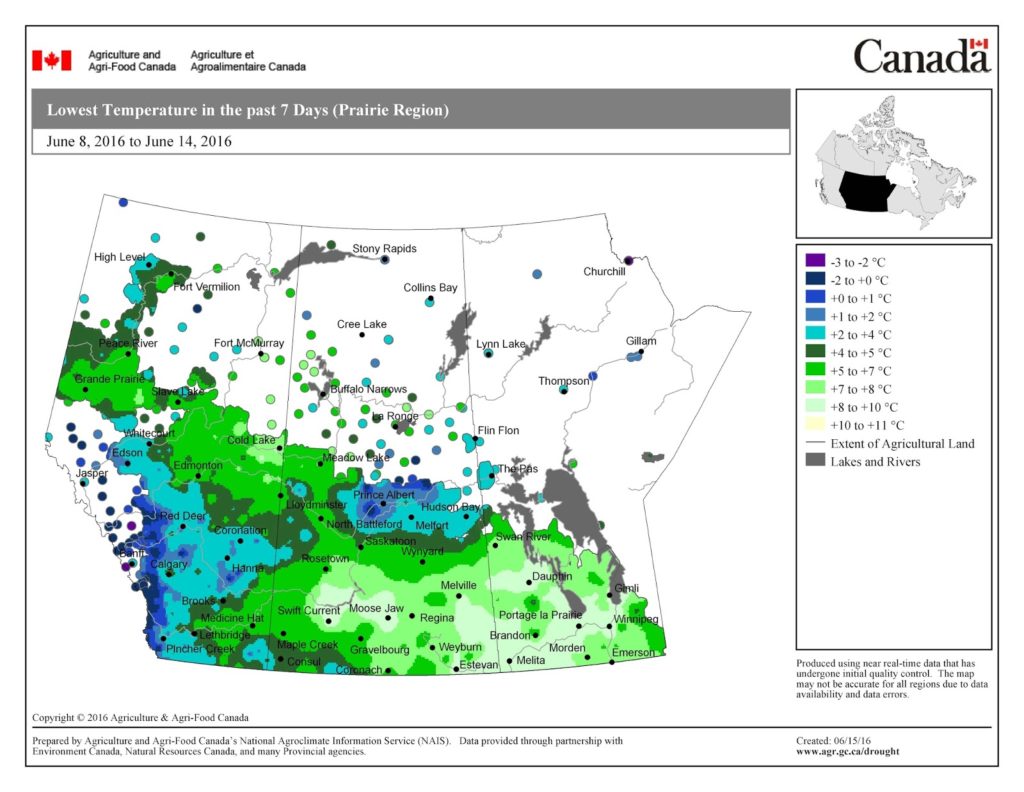
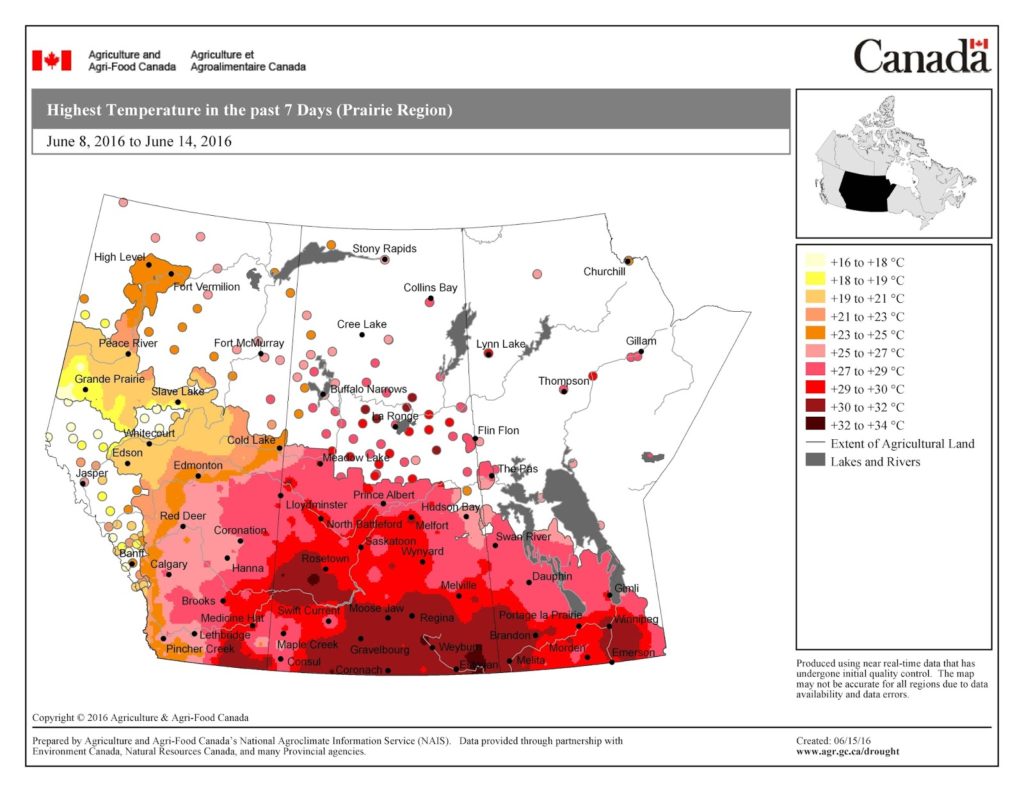
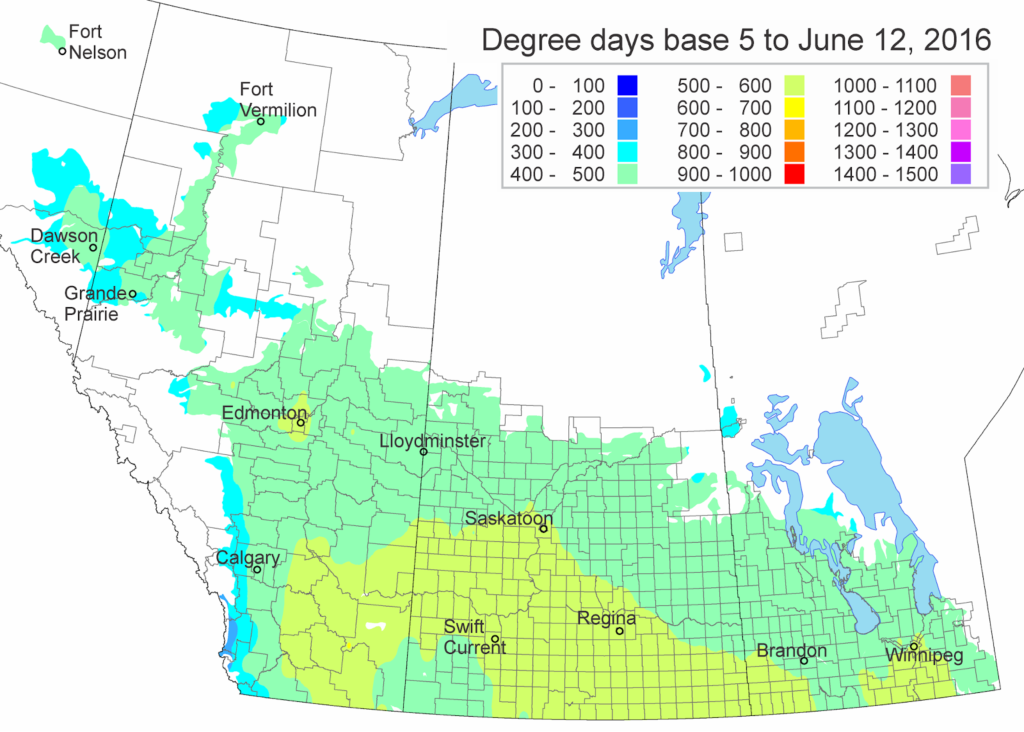

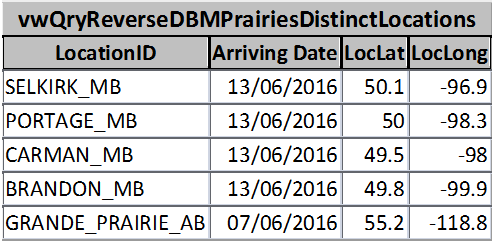
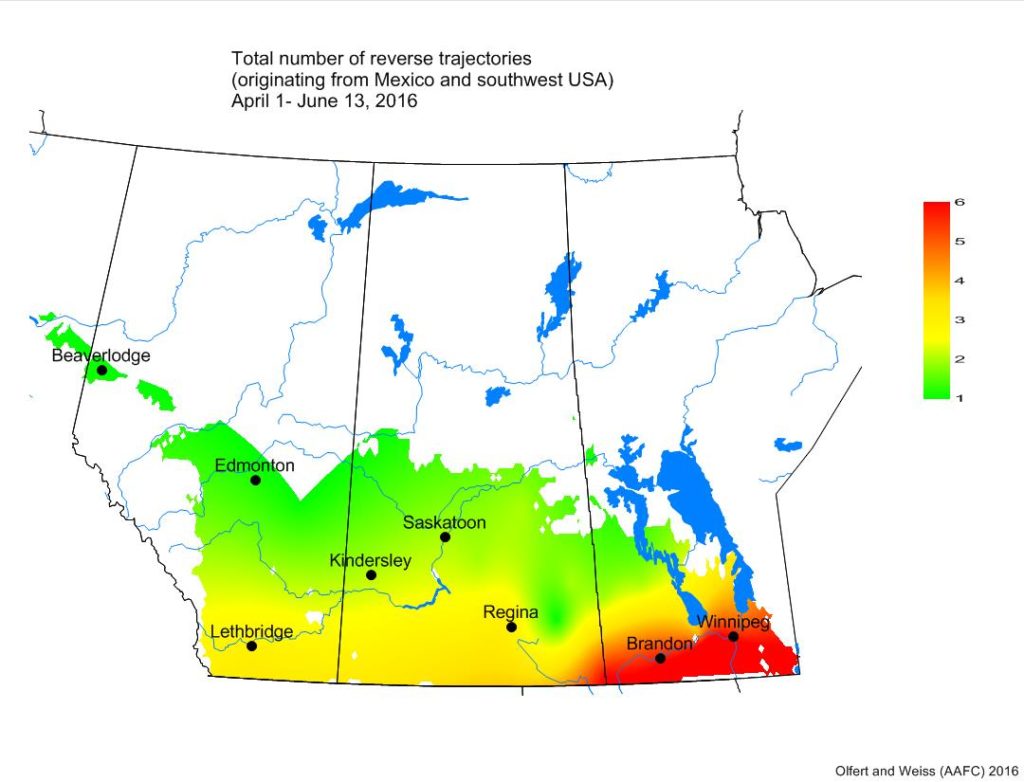
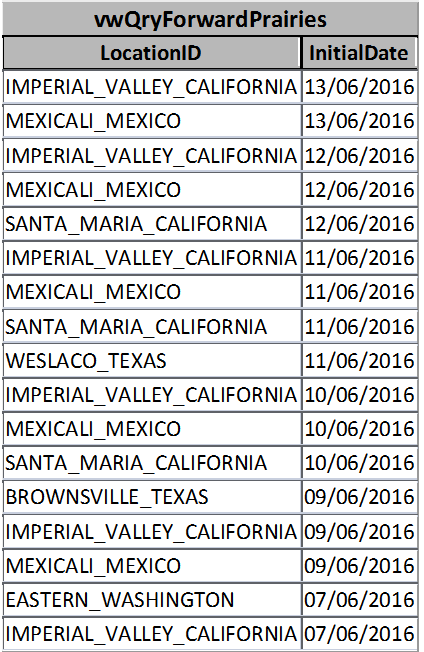
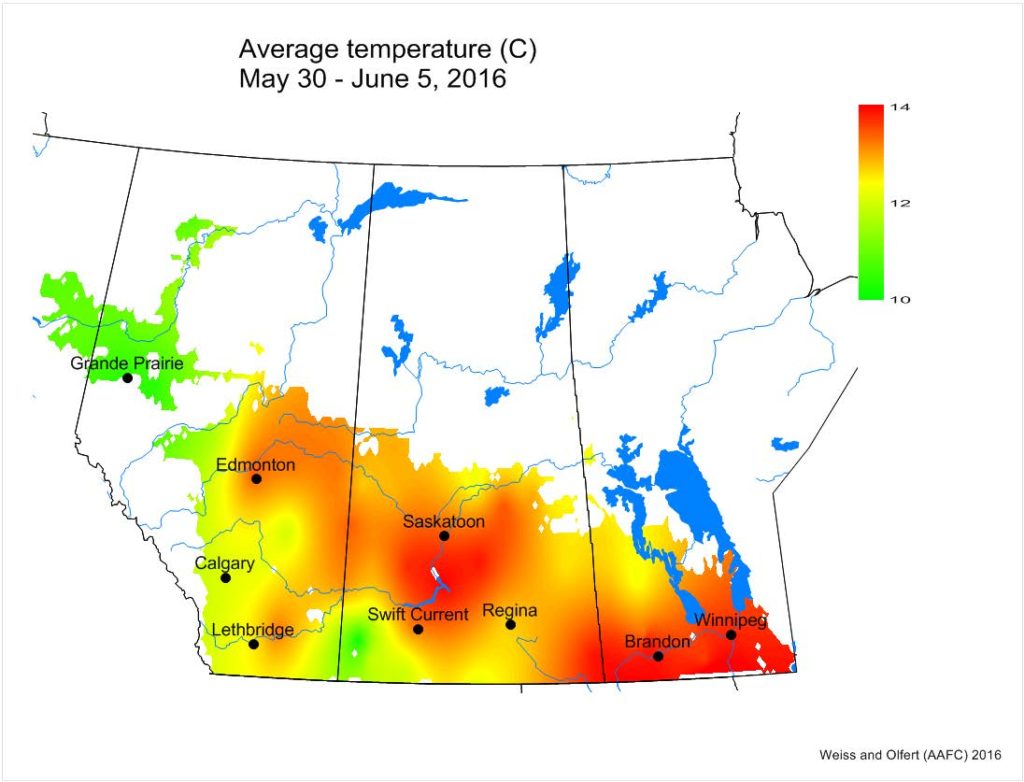
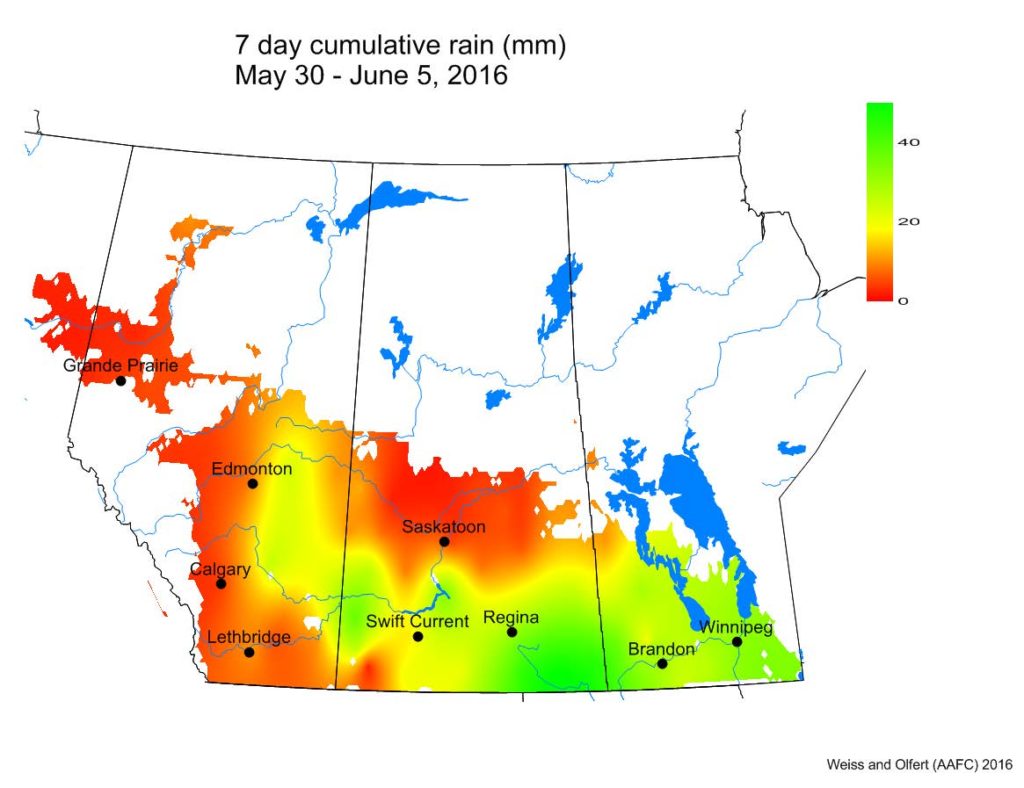
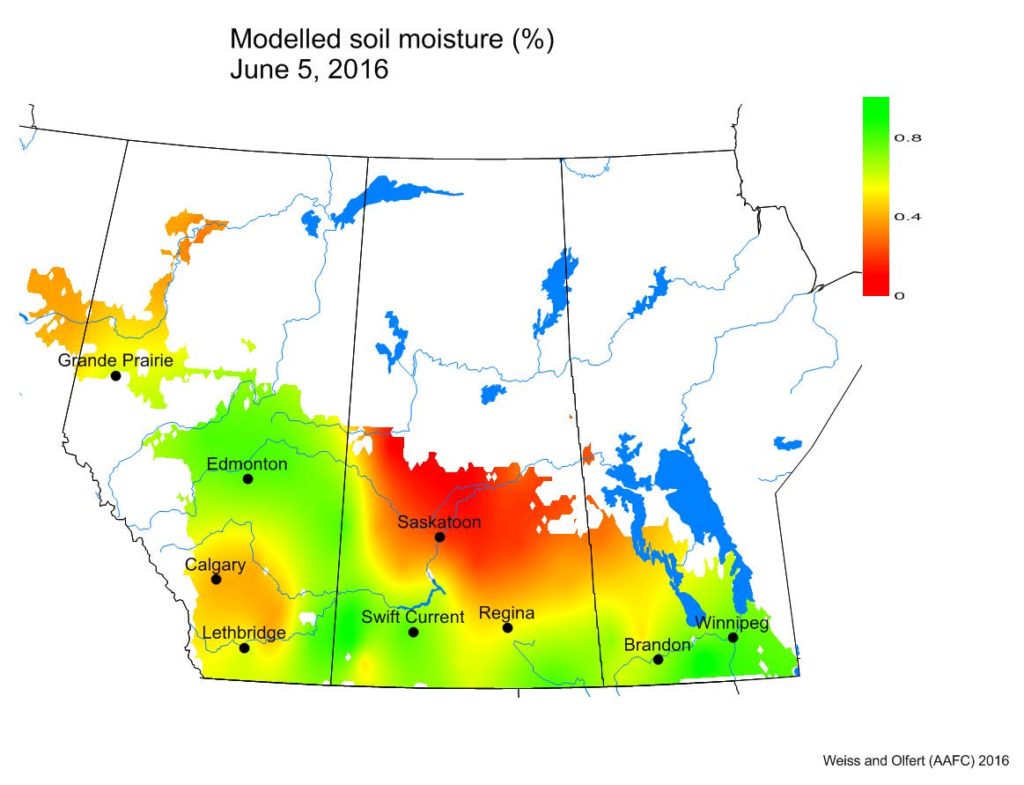
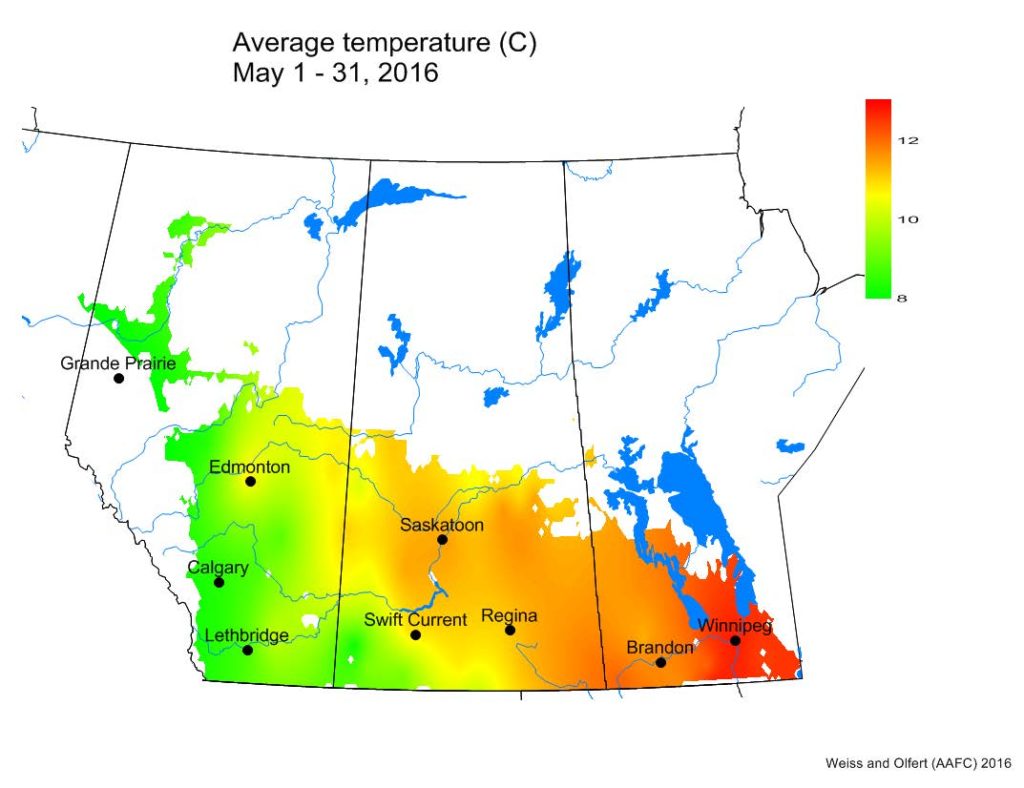
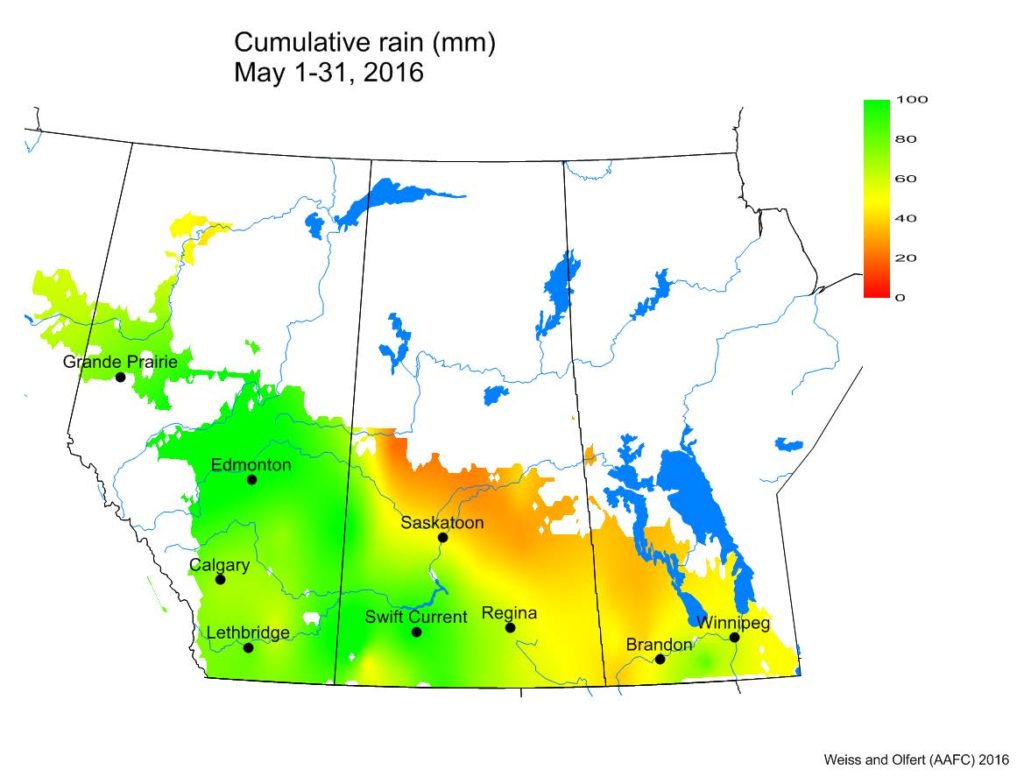
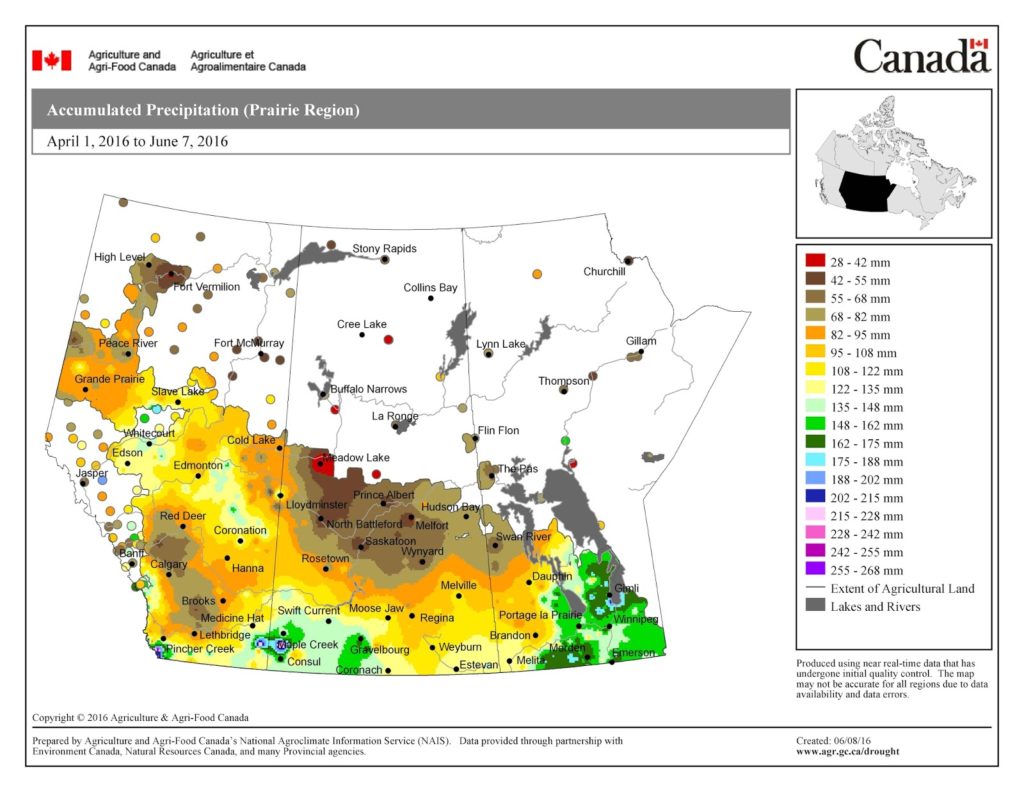
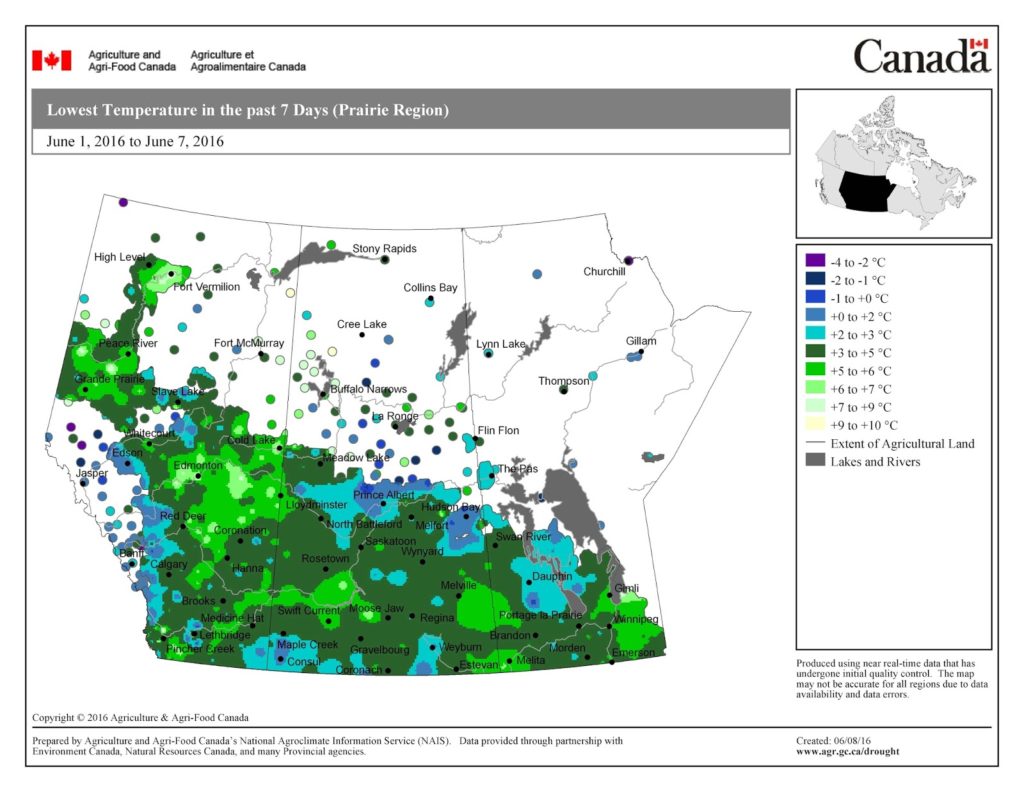

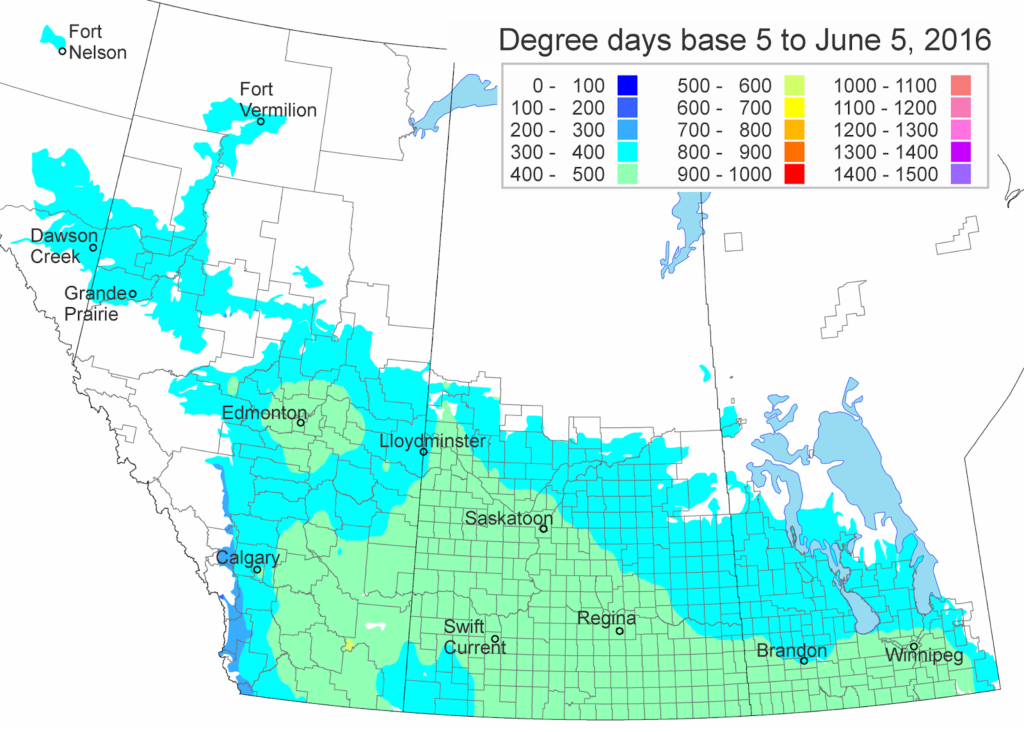

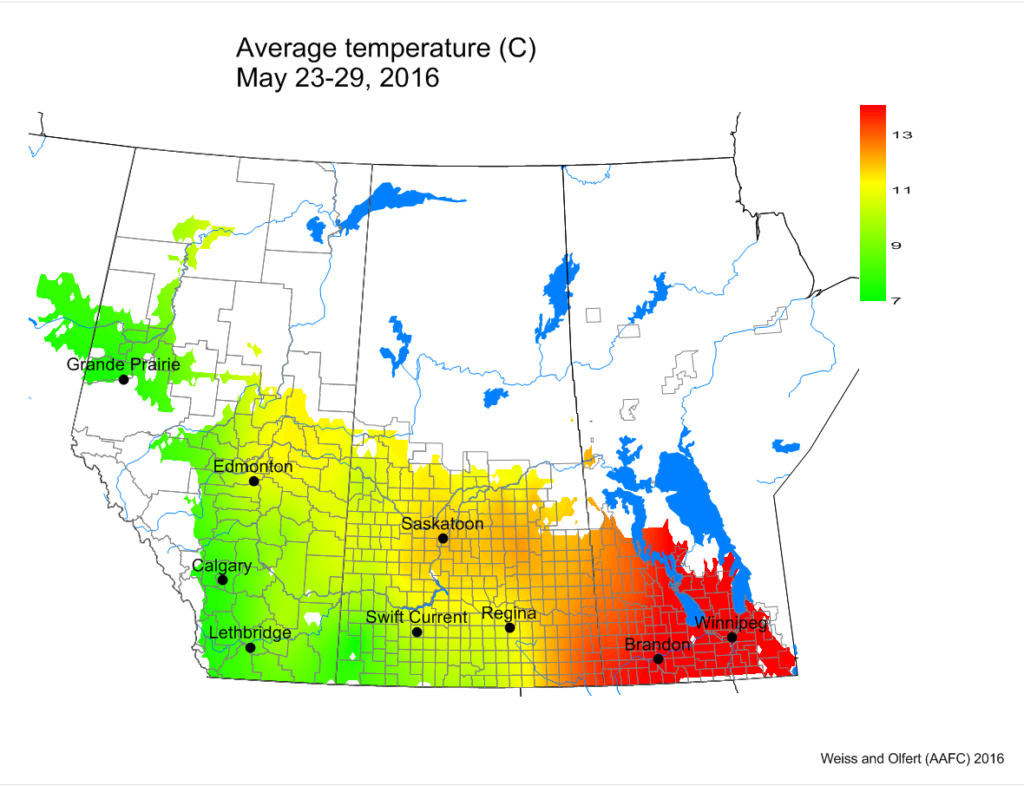
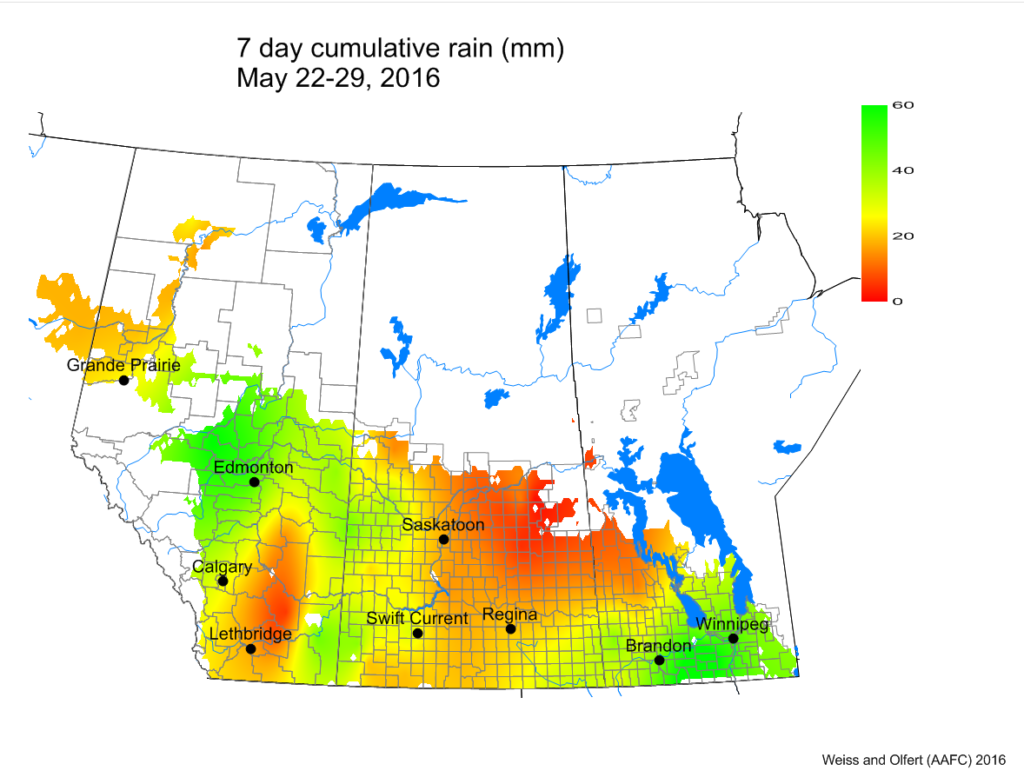

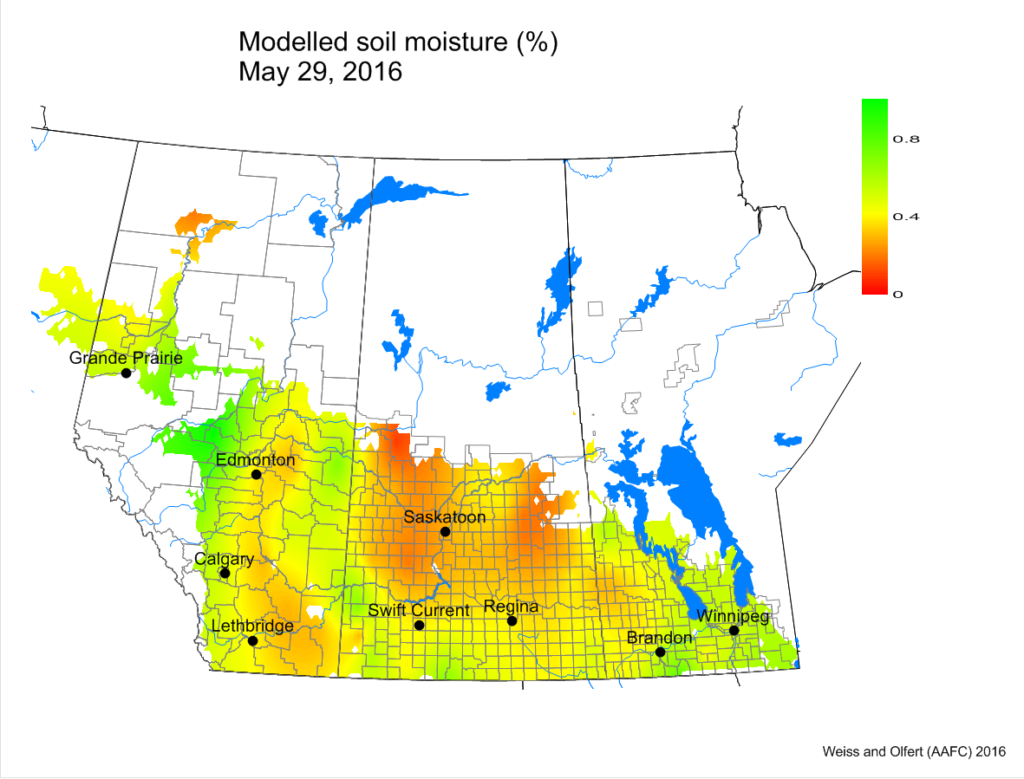
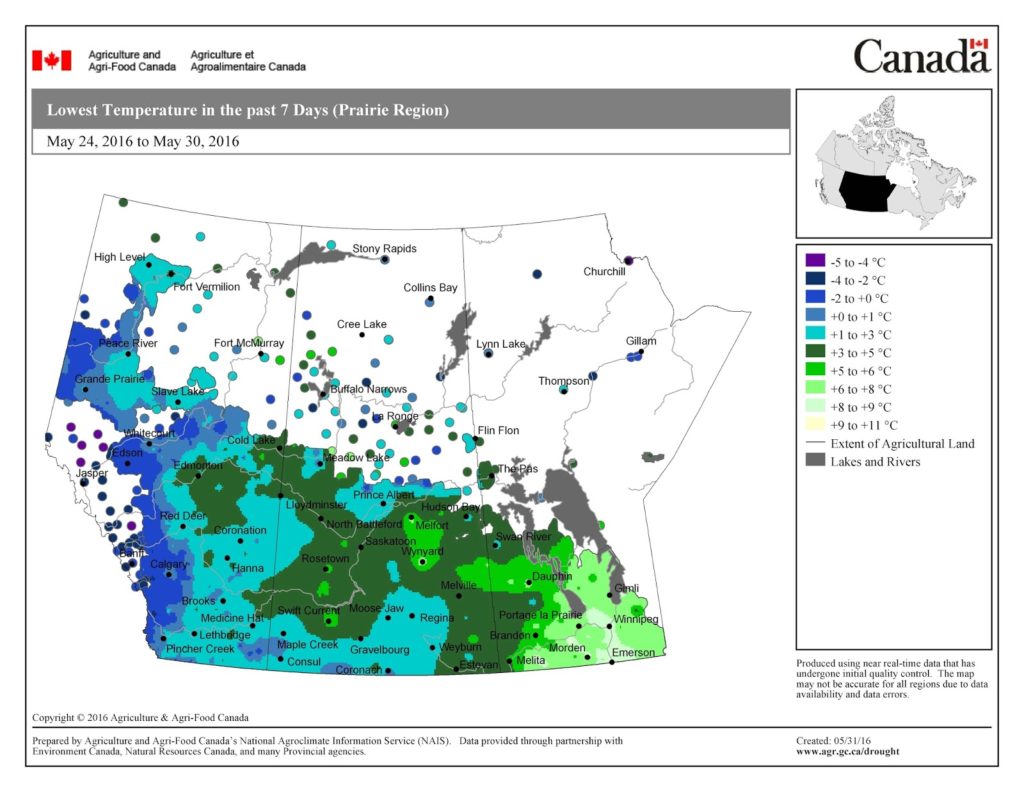
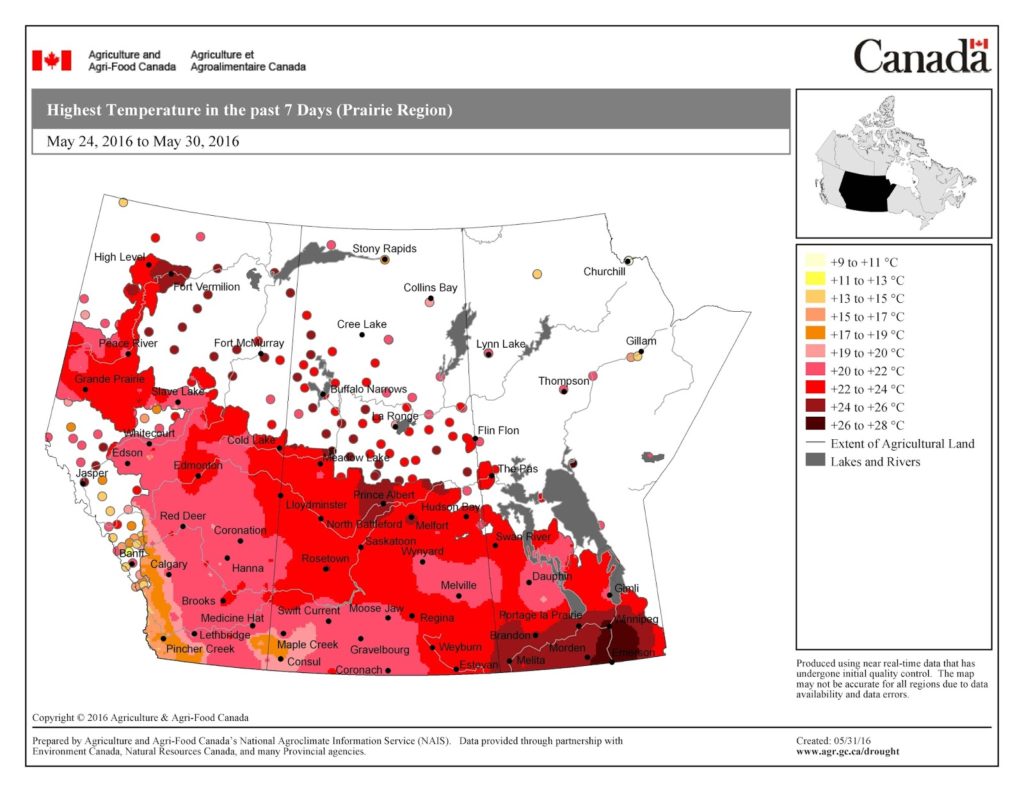
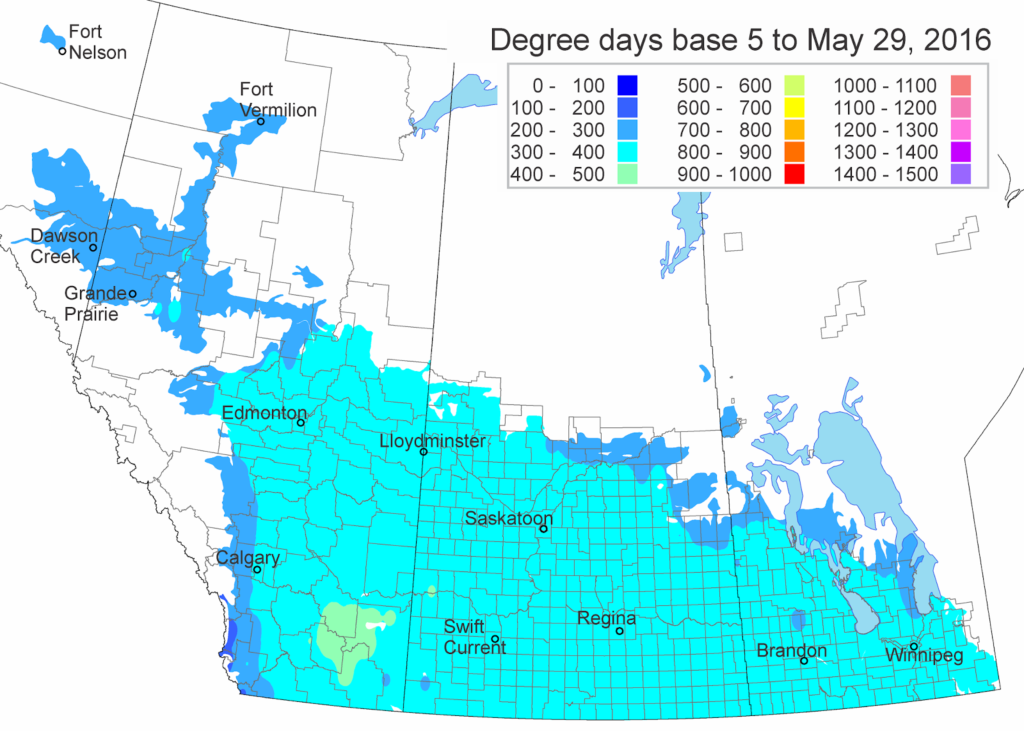
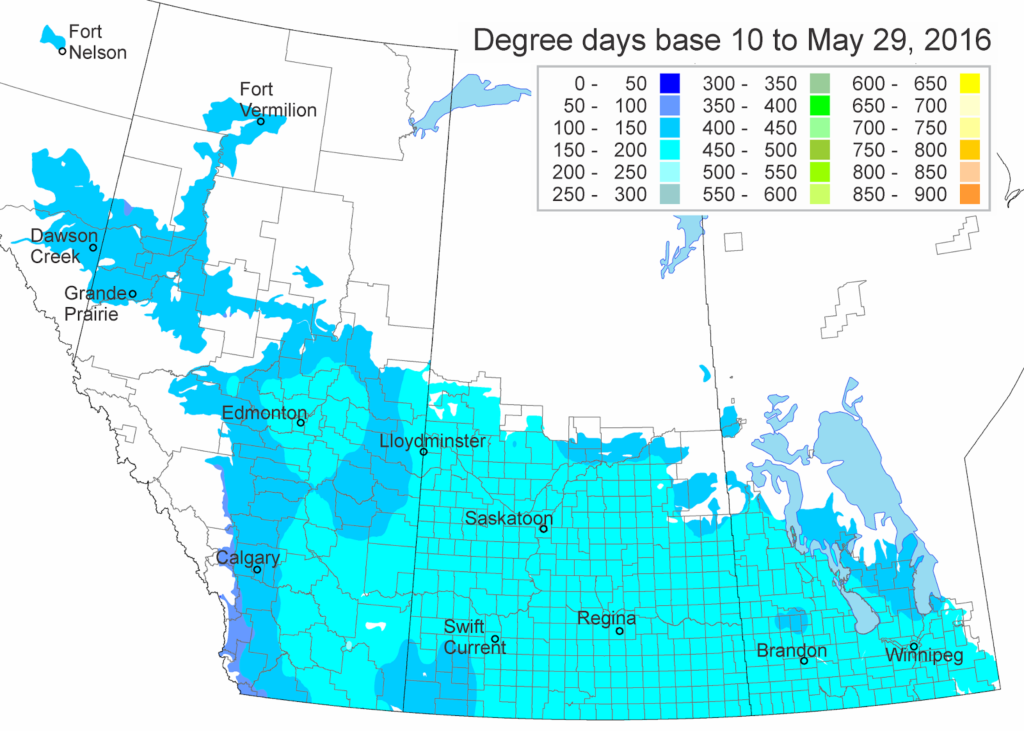
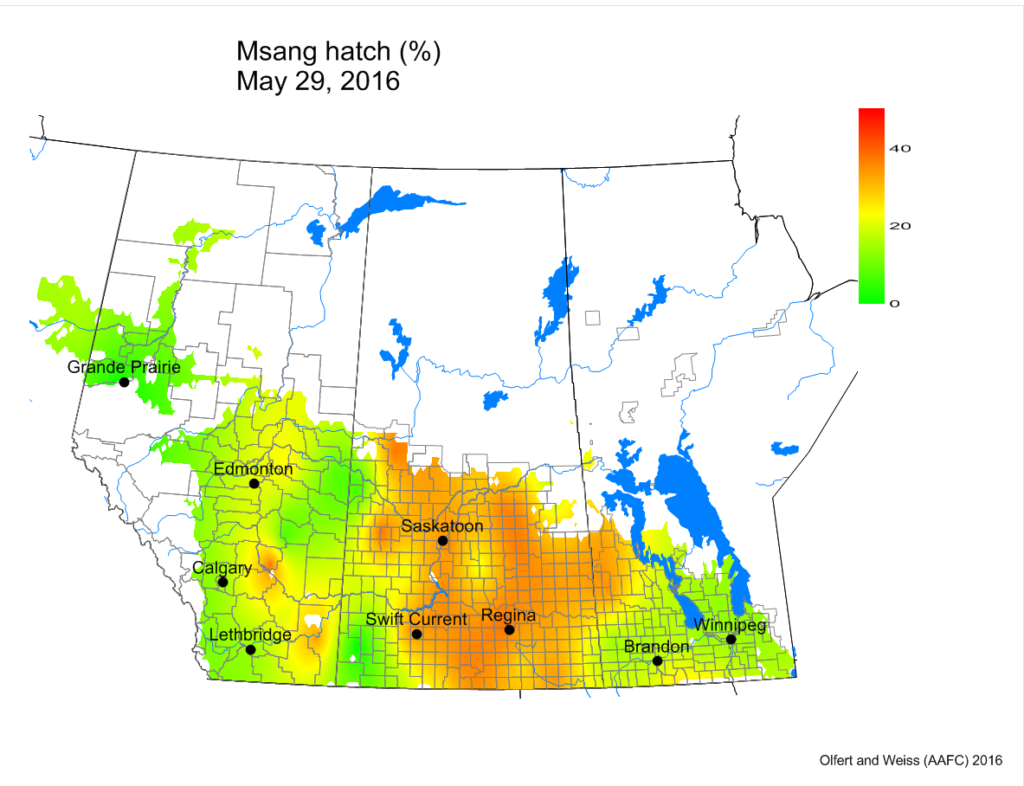
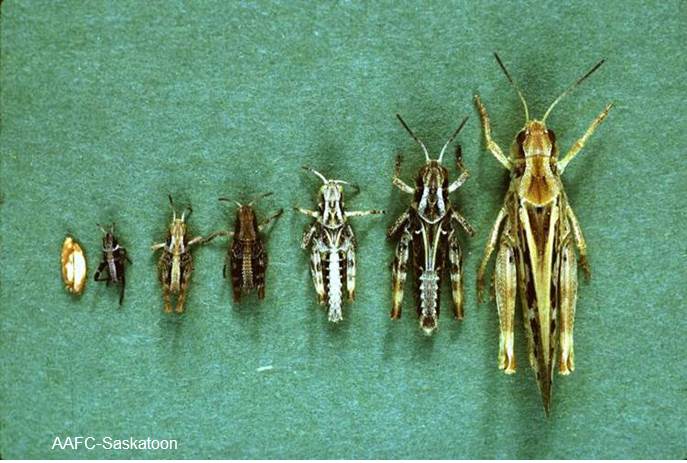


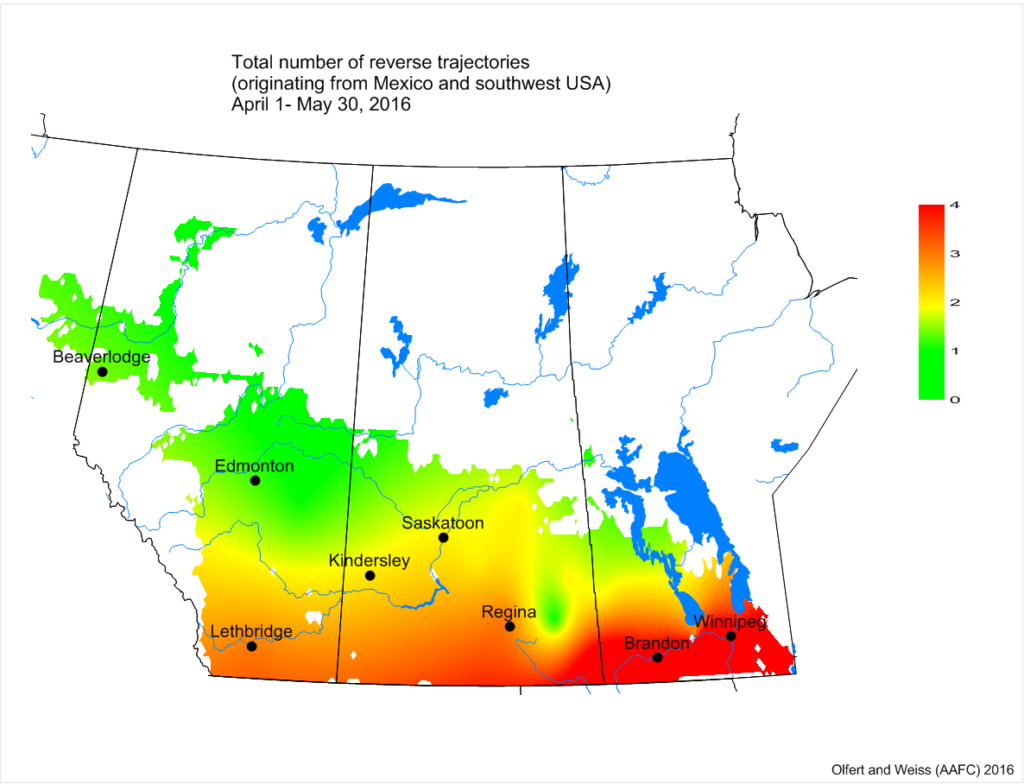
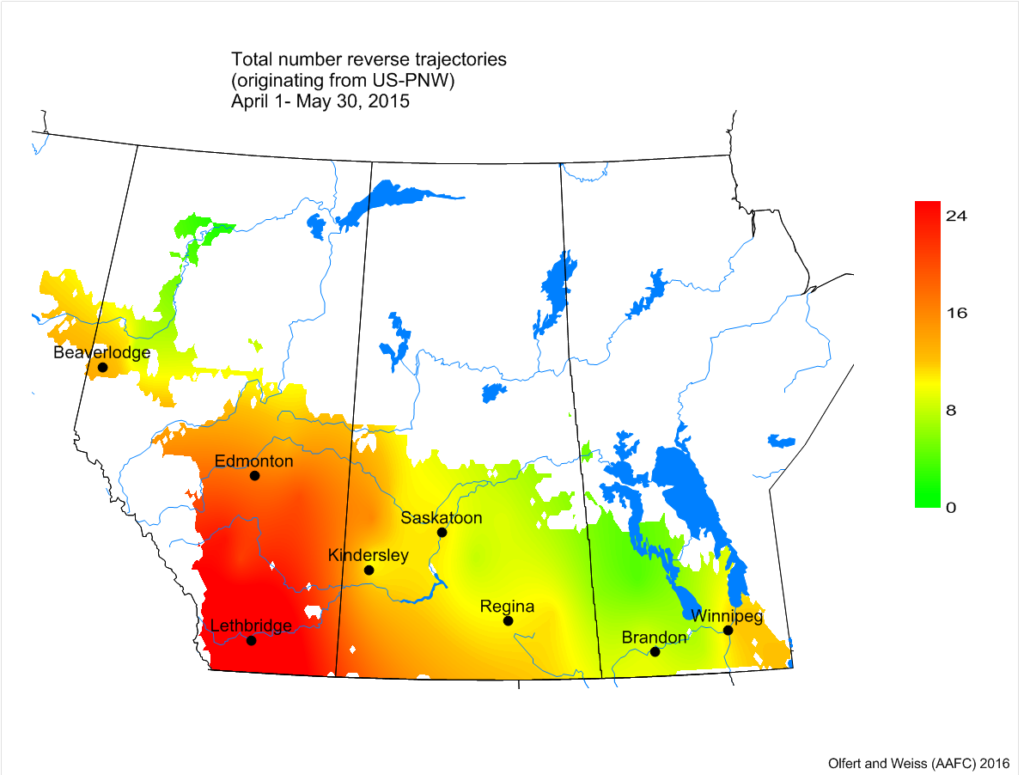

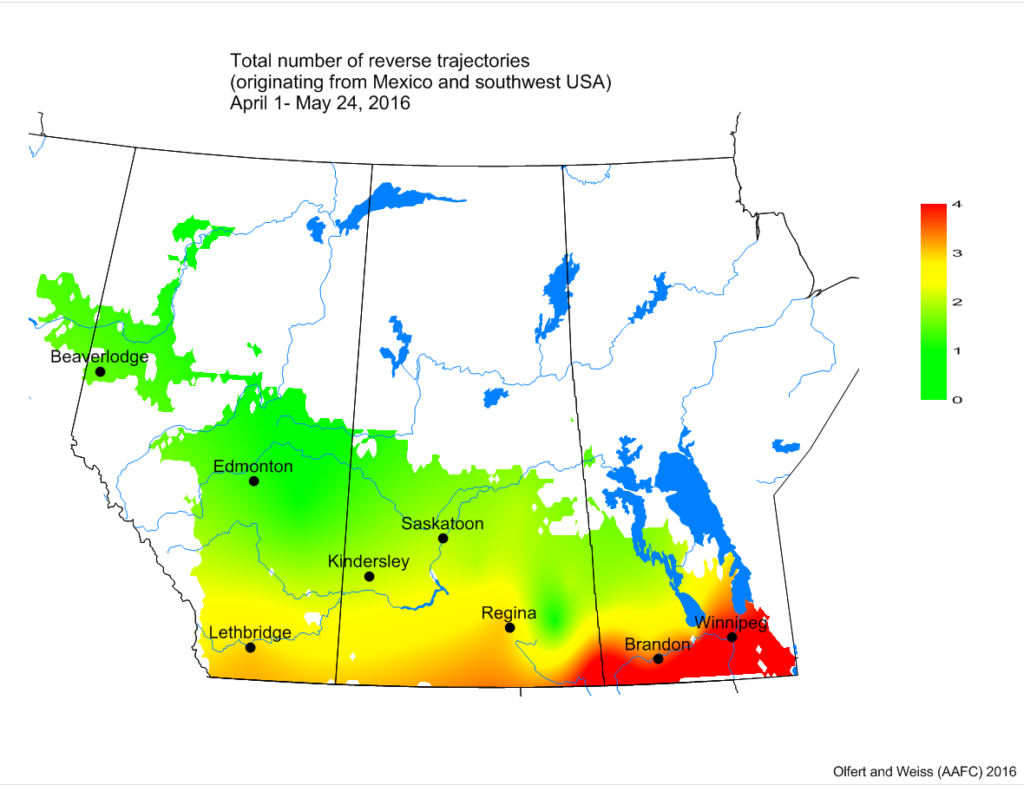
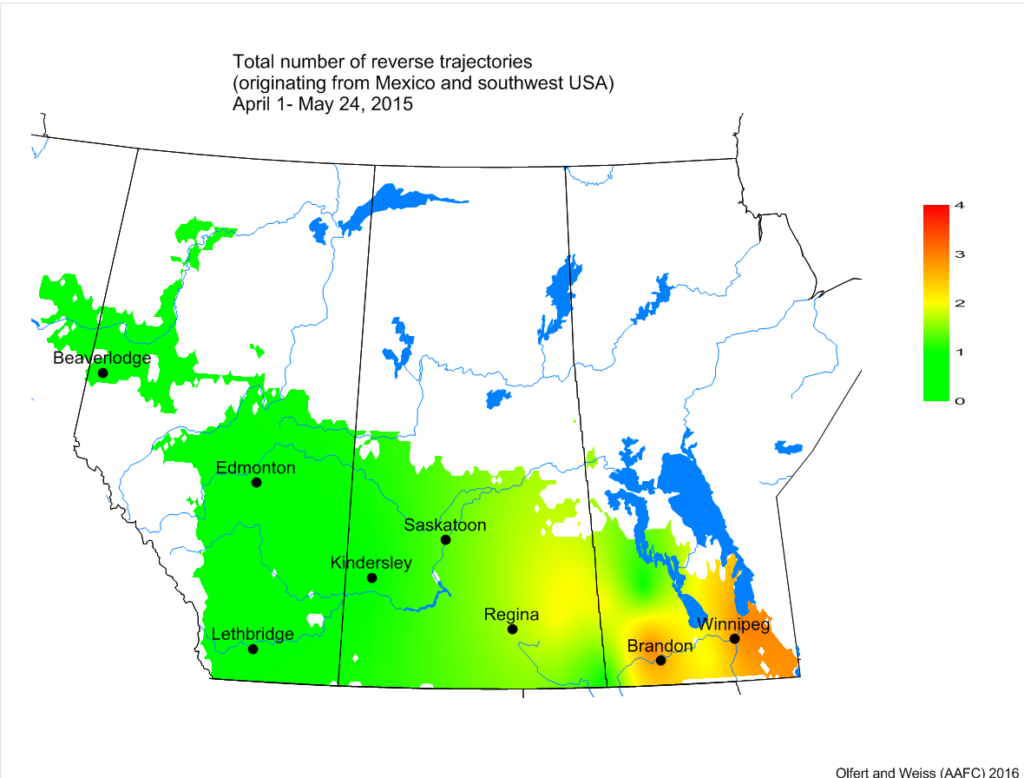
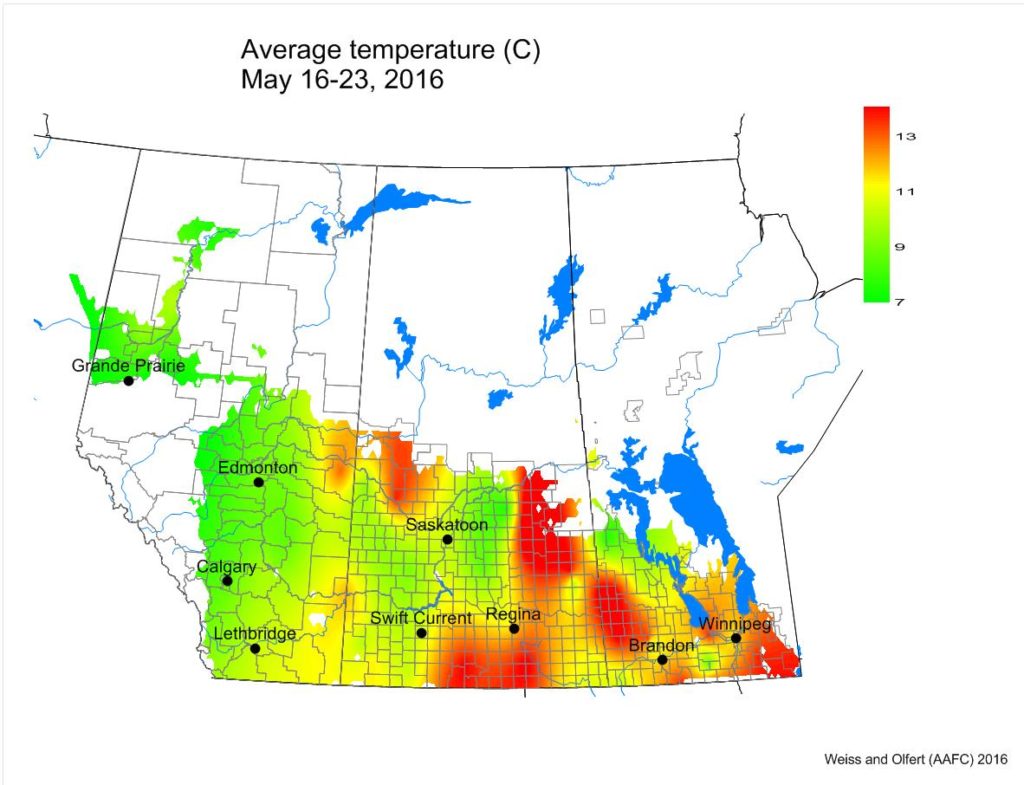
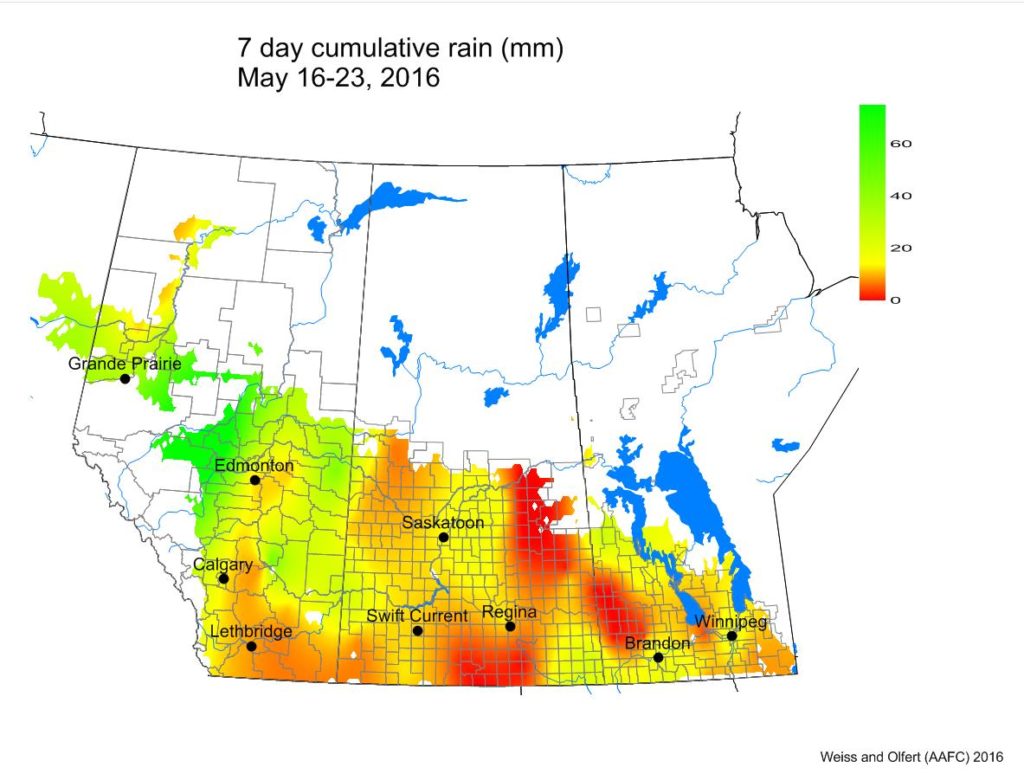
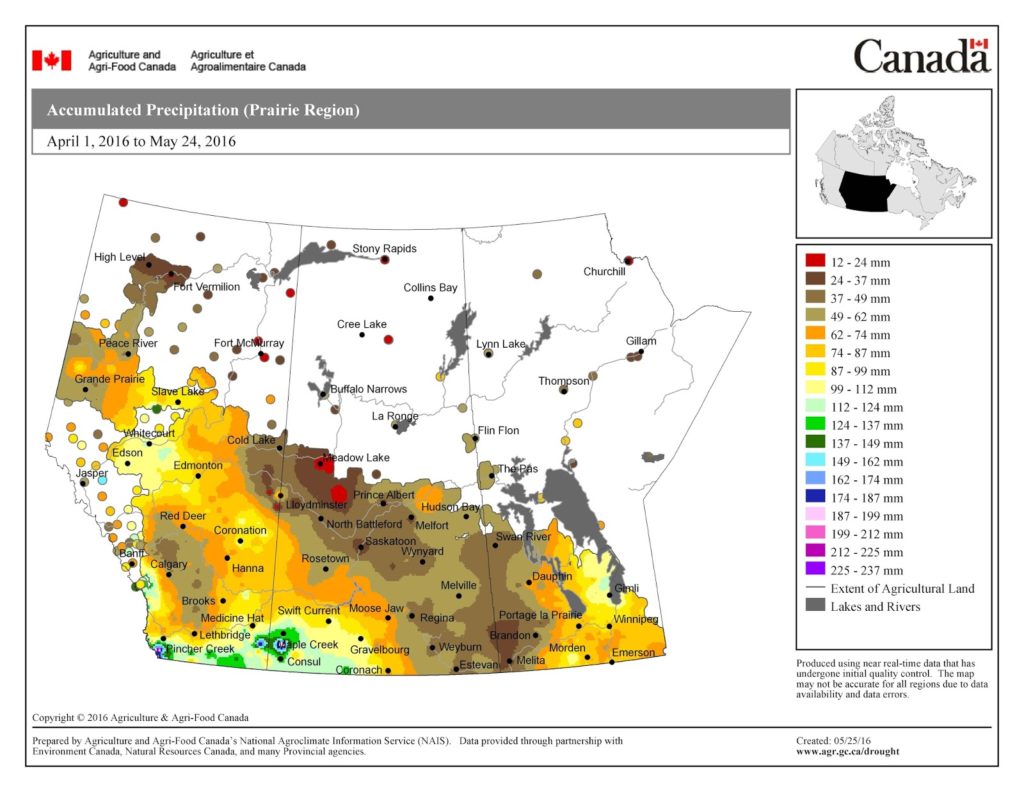
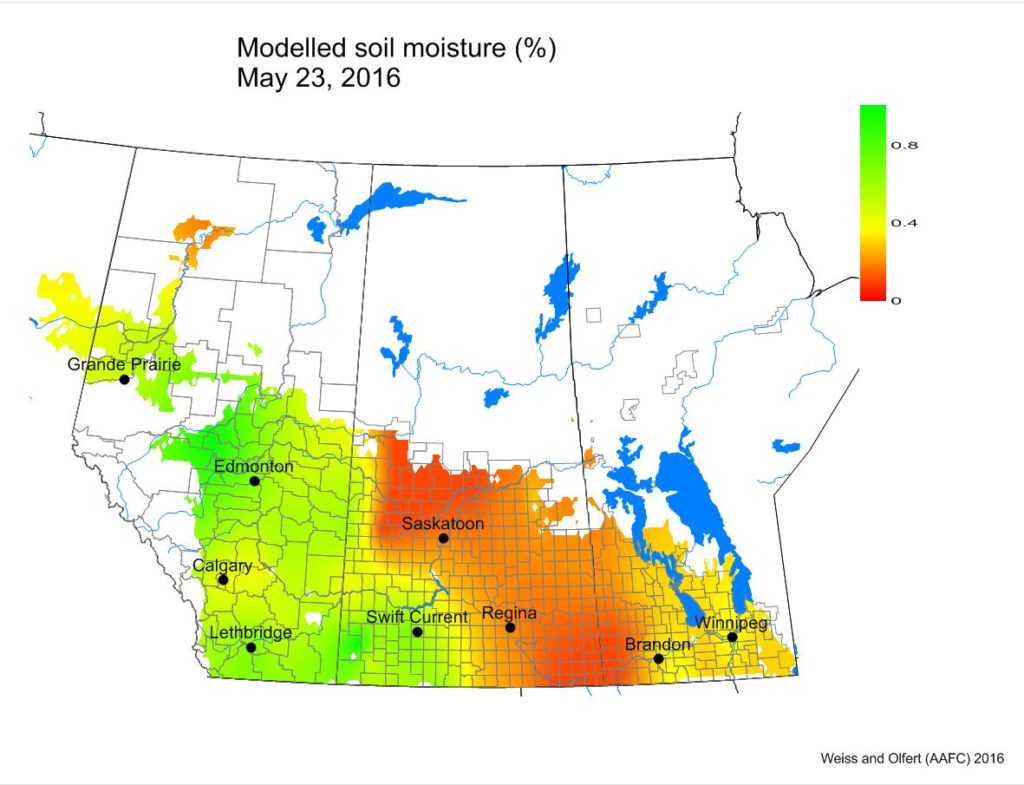


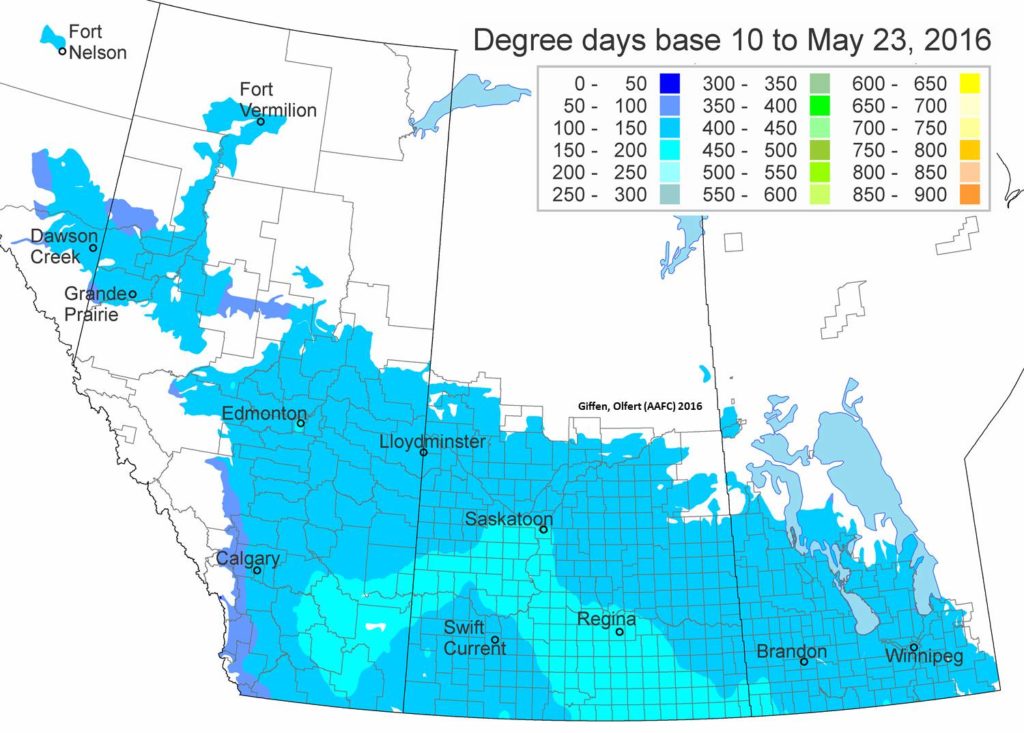
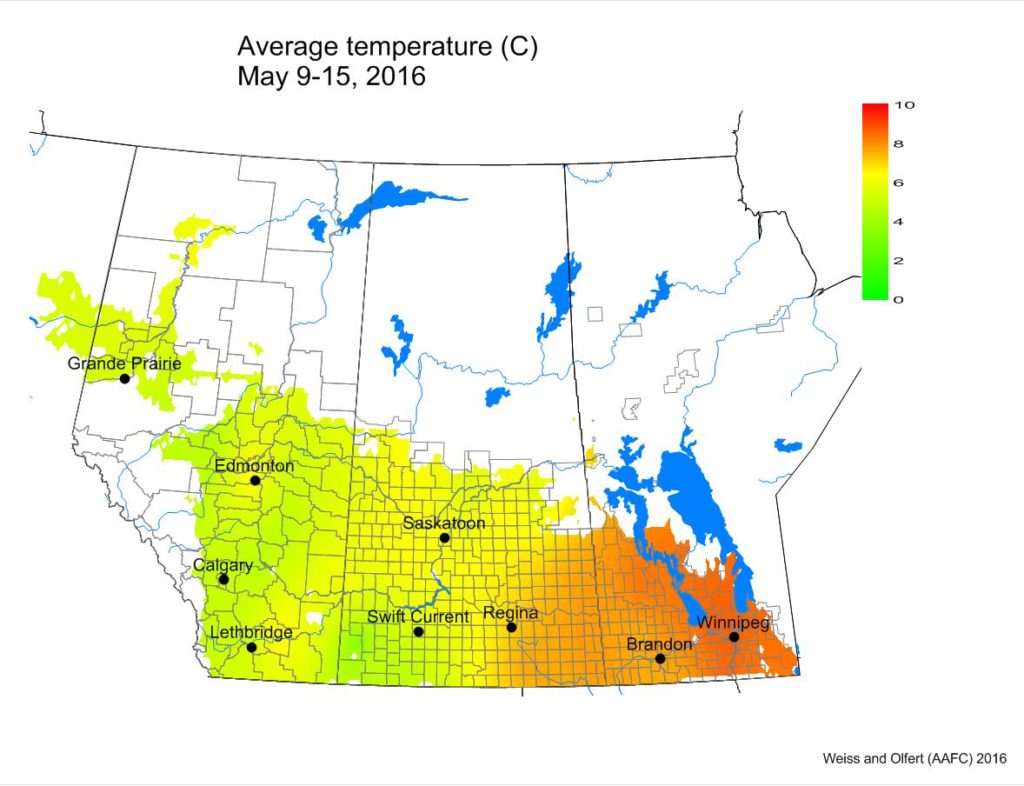
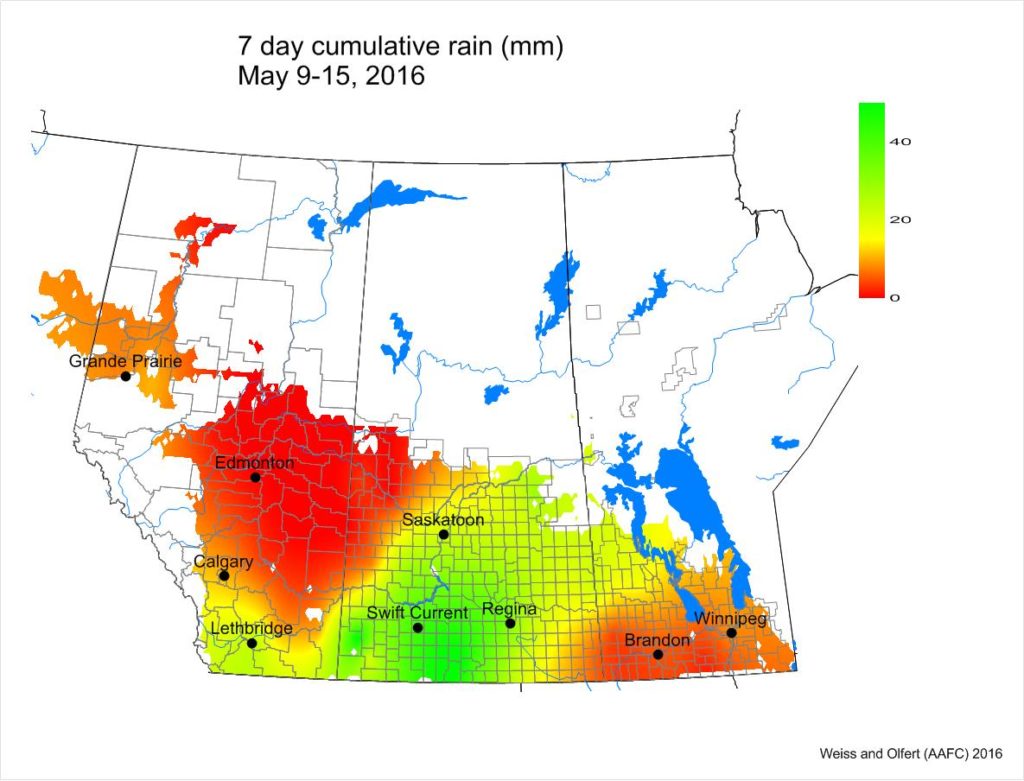
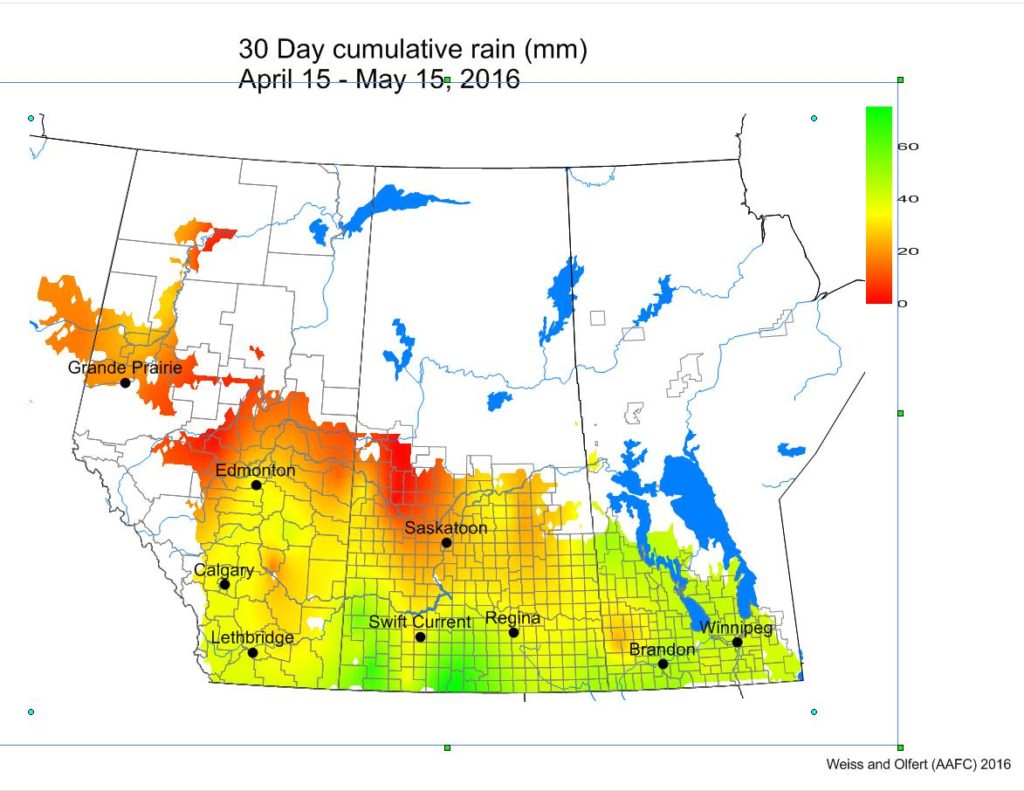
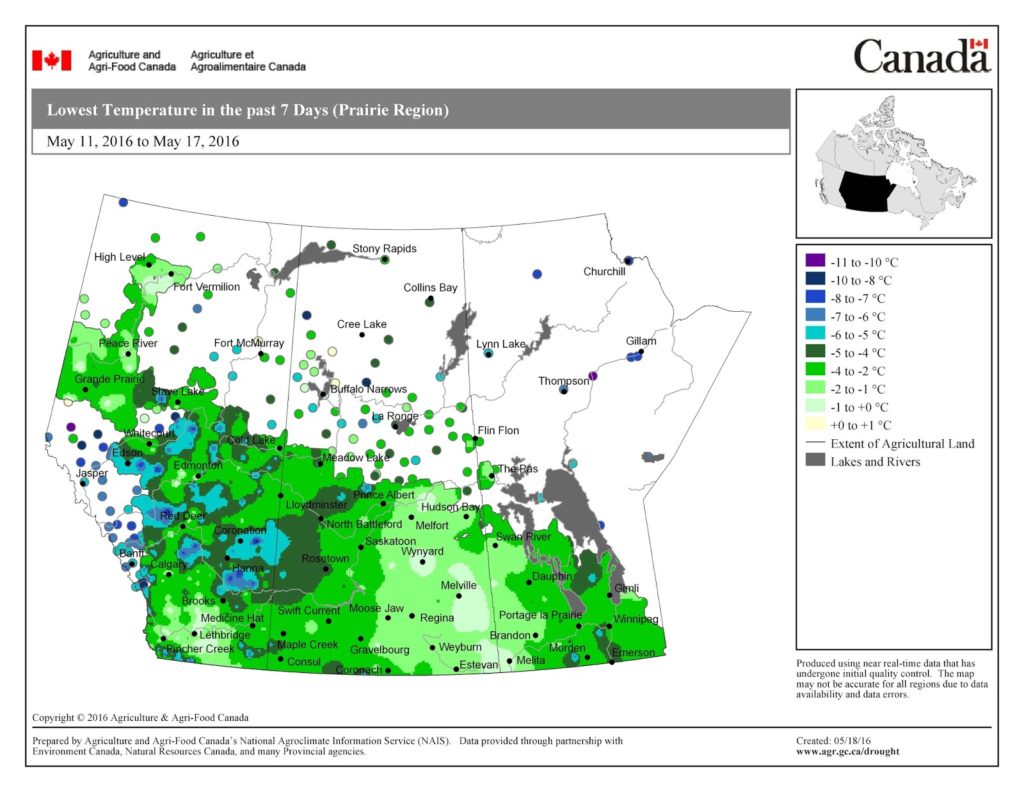
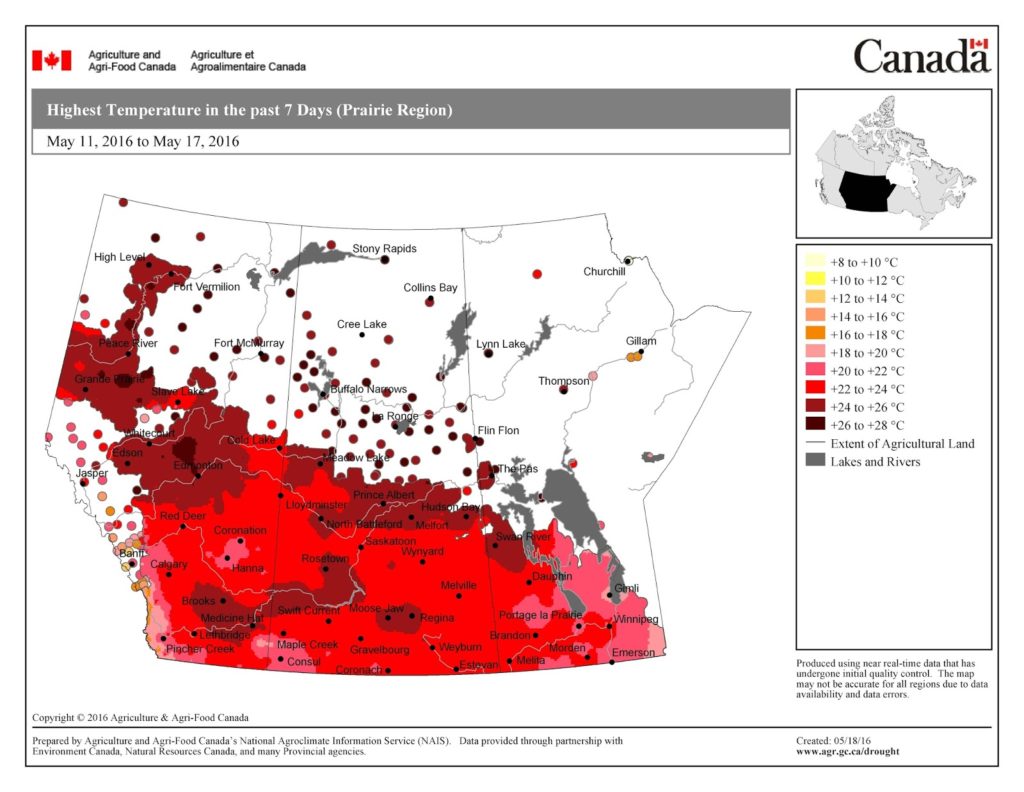
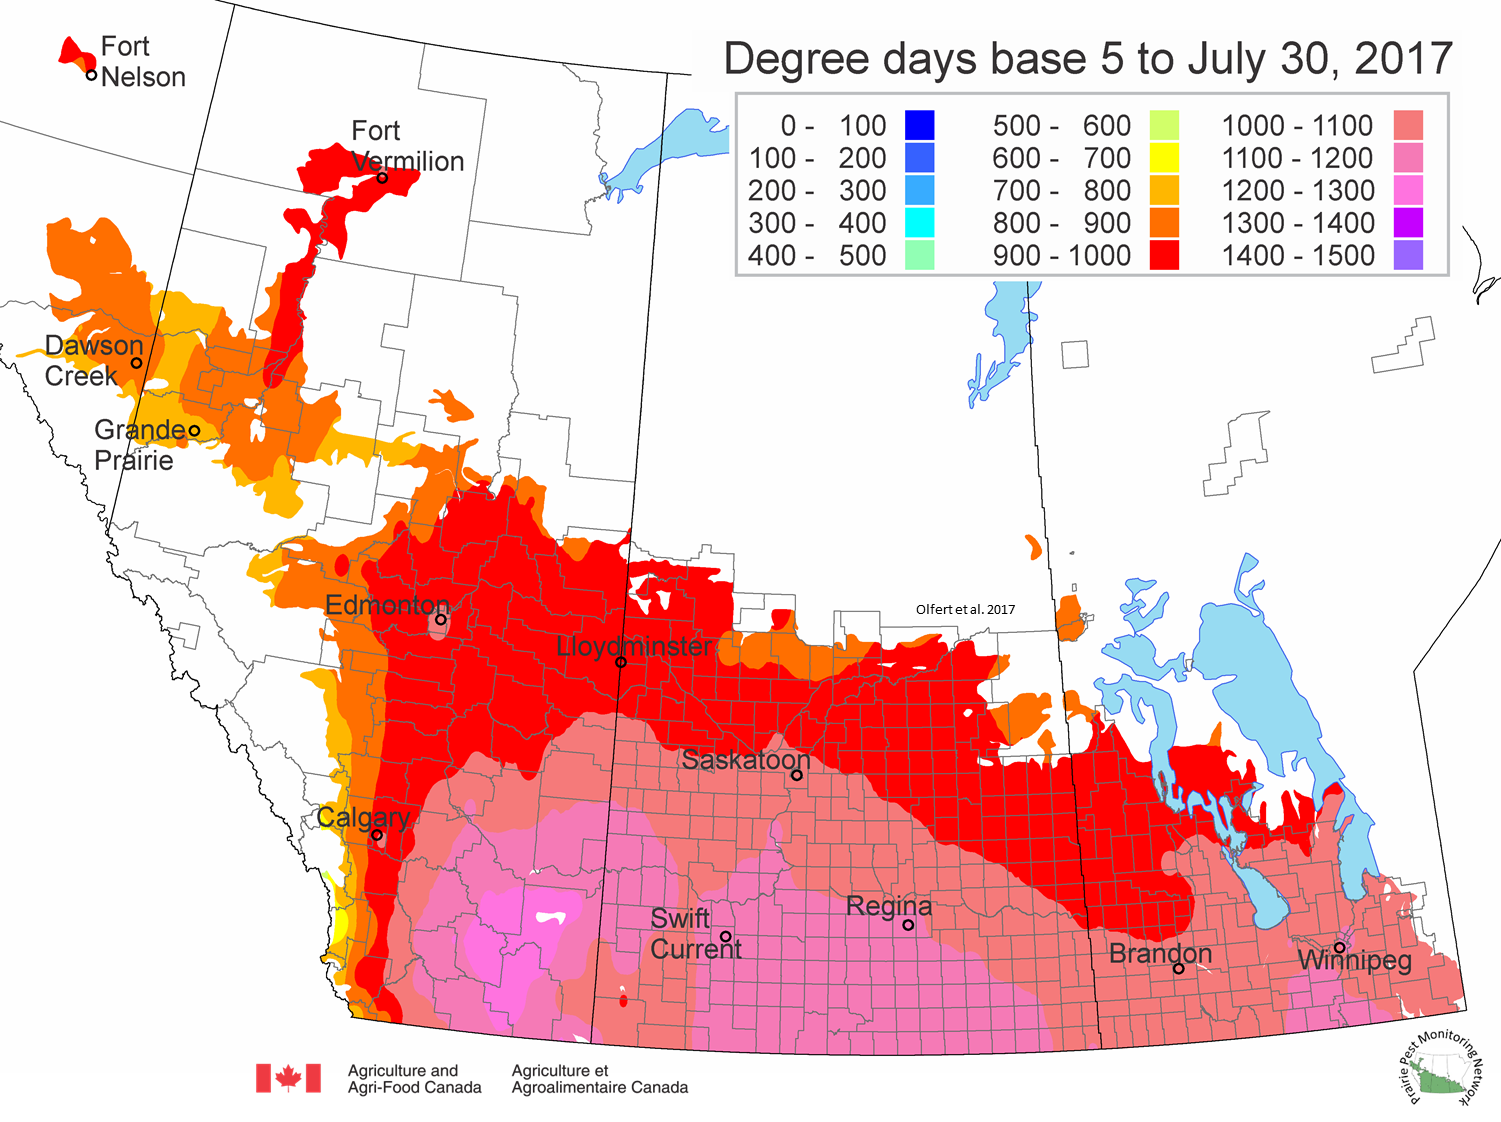
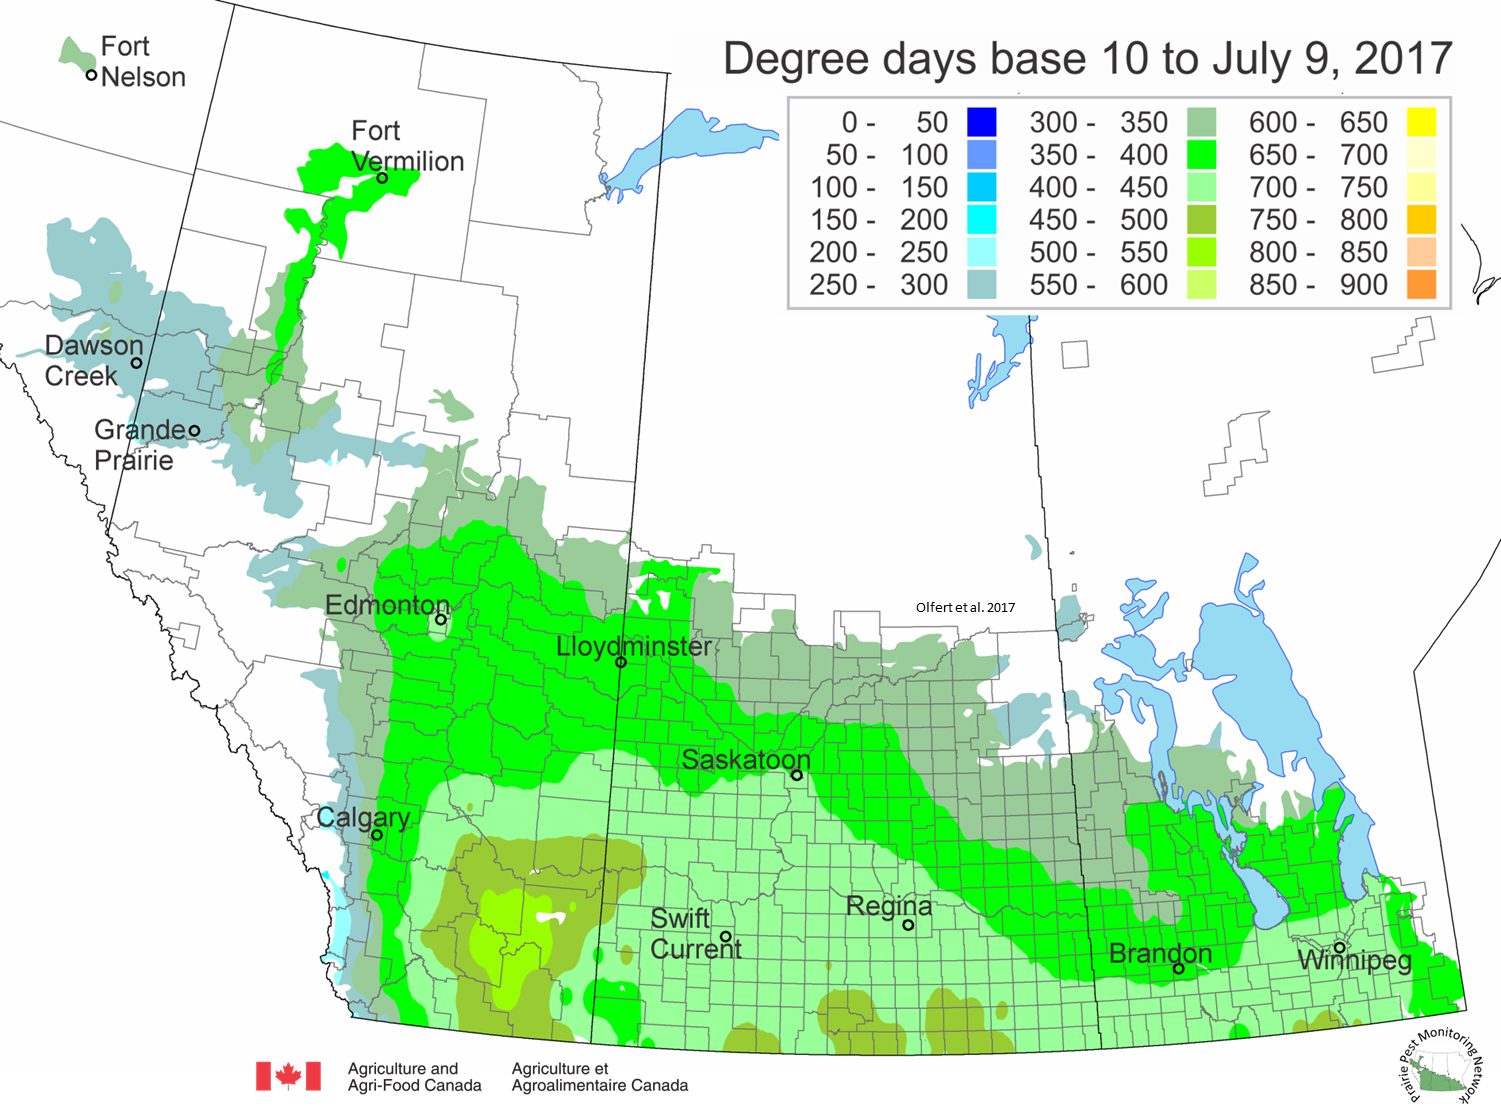
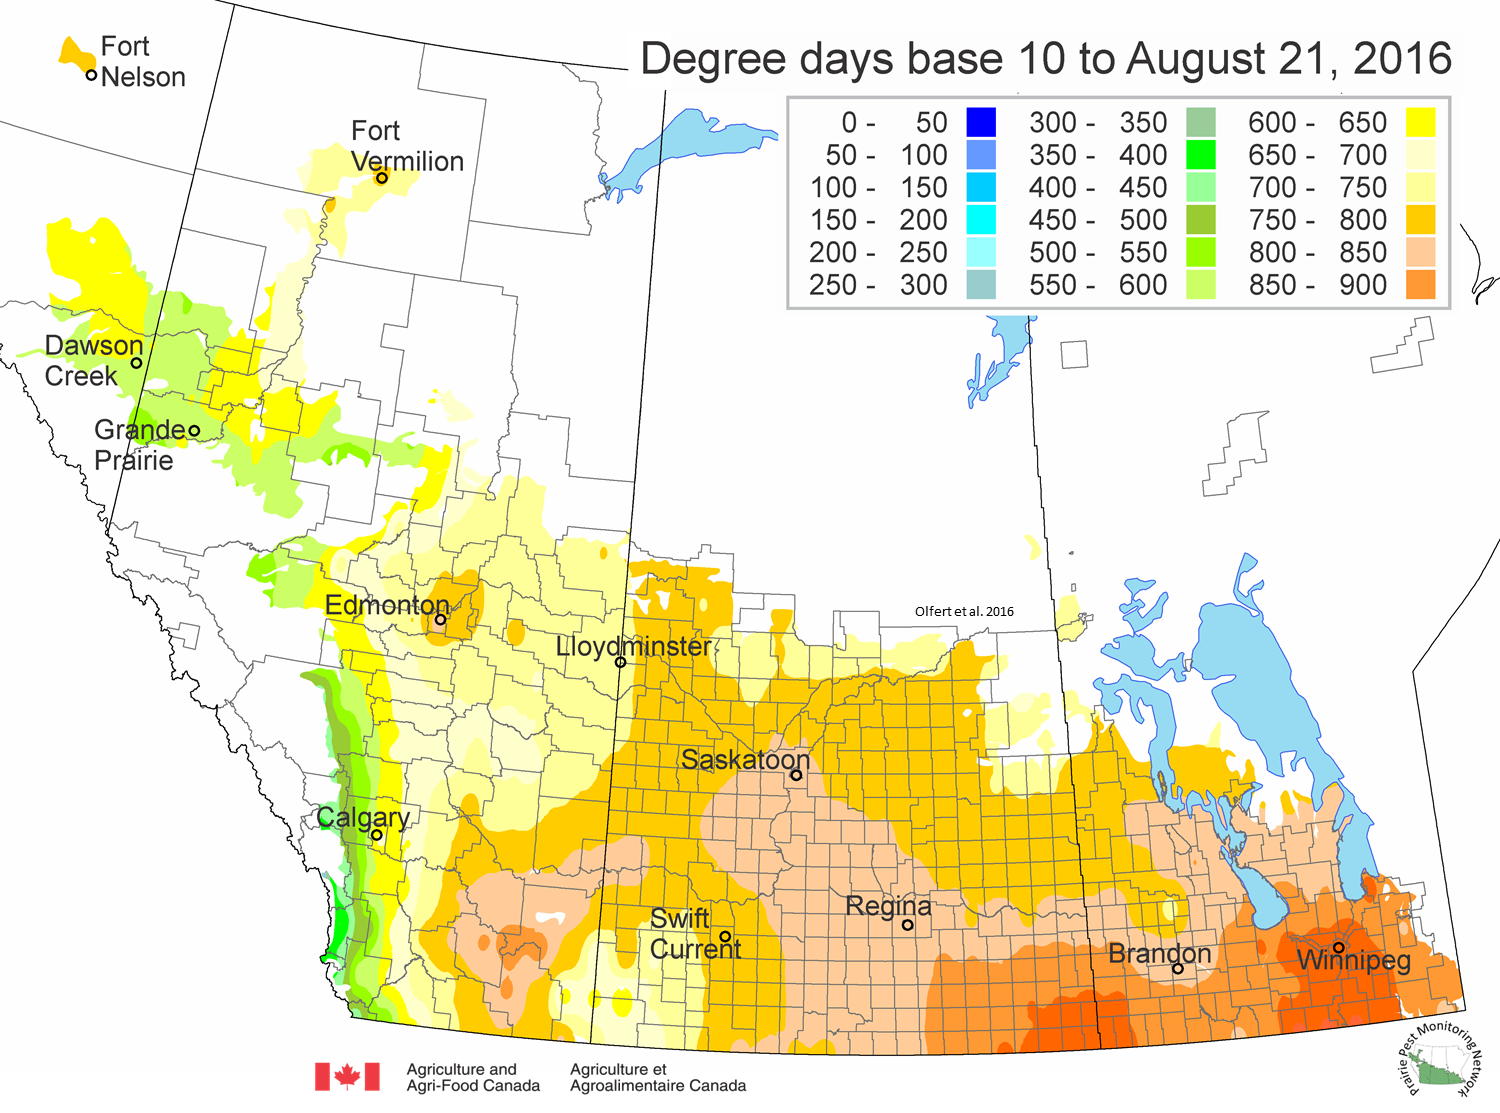
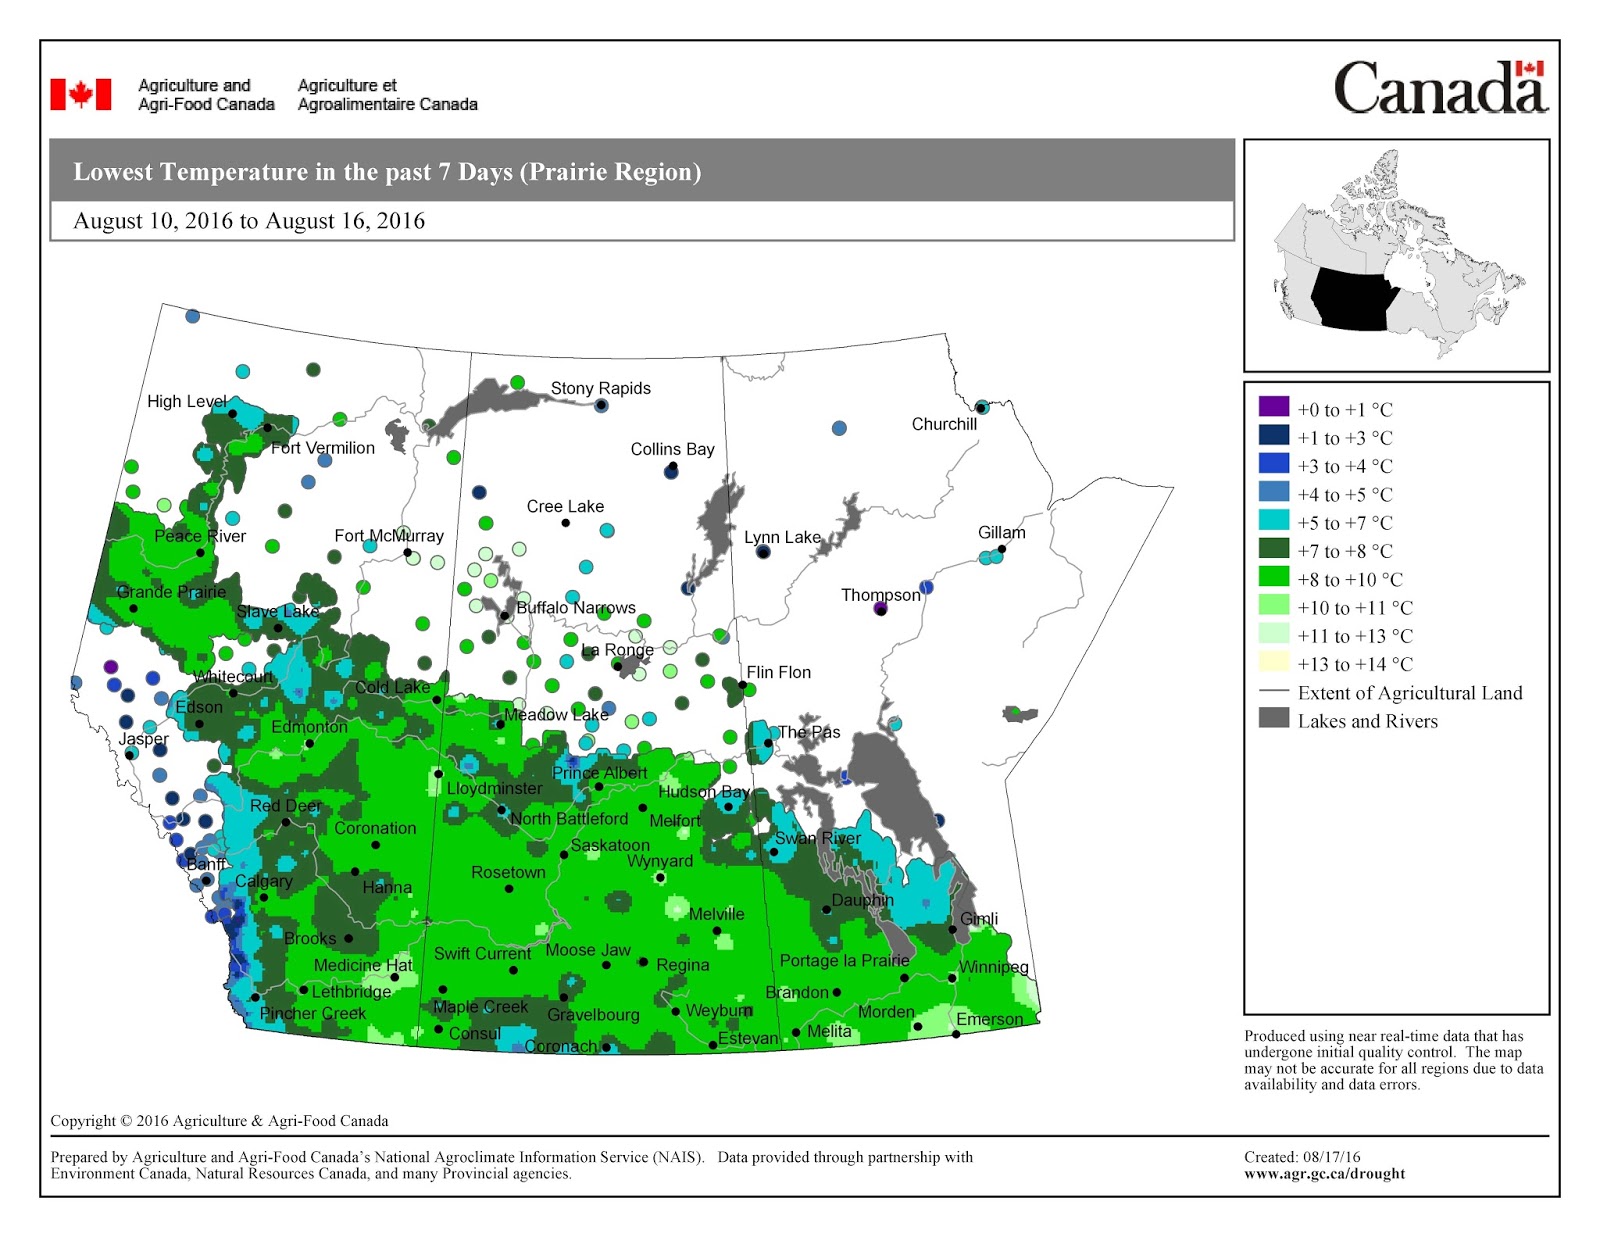
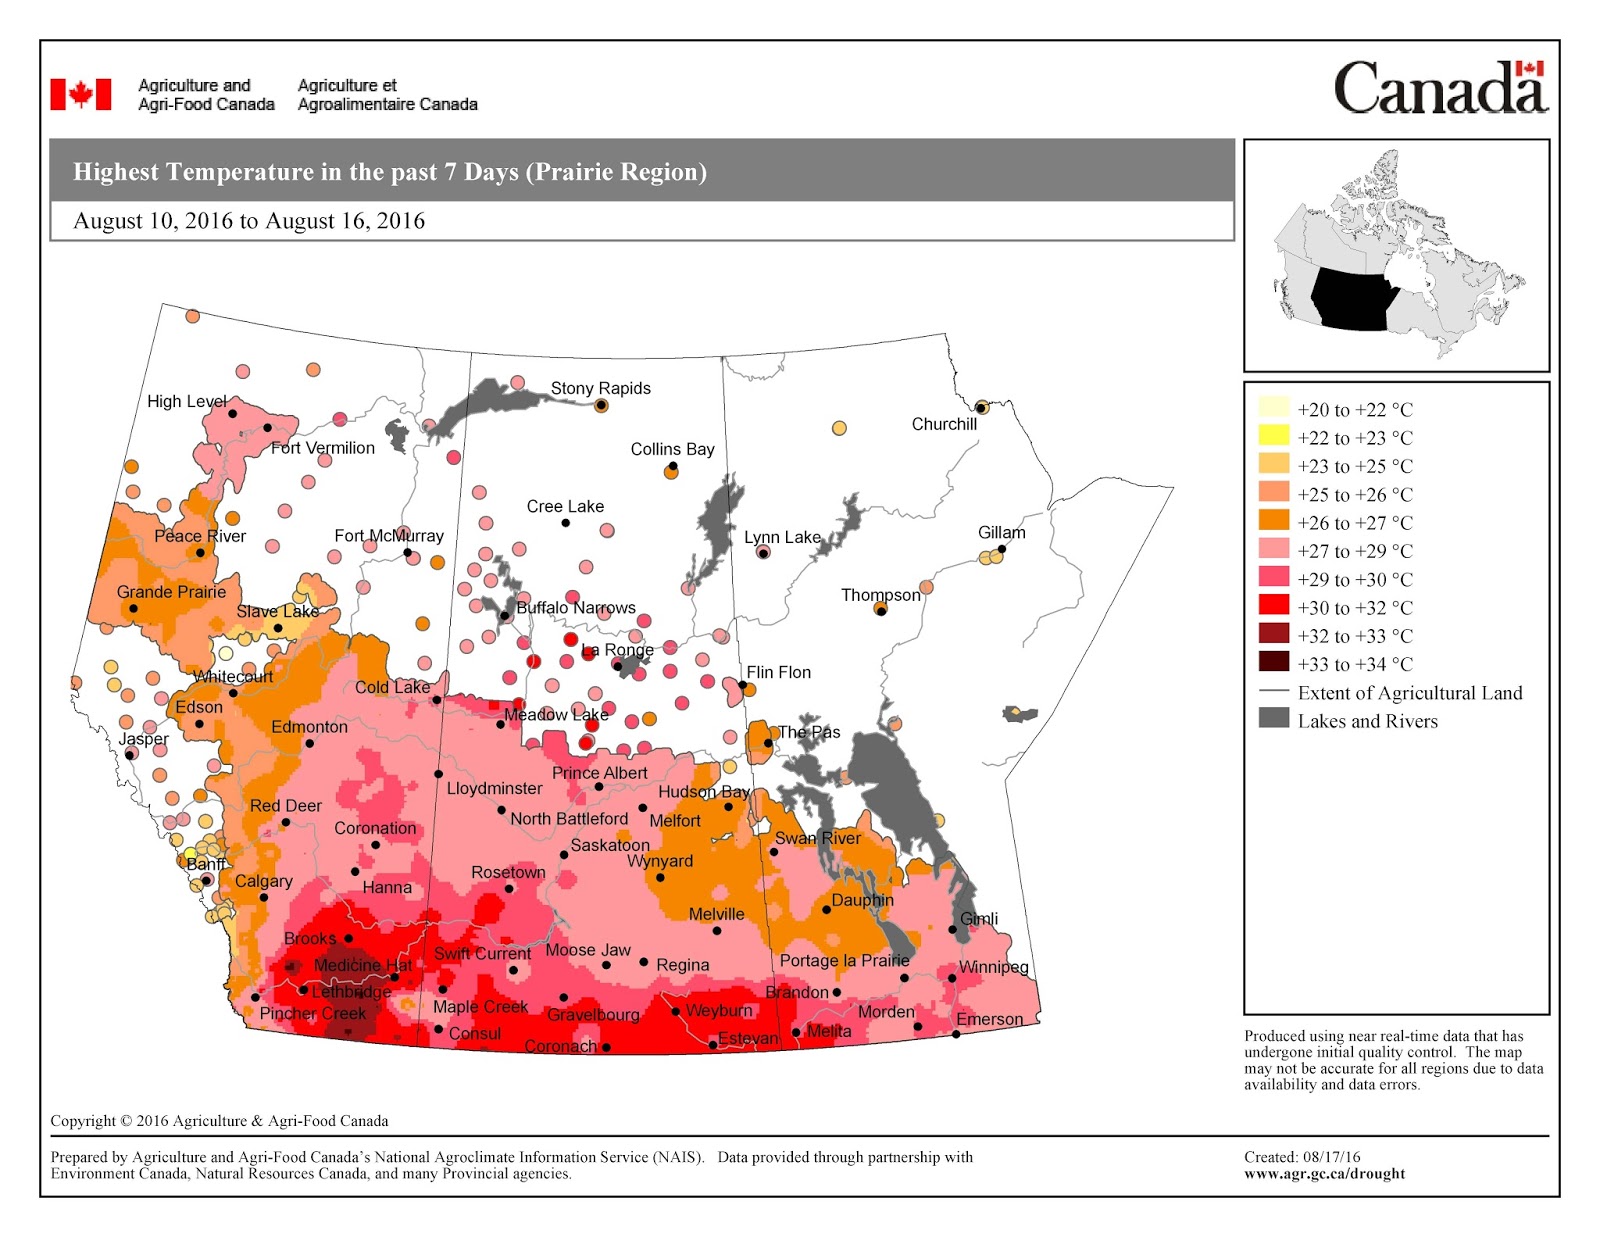
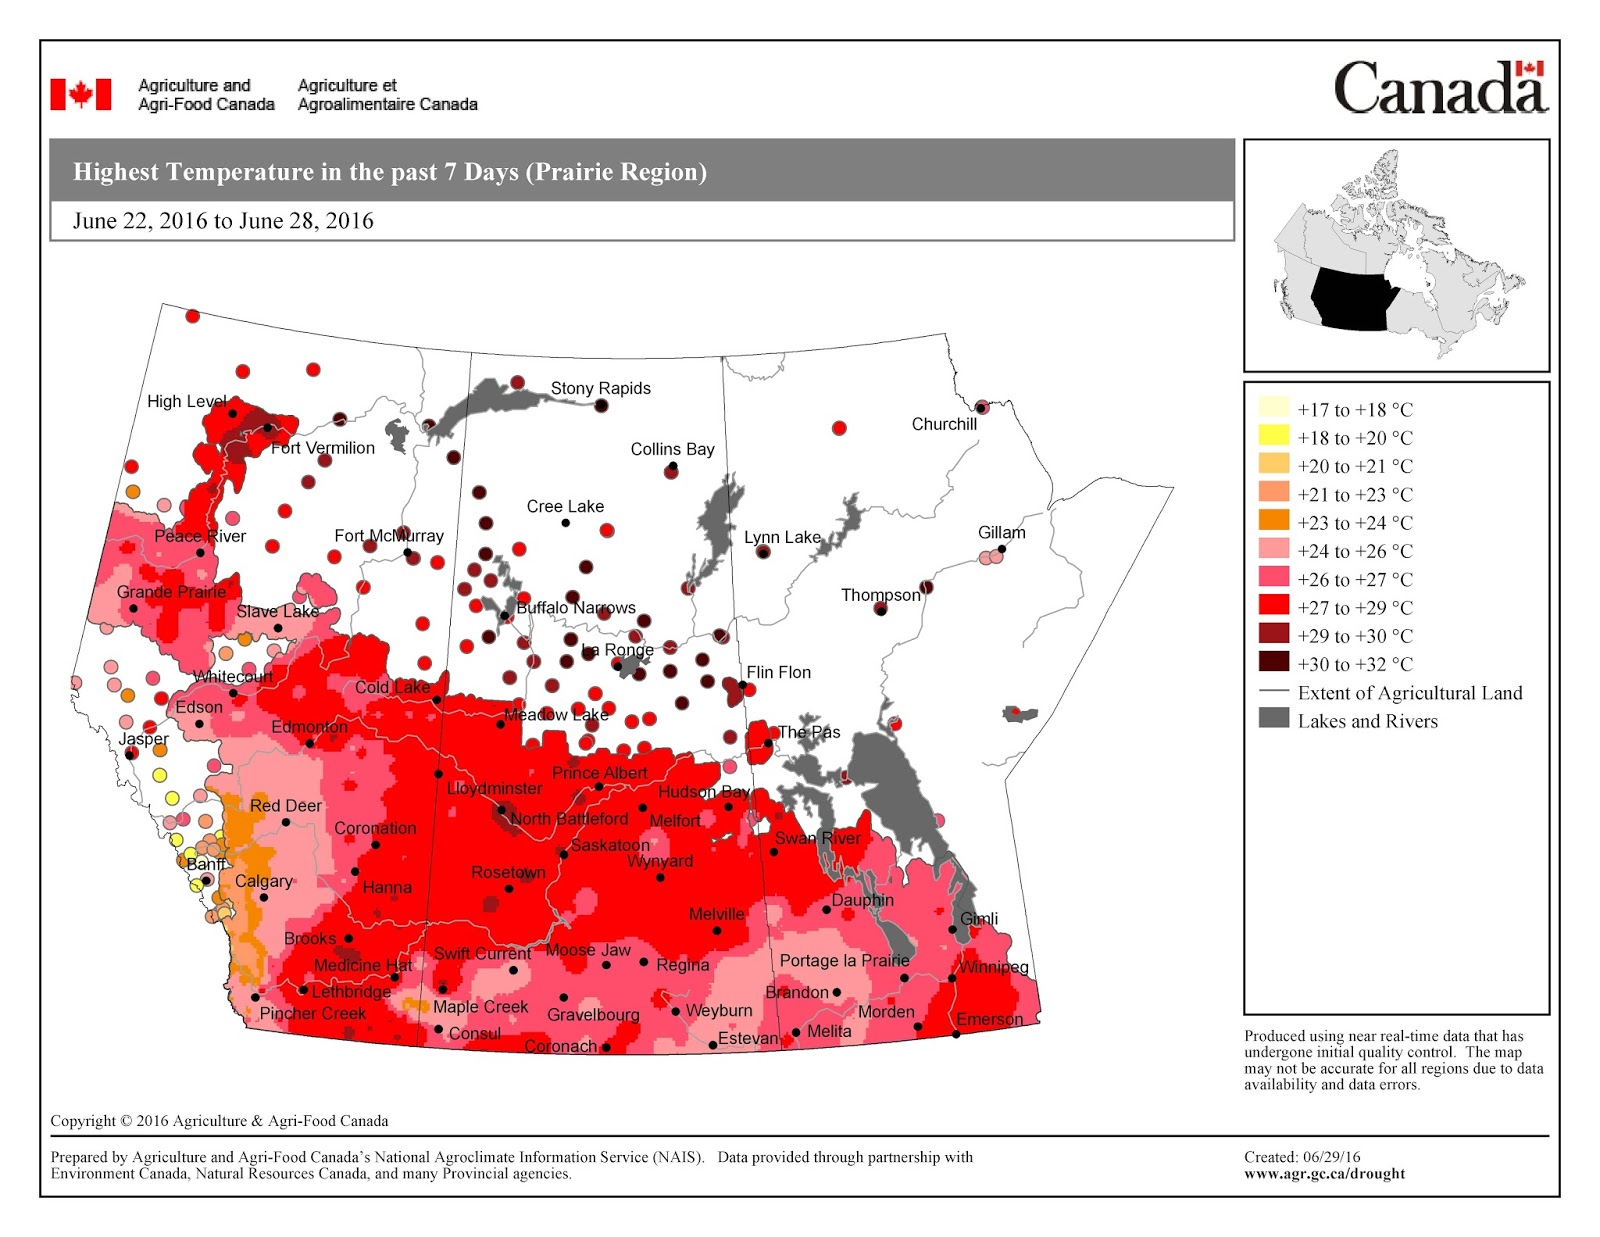
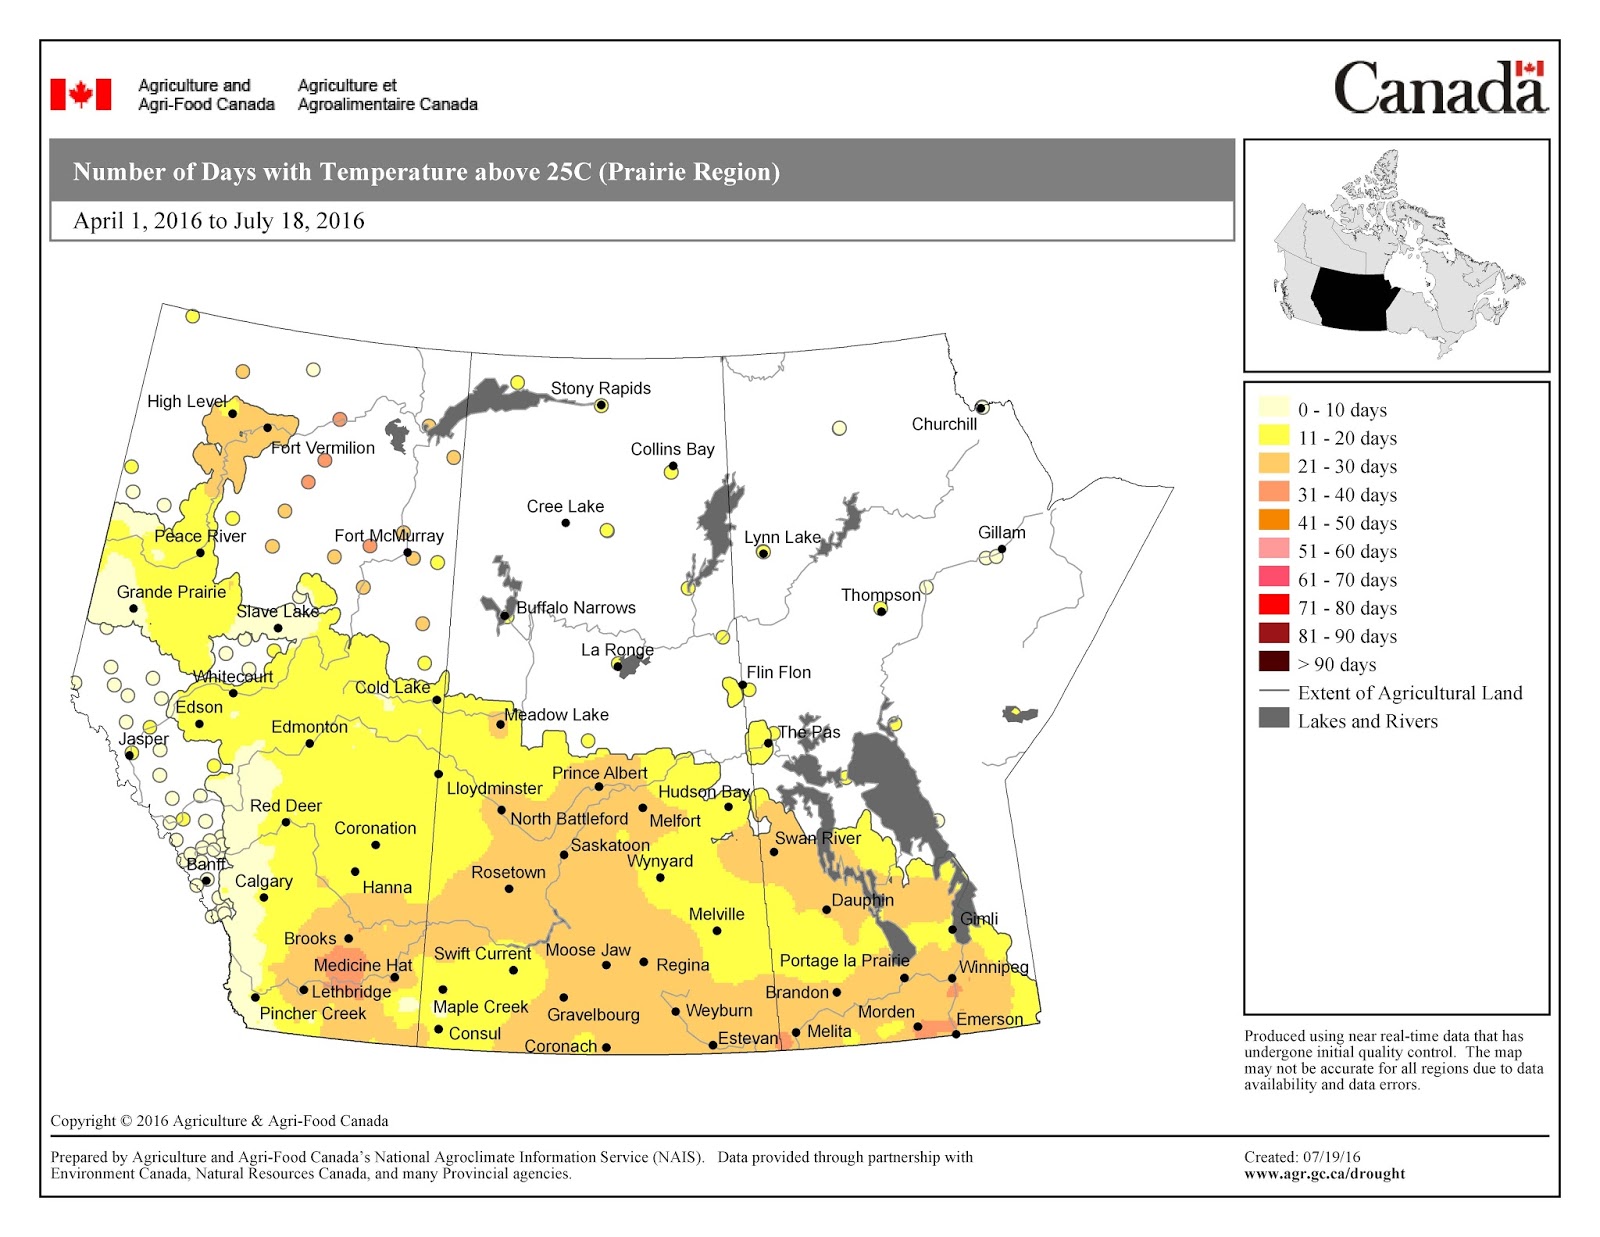
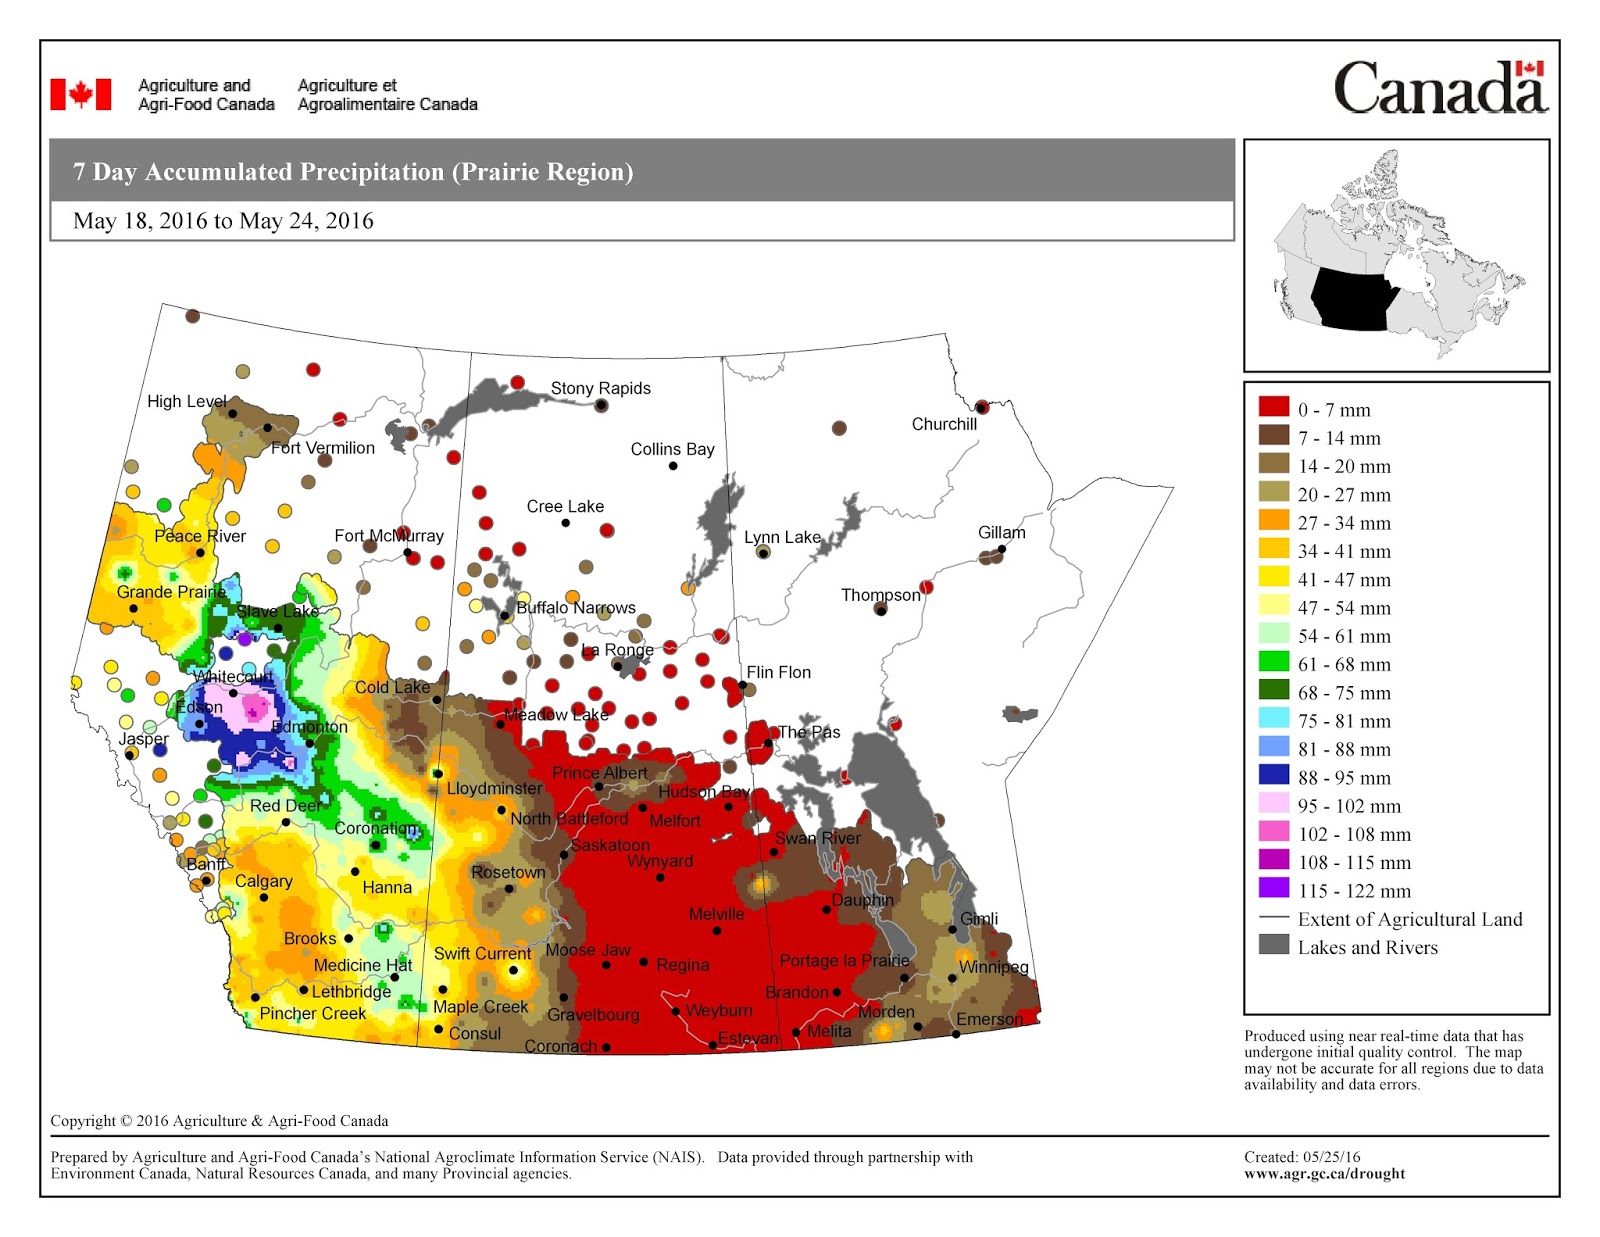
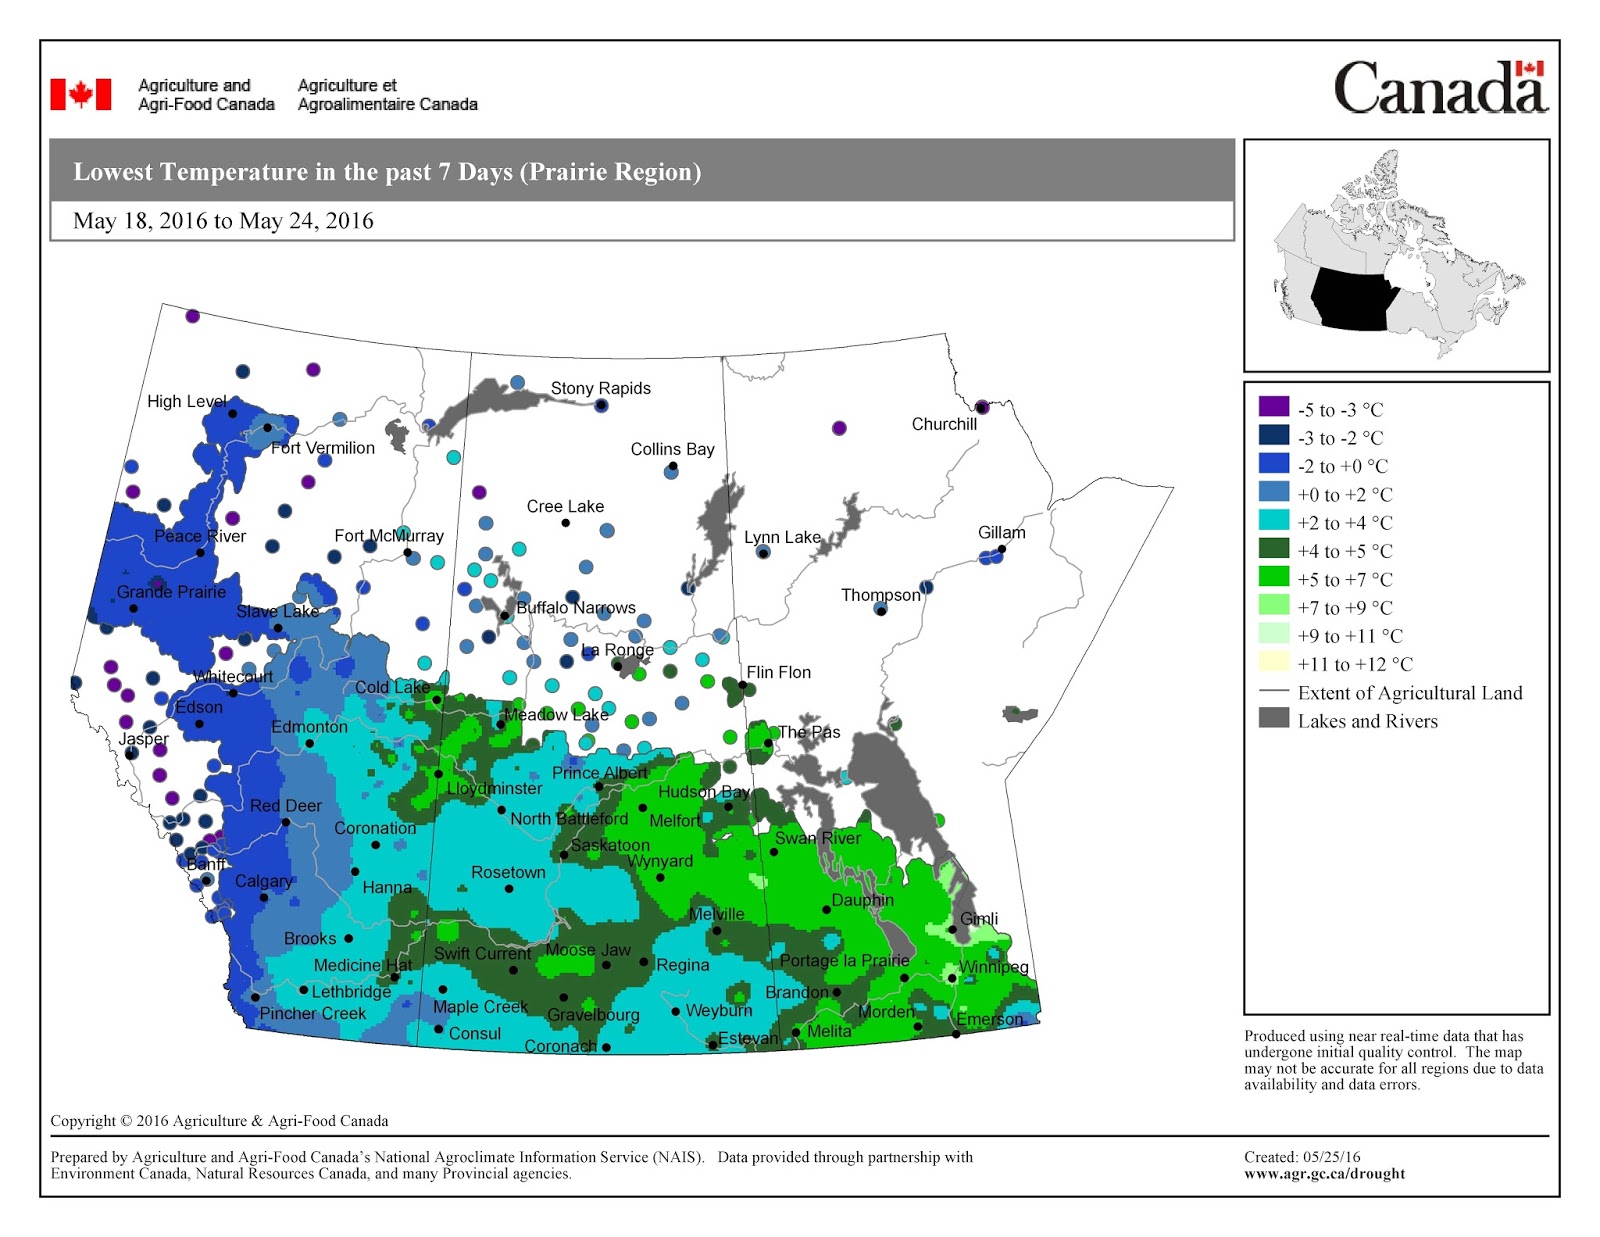
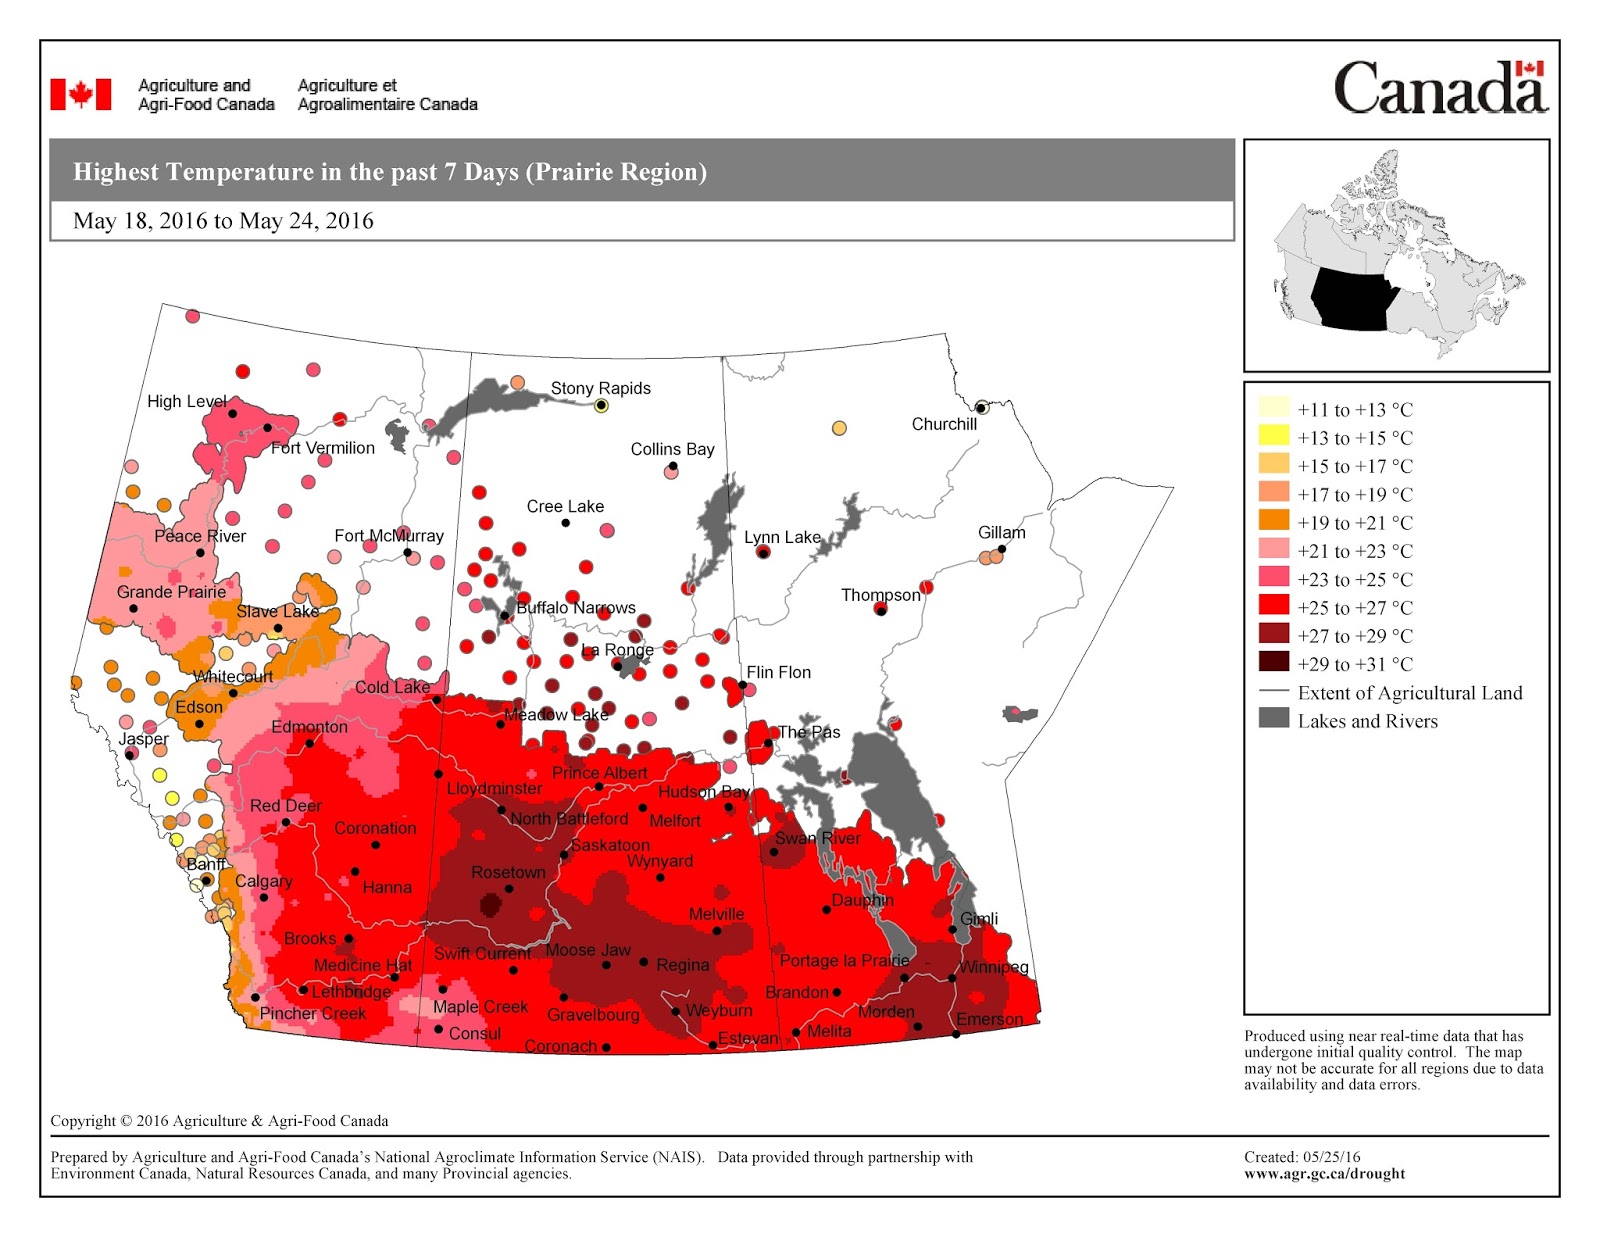
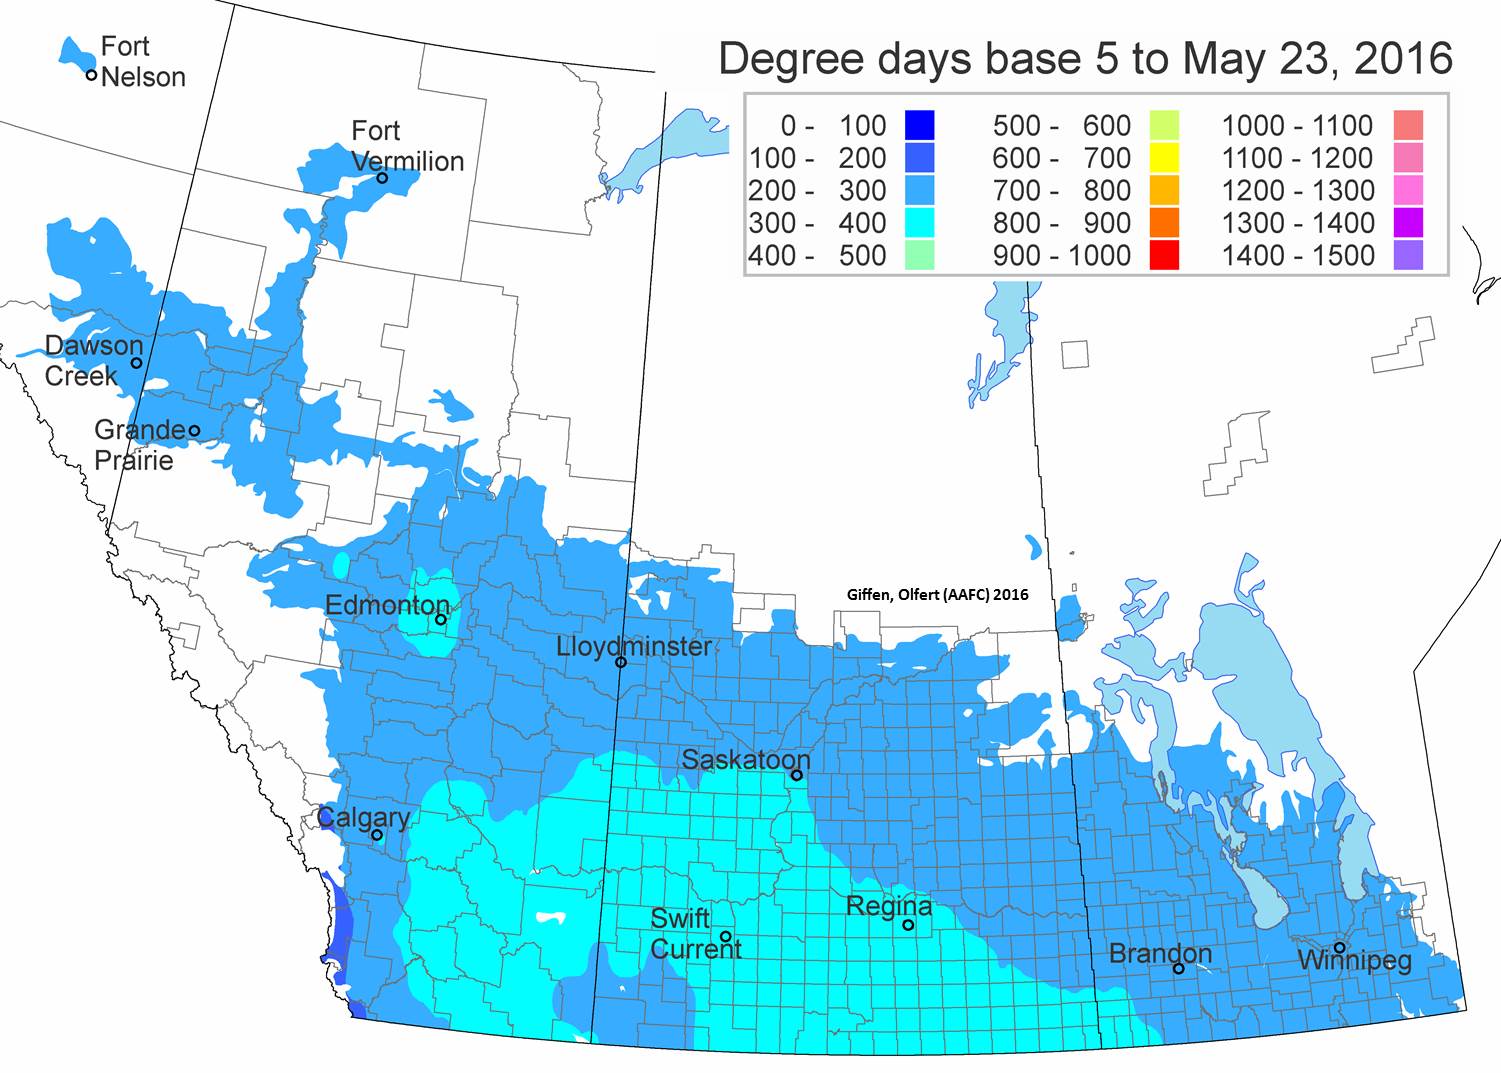