Ross Weiss, David Giffen, Owen Olfert and prairiepest_admin
Categories
Week 2
Weather synopsis – This past week (May 6-13), the average temperature was approximately 2 °C cooler than long term average (Fig. 1). The warmest weekly temperatures occurred across Alberta. The 30-day average temperature (April 13-May 13) was very similar to long term average temperatures with the warmest conditions occurring across Alberta (Fig. 2).
Figure 1. Average temperatures across the Canadian prairies these past seven days (May 6-13, 2018).
Figure 2. Average temperatures across the Canadian prairies this past month (April 13-May 13, 2018).
Weekly precipitation was well below average and 30-day total rainfall is approximately 50% less than average (Figs. 3 and 4). The lowest precipitation amounts have occurred across eastern Saskatchewan and most of Manitoba.
Figure 3. Cumulative precipitation (mm) these past seven days (May 6-13, 2018).
Figure 4. Cumulative precipitation (mm) this past month (April 13-May 13, 2018).
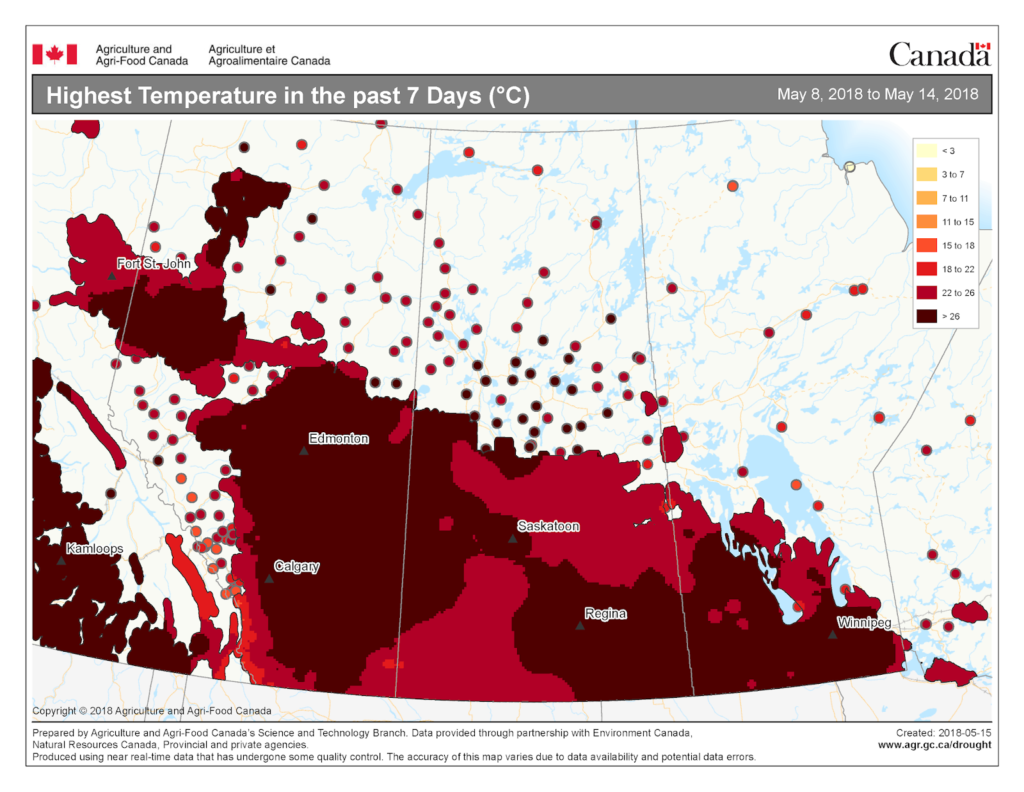
The map below reflects the Highest Temperatures occurring over the past 7 days across the prairies.
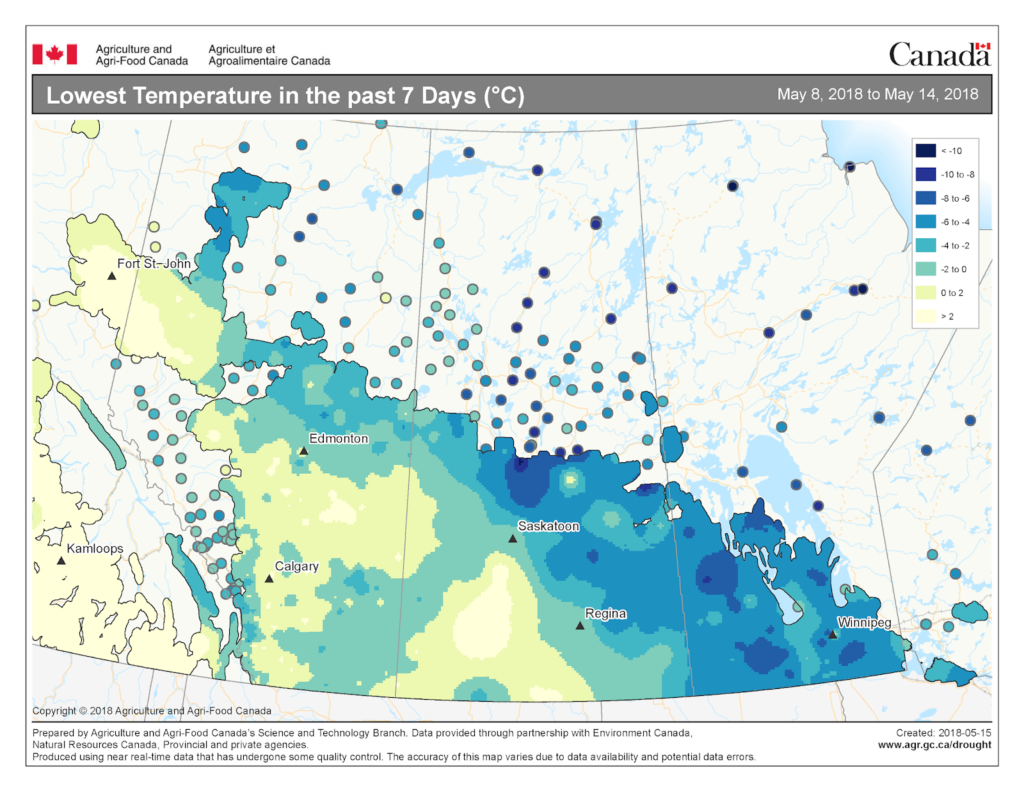
The map below reflects the Lowest Temperatures occurring over the past 7 days across the prairies.
The growing degree day map (GDD) (Base 10ºC, March 1 – May 13, 2018) is below:
The growing degree day map (GDD) (Base 5ºC, March 1 – May 13, 2018) is below:
The maps above are all produced by Agriculture and Agri-Food Canada. Growers may wish to bookmark the AAFC Drought Watch Maps for the growing season.
Field scouting is critical – it enables the identification of potential risks to crops. Accurate identification of insect pests PLUS the application of established monitoring methods will enable growers to make informed pest management decisions. We offer TWO generalized insect pest scouting charts to aid in-field scouting on the Canadian prairies: 1. CANOLA INSECT SCOUTING CHART 2. A NEW FLAX INSECT SCOUTING CHART These charts feature hyperlinks directing growers to downloadable PDF pages within the “Field crop and forage pests and their natural enemies in western Canada: Identification and management field guide“. Whenever possible, monitor and compare pest densities to established economic or action thresholds to protect and preserve pollinators and beneficial arthropods. Economic thresholds, by definition, help growers avoid crop losses related to outbreaking insect pest species. Good luck with your scouting!
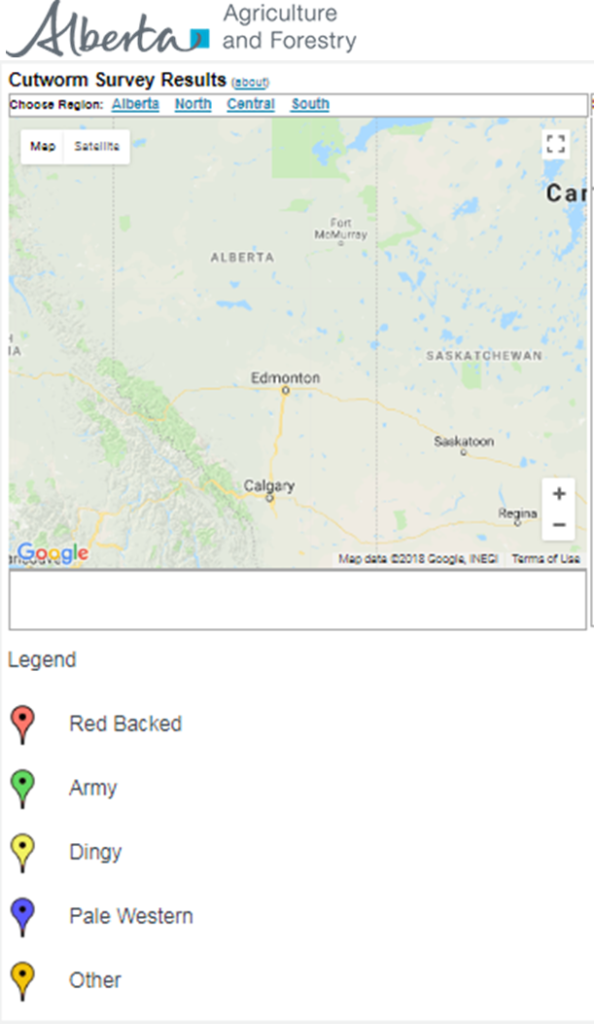
Cutworms (Noctuidae) – A field guide is now available to help growers scout and manage Cutworms! Cutworm Pest of Crops is available for free in either English or French and is posted on the Cutworm Field Guide page! Also be sure to check the Insect of the Week through May – it highlights cutworms. Several species of cutworms can be present in fields. They range in colour from shiny opaque, to tan, to brownish-red with chevron patterning. Cutworm biology, species information, plus monitoring recommendations are available in the Prairie Pest Monitoring Network’s Cutworm Monitoring Protocol. Also refer to Manitoba Agriculture cutworm fact sheet which includes action and economic thresholds for cutworms in several crops. Scout fields that are “slow” to emerge, are missing rows, include wilting or yellowing plants, have bare patches, or appear highly attractive to birds – these are areas warranting a closer look. Plan to follow-up by walking these areas later in the day when some cutworm species move above-ground to feed. Start to dig below the soil surface (1-5 cm deep) near the base of a symptomatic plant or the adjacent healthy plant. If the plant is well-established, check within the crown in addition to the adjacent soil. The culprits could be wireworms or cutworms. For Albertans….. If you find cutworms, please consider using the Alberta Pest Surveillance Network’s “2018 Cutworm Reporting Tool”. Once data entry occurs, growers can view the live 2018 cutworm map which is updated daily (see below for the map retrieved May 15, 2018).
Flea Beetles (Chrysomelidae: Phyllotreta species) – Be on the lookout for flea beetle damage resulting from feeding on canola cotyledons but also on the stem. Two species, Phyllotreta striolata and P. cruciferae, will feed on all cruciferous plants but they can cause economic levels of damage in canola during the seedling stages.
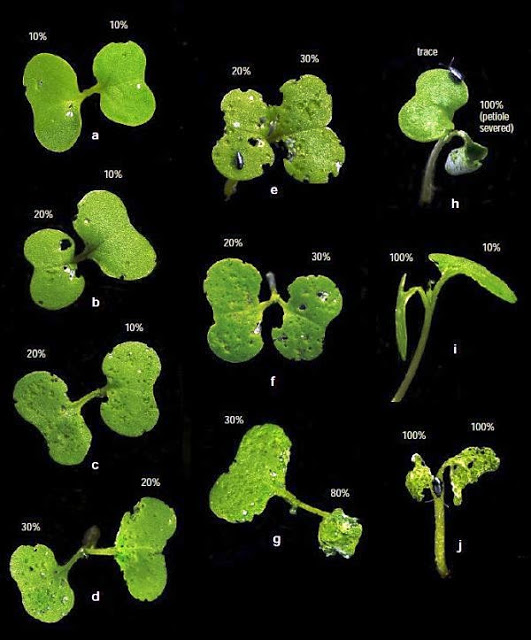
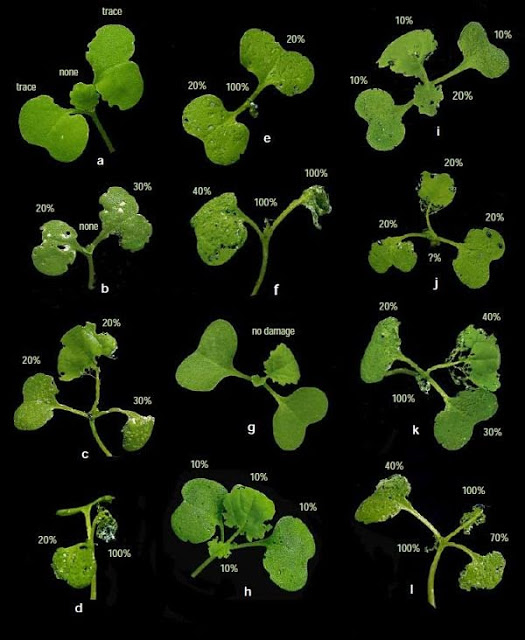
Remember, the Action Threshold for flea beetles on canola is 25% of cotyledon leaf area consumed. Watch for shot-hole feeding in seedling canola but also watch the growing point and stems of seedlings which are particularly vulnerable to flea beetle feeding. Estimating flea beetle feeding damage can be challenging. Using a visual guide to estimate damage can be helpful. Canola Watch circulated this article but also use the two images (copied below for reference) produced by Dr. J. Soroka (AAFC-Saskatoon) – take it scouting!
Figure 1. Canola cotyledons with various percentages of leaf area consume owing to flea beetle feeding damage (Photo: Soroka & Underwood, AAFC-Saskatoon).
Figure 2. Percent leaf area consumed by flea beetles feeding on canola seedlings (Photo: Soroka & Underwood, AAFC-Saskatoon).
Refer to the flea beetle page from the “Field Crop and Forage Pests and their Natural Enemies in Western Canada: Identification and management field guide” as an English-enhanced or French-enhanced version.
Cereal leaf beetle (Oulema melanopus) – Model output indicates that CLB oviposition has begun in many locations, and that larvae may begin to appear in the next 7-10 days. As of May 13th, CLB model runs indicated that oviposition was similar Lethbridge, Swift Current, Saskatoon and Brandon (Fig. 1).
Figure 1. Predicted cereal leaf beetle (O. melanupus) oviposition at four prairie locations. Values represent
predicted values based on 2018 weather and for model predictions based on long term average
weather (model simulations for April 1-May 13, 2018).
Lifecycle and Damage:
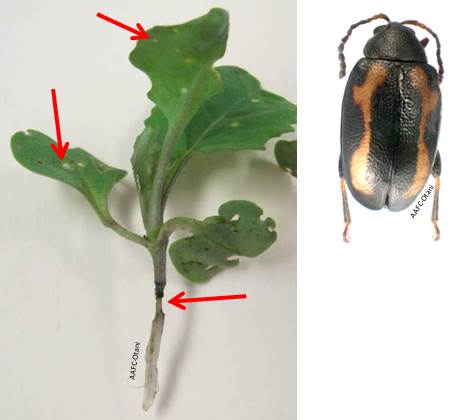
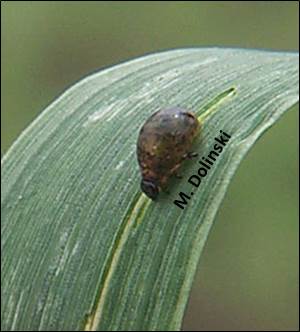
Adult: Adult cereal leaf beetles (CLB) have shiny bluish-black wing-covers (Fig. 2). The thorax and legs are light orange-brown. Females (4.9 to 5.5 mm) are slightly larger than the males (4.4 to 5 mm). Adult beetles overwinter in and along the margins of grain fields in protected places such as in straw stubble, under crop and leaf litter, and in the crevices of tree bark. They favour sites adjacent to shelter belts, deciduous and conifer forests. They emerge in the spring once temperature reaches 10-15 ºC and are active for about 6 weeks. They usually begin feeding on grasses, then move into winter cereals and later into spring cereals.
Figure 2. Adult Oulema melanopus measure 4.4-5.5 mm long (Photo: M. Dolinski).
Egg: Eggs are laid approximately 14 days following the emergence of the adults. Eggs are laid singly or in pairs along the mid vein on the upper side of the leaf and are cylindrical, measuring 0.9 mm by 0.4 mm, and yellowish in colour. Eggs darken to black just before hatching. Larva: The larvae hatch in about 5 days and feed for about 3 weeks, passing through 4 growth stages (instars). The head and legs are brownish-black; the body is yellowish. Larvae are usually covered with a secretion of mucus and fecal material, giving them a shiny black, wet appearance (Fig. 3). When the larva completes its growth, it drops to the ground and pupates in the soil.
Figure 3. Larval stage of Oulema melanopus with characteristic feeding damage visible on leaf (Photo: M. Dolinski).
Pupa: Pupal colour varies from a bright yellow when it is first formed, to the colour of the adult just before emergence. The pupal stage lasts 2 – 3 weeks. Adult beetles emerge and feed for a couple of weeks before seeking overwintering sites. There is one generation per year.
Fact sheets for CLB are published by the province of Alberta and available from the Prairie Pest Monitoring Network. Also access the Oulema melanopus page from the new “Field crop and forage pests and their natural enemies in western Canada – Identification and management field guide”.
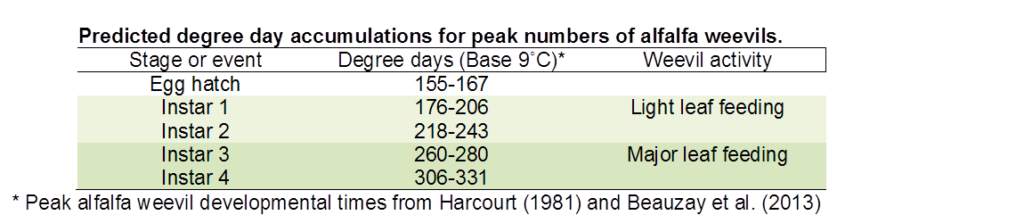
Alfalfa Weevil (Hypera postica) – Degree-day maps of base 9°C are produced using the Harcourt/North Dakota models (Soroka et al. 2015). Models predicting the development of Alfalfa weevil (Hypera postica) across the prairies are updated weekly to help growers time their in-field scouting for second-instar larvae. Compare the following predicted development stages and degree-day values from Soroka (2015) to the map below.
The alfalfa weevil model predicts that oviposition is well underway in southern Saskatchewan. Figure 1 shows model output for Swift Current where first instar larvae should appear early next week.
Figure 1. Predicted alfalfa weevil (Hypera postica) phenology at Swift Current SK.
Values are based on model simulations for April 1-May 6, 2018.
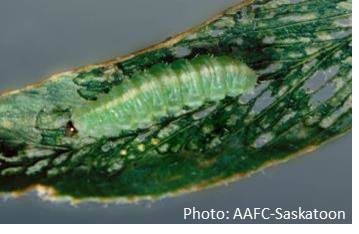
The larval stage of this weevil feeds on alfalfa leaves in a manner that characterizes the pest as a “skeletonizer”. The green larva featuring a dorsal, white line down the length of its body has a dark brown head capsule and will grow to 9mm long.
Use the photo below as a visual reference to identify alfalfa weevil larvae. Note the white dorsal line, the tapered shape of the abdomen and the dark head capsule.
Alfalfa growers are encouraged to check the Alfalfa Weevil Fact Sheet prepared by Dr. Julie Soroka (AAFC-Saskatoon). Additional information can be accessed by reviewing the Alfalfa Weevil Page extracted from the “Field crop and forage pests and their natural enemies in western Canada – Identification and management field guide” (Philip et al. 2015). The guide is available in both a free English-enhancedor French-enhanced version.
Pea Leaf Weevil (Sitona lineatus) – The PLW model predicts that adults are beginning to fly. This is similar to model output based on long term (climate) data. Model output estimates that oviposition should begin in late May or early June (Fig. 1).
Figure 1. Predicted PLW phenology at Swift Current based on long term climate data.
Values are based on model simulations (April 1 – May 6).
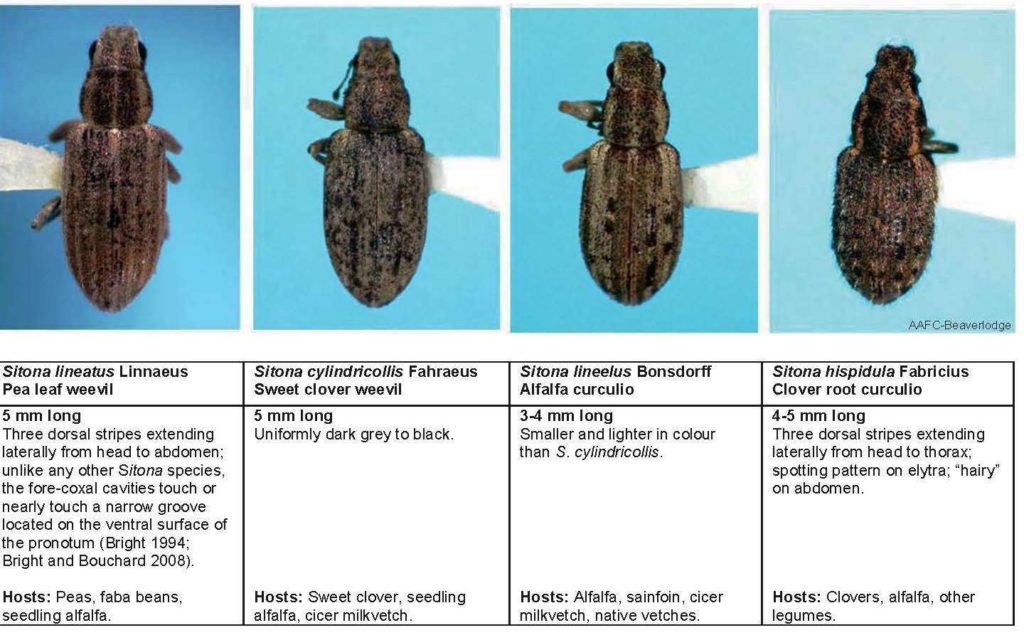
Pea leaf weevils emerge in the spring primarily by flying (at temperatures above 17ºC) or they may walk short distances. Pea leaf weevil movement into peas and faba beans is achieved primarily through flight. Adults are slender, greyish-brown measuring approximately 5 mm in length (Fig. 2, Left). The pea leaf weevil resembles the sweet clover weevil (Sitona cylindricollis) but the former is distinguished by three light-coloured stripes extending length-wise down thorax and sometimes the abdomen. All species of Sitona, including the pea leaf weevil, have a short snout.
Figure 2. Comparison images and descriptions of four Sitona species adults including pea leaf weevil (Left).
Adults will feed upon the leaf margins and growing points of legume seedlings (alfalfa, clover, dry beans, faba beans, peas) and produce a characteristic, scalloped (notched) edge. Females lay 1000 to 1500 eggs in the soil either near or on developing pea or faba bean plants from May to June.
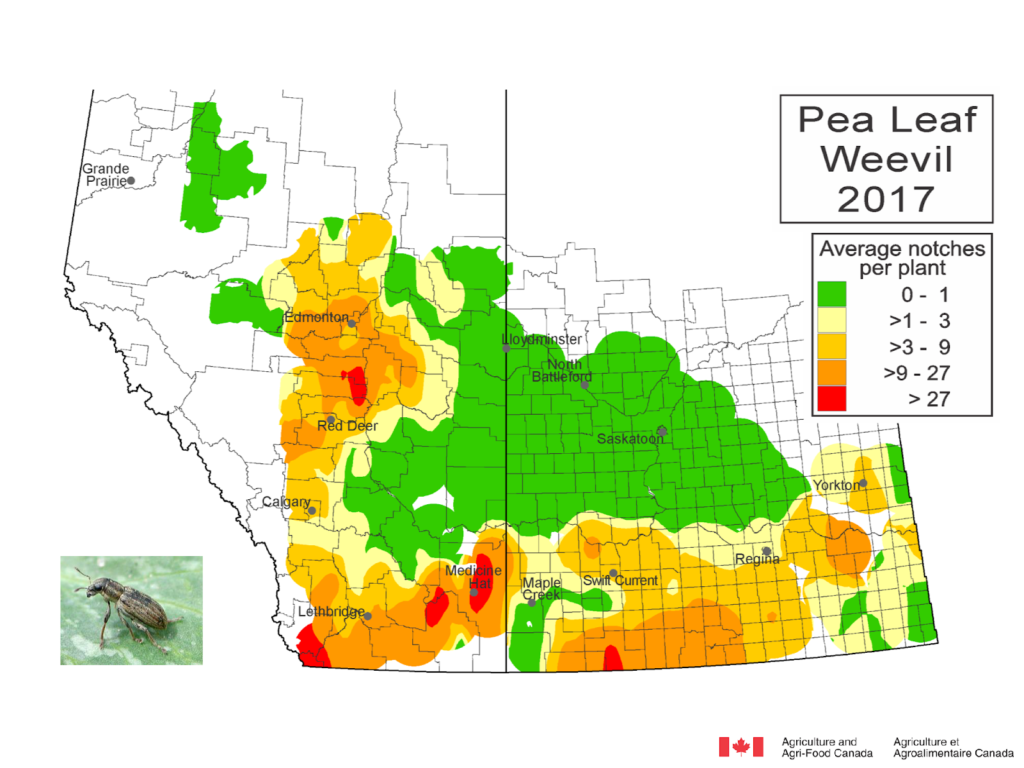
Reminder – The 2017 risk map for pea leaf weevils was released in March 2018. The map is based on the number of feeding notches observed in peas (Fig. 3).
Figure 3. Estimates of pea leaf weevil (S. lineatus) densities based on feeding notches observed in
peas grown in Alberta and Saskatchewan in 2017.
Biological and monitoring information related to pea leaf weevil in field crops is posted by the province of Alberta and in the PPMN monitoring protocol.
Grasshopper Simulation Model Output – The grasshopper simulation model will be used to monitor grasshopper development across the prairies. Weekly temperature data collected across the prairies is incorporated into the simulation model which calculates estimates of grasshopper development stages based on biological parameters for Melanoplus sanguinipes (Migratory grasshopper).
As of May 13, 2018, predicted mean egg development was 68% (62% last week) and model output indicates that embryological development was 5% greater than long term average. Greatest development was predicted to be across southern Alberta with potential for hatch occurring near Medicine Hat and Bow Island (Fig. 6).
Figure 1. Grasshopper (M. sanguinipes) embryological development (%) based on
model simulations for April 1-May 13, 2018.
Reminder – The Prairie Pest Monitoring Network’s 2018 Grasshopper Forecast Map was released in March (Fig. 2). Spring temperatures, soil moisture conditions, and precipitation all have an impact on survival of overwintered grasshopper eggs. Growers in areas highlighted orange or red in the map below should be vigilant this spring.
Bertha armyworm (Lepidoptera: Mamestra configurata) – Bertha armyworm pupal development is predicted below. The map illustrates that overwintered BAW are beginning to develop within their pupa located in the soil but are still several weeks away from emerging as moths.
Provincial entomologists provide insect pest updates throughout the growing season so we have attempted to link to their most recent information:
Manitoba’s Insect and Disease Update for 2018 will be posted soon. Watch for updates prepared by John Gavloski. Saskatchewan’s Crop Production News for 2018 will be posted soon. Watch for updates prepared by James Tansey and Carter Peru. Watch for Alberta Agriculture and Forestry’s Call of the Land for insect pest updates from Scott Meers. The most recent Call of the Land (posted on May 15, 2018) highlights the importance of wireworms in field crops and describes how growers can collaborate with AAFC entomologists (Dr. Haley Catton) by baiting grain fields in an effort to obtain wireworm specimens to further their research efforts.
It’s spring, so it’s cutworm season. This week’s insect is the darksided cutworm. Mature larvae are hairless, greyish with a prominent white stripe on either side just above their legs. It is a climbing cutworm with feeding occurring at night. They have a broad host range including cereals, canola, corn, flax, sunflower, vegetables berry and tree fruits.
Find out more about the darksided cutworm at the Insect of the Week page. Other important species include dingy, army, redbacked and pale western cutworms (See Insect of the Week: 2017 – May 1, 8, 15 and 29).
Darksided cutworm
Photocredit John Gavloski, Manitoba Ministry of Agriculture
In addition, Cutworm Pests of Crops on the Canadian Prairies – Identification and Management Field Guide was recently published (2017). This new handy manual has chapters on general biology, history of outbreaks, scouting techniques, natural enemies and general control options. The meat of the manual is descriptions of 24 cutworm species, their lifecycle, hosts, damage, monitoring and economic thresholds. To download a copy, go to the Cutworm Field Guide page.
Background. Agriculture and Agri-Food Canada (AAFC) and Environment and Climate Change Canada (ECCC) have been working together to study the potential of trajectories for monitoring insect movements since the late 1990’s. Trajectory models are used to deliver an early-warning system for the origin and destination of migratory invasive species, such as diamondback moth. In addition, plant pathologists have shown that trajectories can assist with the prediction of plant disease infestations and are also beginning to utilize these same data.
We receive two types of model output from ECCC: reverse trajectories (RT) and forward trajectories (FT): (i) Reverse trajectories refer to air currents that are tracked back in time from specified Canadian locations over a five-day period prior to their arrival date. Of particular interest are those trajectories that, prior to their arrival in Canada, originated over northwestern and southern USA and Mexico, anywhere diamondback moth populations overwinter and adults are actively migrating. If diamondback adults are present in the air currents that originate from these southern locations, the moths may be deposited on the Prairies at sites along the trajectory, depending on the local weather conditions at the time that the trajectories pass over our area (e.g. rain showers, etc.). RTs are the best available estimate of 3D wind fields at a specific point. They are based on observations, satellite and radiosonde data. (ii) Forward trajectories have a similar purpose; however, the modelling process begins at sites in USA and Mexico. The model output predicts the pathway of a trajectory. Again, of interest to us are the winds that eventually end up passing over the Prairies. Current Data
Pacific Northwest (PNW) –The number of RTs, predicted to cross the prairies, has increased over the past week (Fig. 1). Though there has been an increase, results for May 1-14 predicted that 38 PNW reverse trajectories (RT) have crossed the prairies. This total is less than the average number 107 (based on 2007-2017) and well below last year’s results (155).
Figure 1. Daily total of reverse trajectories (RT) originating over the Pacific Northwest that
have entered the prairies during April 2018.


