Weather synopsis – This past week (June 11 – 18, 2018), the average temperature (12.4 °C) was 1 °C cooler than long term average values (Fig. 1). The warmest weekly temperatures occurred across Manitoba. The 30-day (May 19-June 18, 2018) average temperature (13.1 °C) was approximately 1 °C warmer than long term average (Fig. 2).
Weekly and 30-day total precipitation was above average (Figs. 3 and 4). The wettest (30-day) region was across eastern areas in SK and western MB, while western Saskatchewan and most of Alberta are dry.
Accumulated precipitation for the growing season (April 01-June 19, 2018) is available from Agriculture and Agri-Food Canada (Fig. 5).
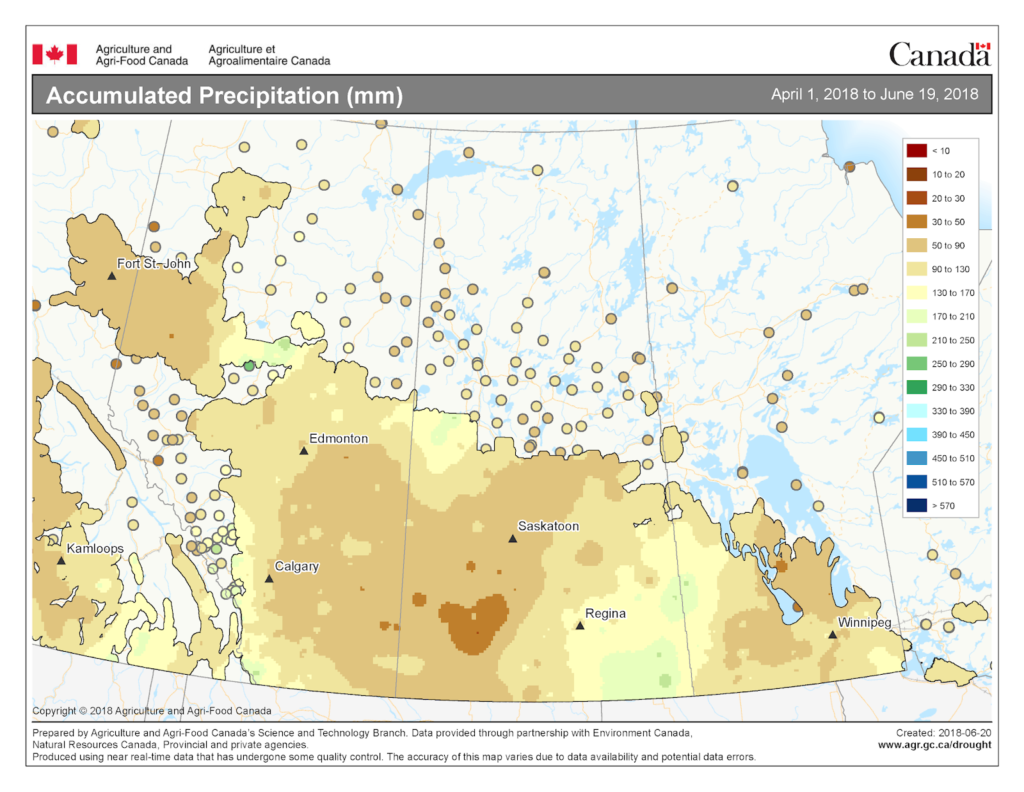
Image has not been reproduced in affiliation with, or with the endorsement of the Government of Canada and was retrieved (21Jun2018). Access the full map at http://www.agr.gc.ca/DW-GS/current-actuelles.jspx?lang=eng&jsEnabled=true&reset=1529635048320).
The map below reflects the Highest Temperatures occurring over the past 7 days (June 5-11, 2018) across the prairies and is available from Agriculture and Agri-Food Canada (Fig. 6).
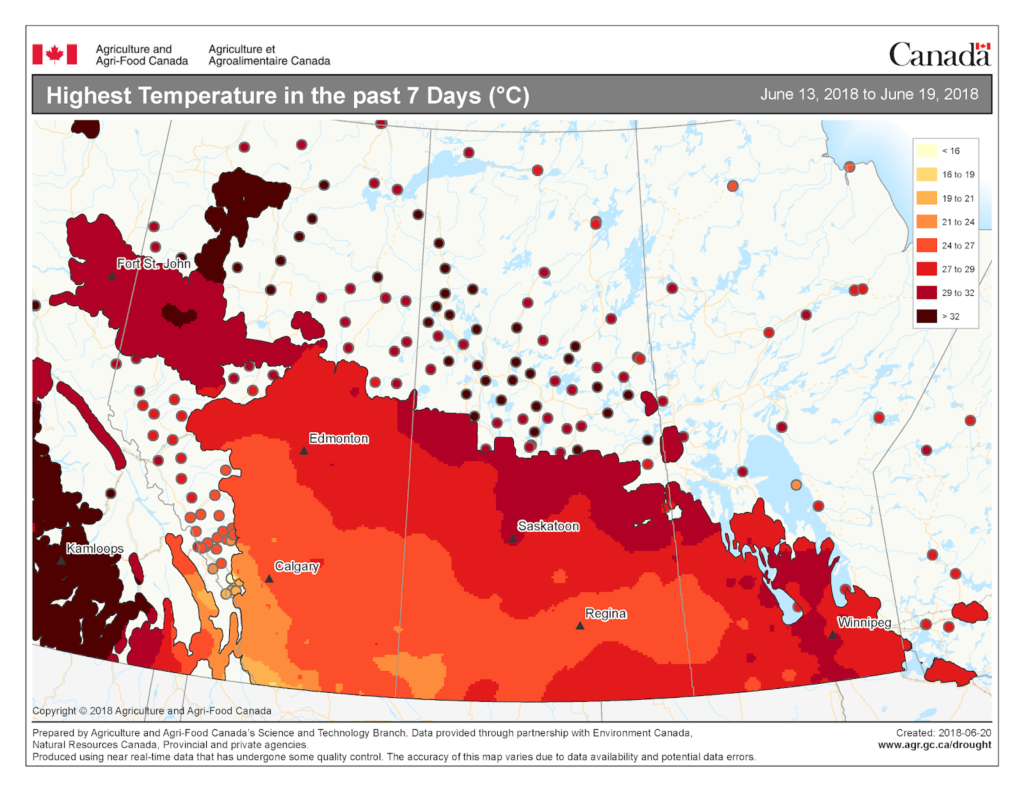
Image has not been reproduced in affiliation with, or with the endorsement of the Government of Canada and was retrieved (21Jun2018). Access the full map at http://www.agr.gc.ca/DW-GS/current-actuelles.jspx?lang=eng&jsEnabled=true&reset=1529635048320).
The map below reflects the Lowest Temperatures occurring over the past 7 days (June 5-11, 2018) across the prairies and is available from Agriculture and Agri-Food Canada (Fig. 7).
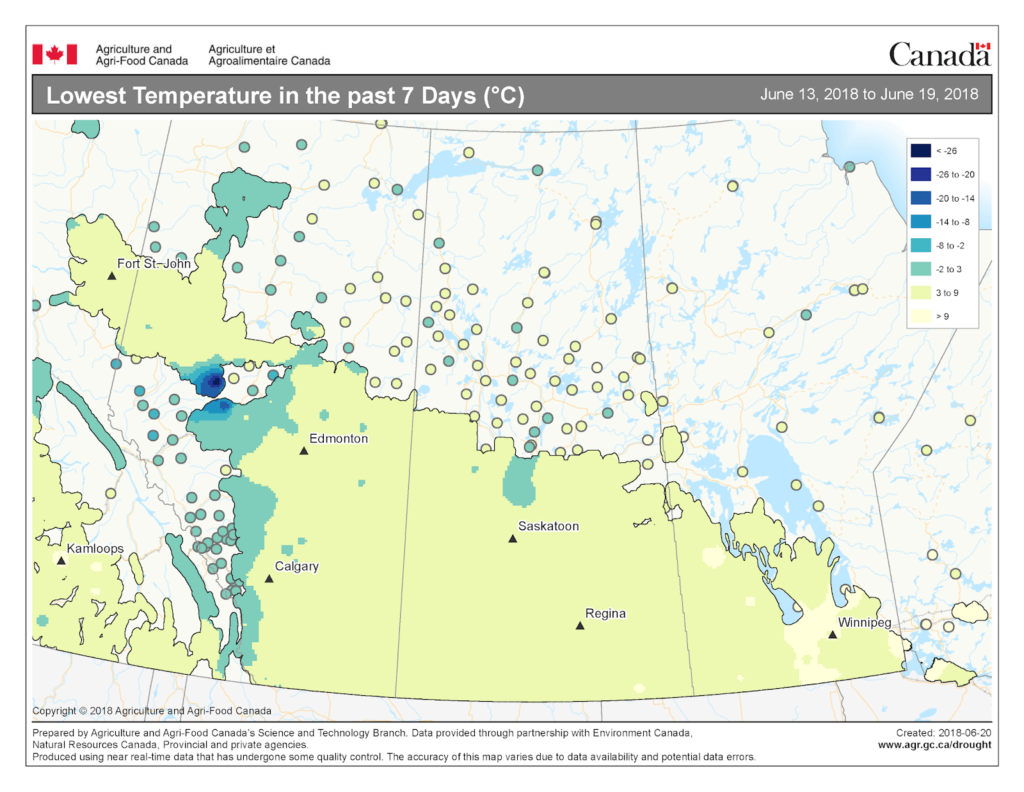
Image has not been reproduced in affiliation with, or with the endorsement of the Government of Canada and was retrieved (21Jun2018). Access the full map at http://www.agr.gc.ca/DW-GS/current-actuelles.jspx?lang=eng&jsEnabled=true&reset=1529635048320).
The growing degree day map (GDD) (Base 10ºC, March 1 – June 18, 2018) is below:
The growing degree day map (GDD) (Base 5ºC, March 1 – June 18, 2018) is below:
The maps above are all produced by Agriculture and Agri-Food Canada. Growers may wish to bookmark the AAFC Drought Watch Maps for the growing season.