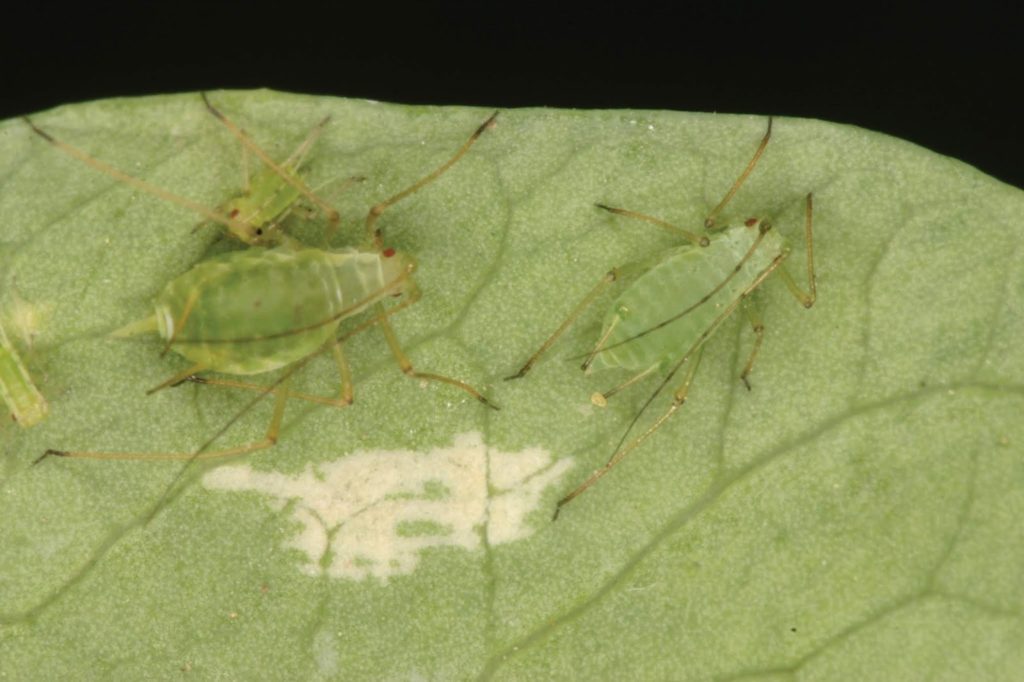
This week’s insect of the week is the pea aphid (Acyrthosiphon pisum). This long-legged, pear-shaped aphid is 3-4 mm long, light to dark green and each antennal segment is tipped by a black band. It feeds on field peas, alfalfa, broad beans, chickpeas, clover and lentils. Feeding damage can reduce yields due to lower seed formation and seed size. Leaves may turn yellow and overall plant growth can be delayed.
Pea aphids overwinter as eggs on the leaves and stems of perennial legumes (eg. clover or alfalfa crowns). They produce 2-3 generations asexually before winged females migrate to summer host crops where several more generations are produced. Winged sexual forms develop in late summer that mate and females return to winter host crops to lay eggs.
Ross Weiss, David Giffen, Owen Olfert and Meghan Vankosky
Categories
Week 9
Weather synopsis – This week staff have been busy surveying so we direct you to the AAFC Drought Watch maps in addition to the following updates.
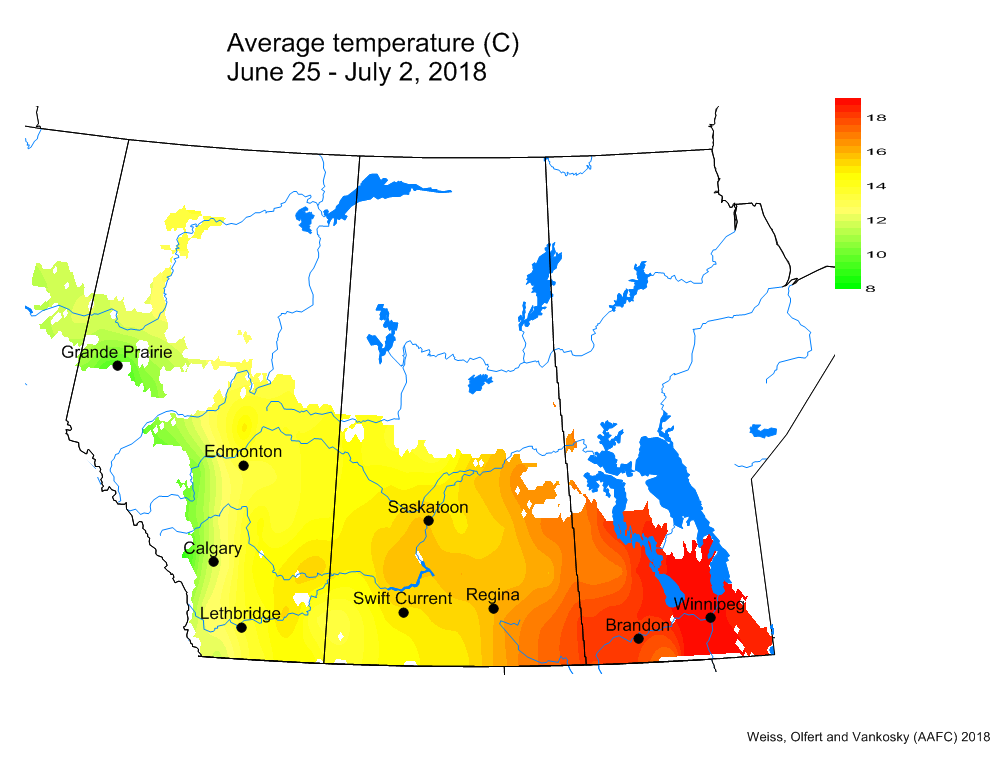
The average temperature (14.6 °C) this past week (June 25 – July 2, 2018) was almost 2 °C warmer than long term average values (Fig. 1).
Figure 1. Average temperature the past seven days (June 25-July 2, 2018).
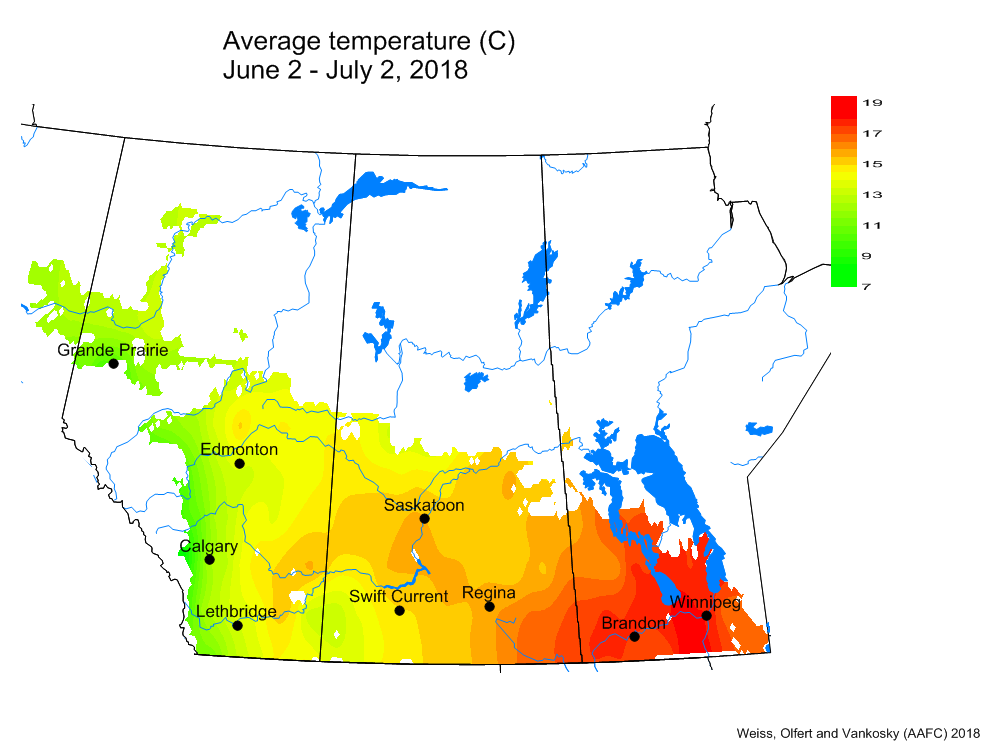
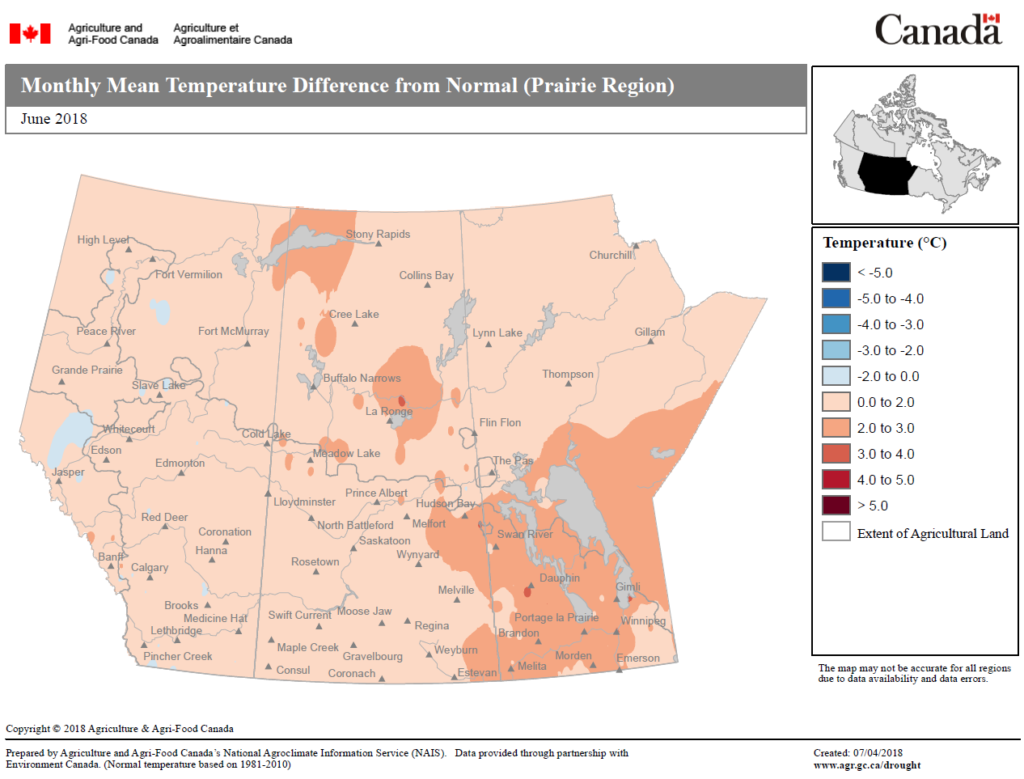
Once again, the warmest weekly temperatures occurred across MB. The 30-day (June 2-July 2) average temperature (14.3 °C) was approximately 0.5 °C warmer than long term average (Fig. 2). Average June temperatures were above normal across the entire prairie region (Fig. 3).
Figure 2. Average temperature the past 30 days (June 2-July 2, 2018).Figure 3. Monthly mean temperature differences from Normal for the month of June 2018. Image has not been reproduced in affiliation with, or with the endorsement of the Government of Canada and was retrieved (03Jul2018). Access the full map at http://www.agr.gc.ca/DW-GS/current-actuelles.jspx?lang=eng&jsEnabled=true&reset=1529635048320).
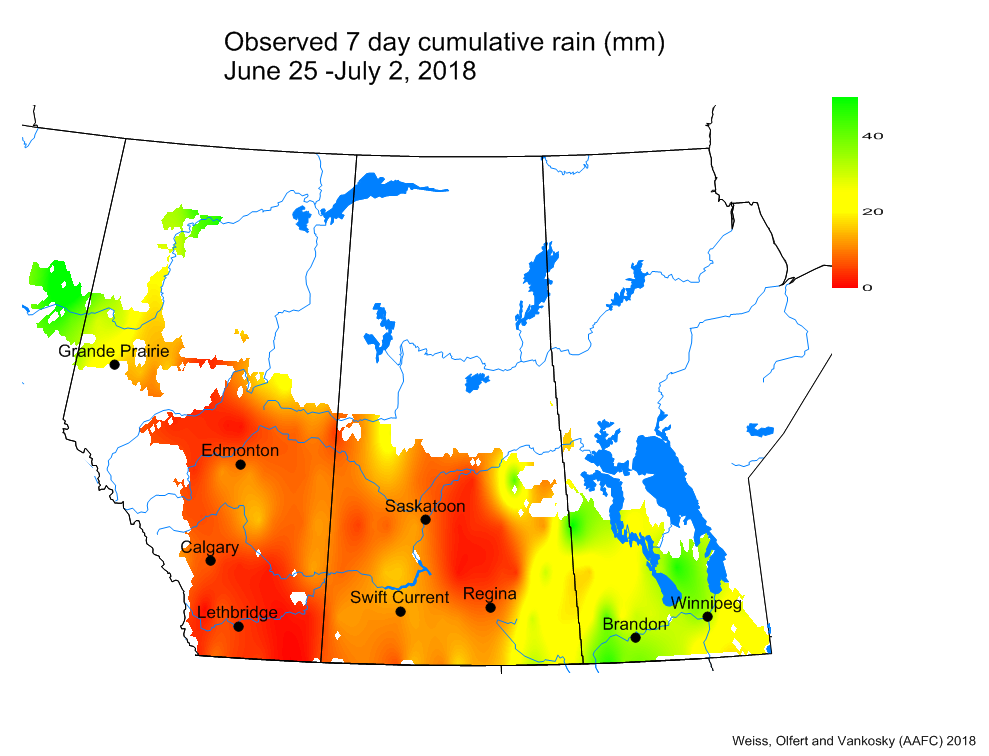
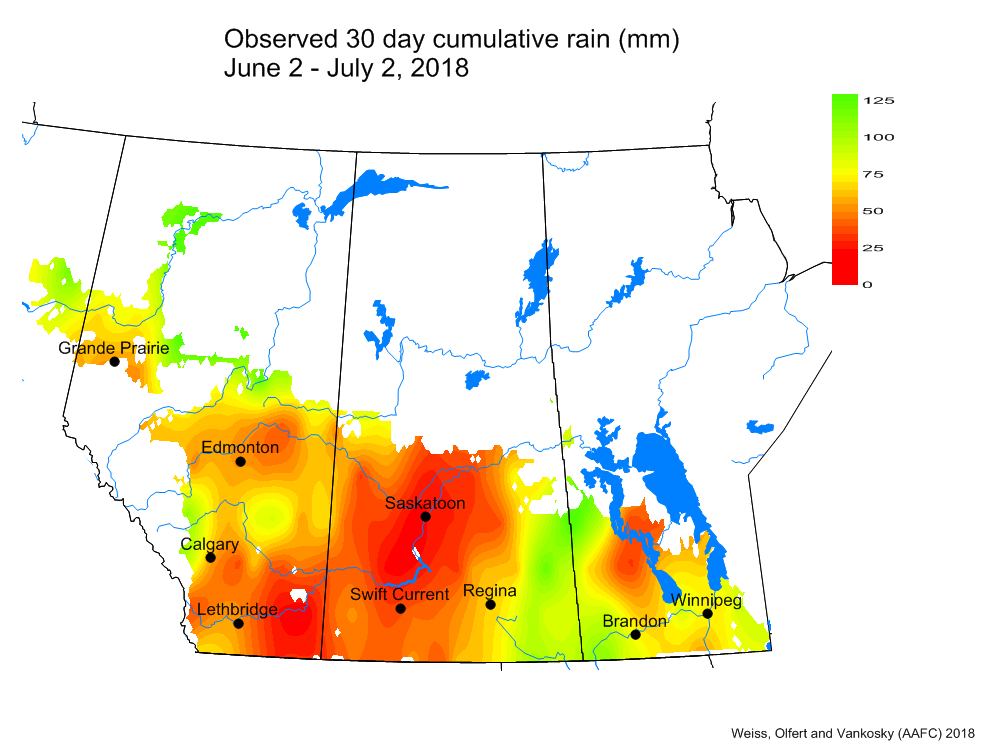
Weekly and 30-day total precipitation was slightly above average (Figs. 4 and 5). The wettest (30-day) region was across eastern areas in SK and southern MB, while western SK and most of AB continue to be dry.
Figure 4. Cumulative precipitation the past seven days (June 25-July 2, 2018).Figure 5. Cumulative precipitation the past 30 days (June 2-July 2, 2018).
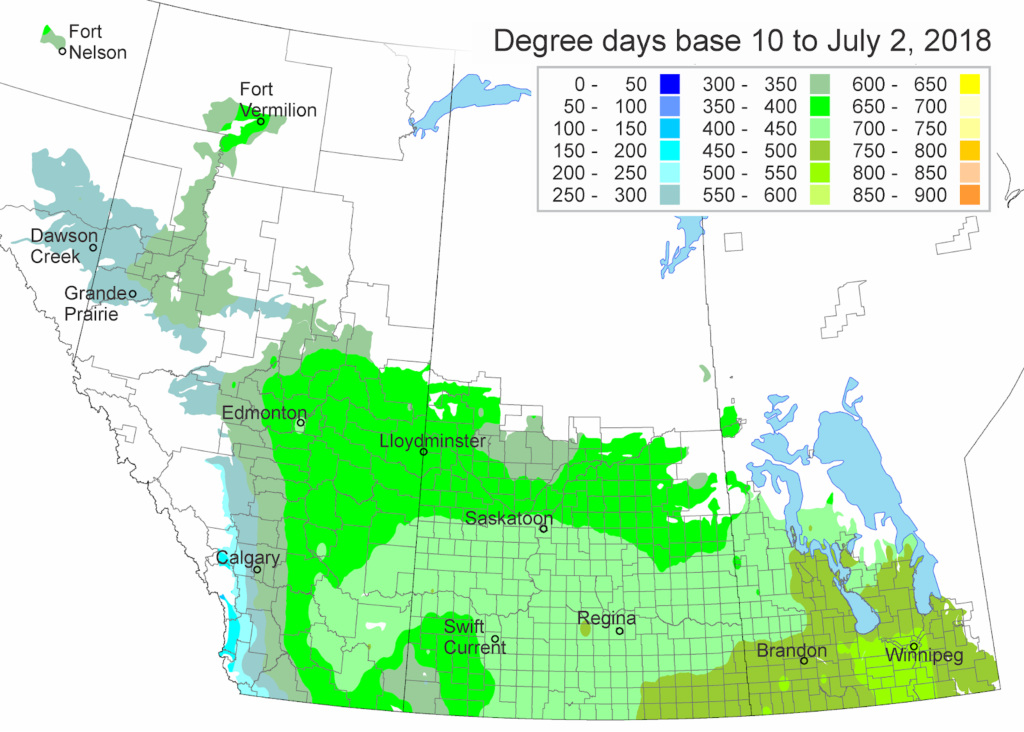
The growing degree day map (GDD) (Base 10ºC, March 1 – July 2, 2018) is below:
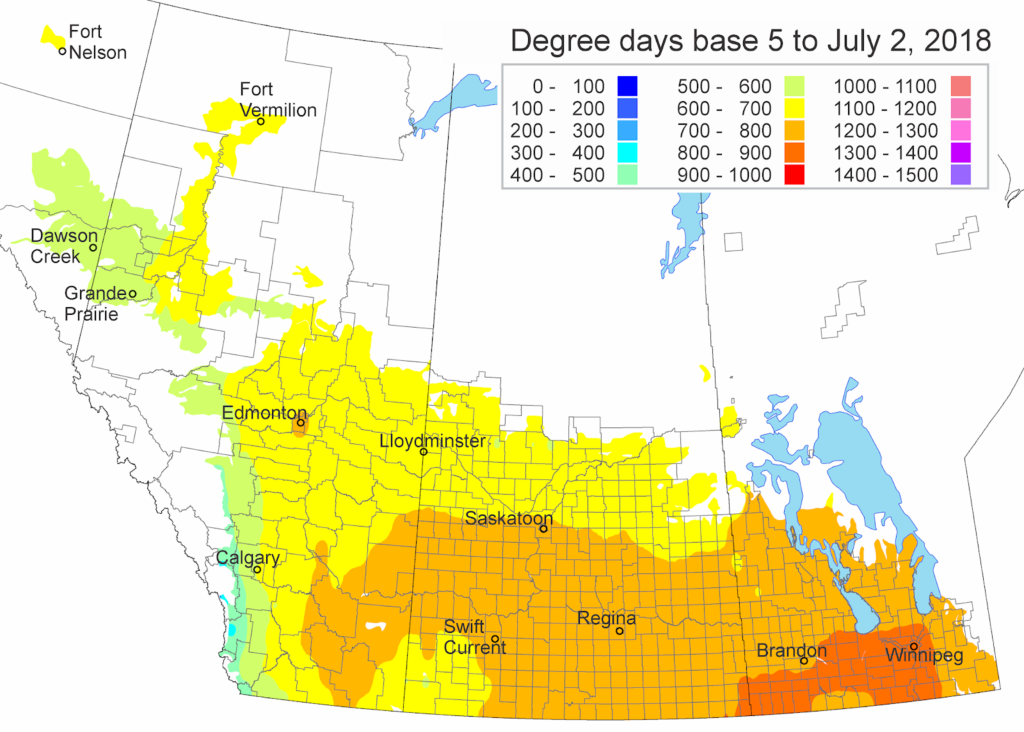
The growing degree day map (GDD) (Base 5ºC, March 1 – July 2, 2018) is below:
The maps above are all produced by Agriculture and Agri-Food Canada. Growers may wish to bookmark the AAFC Drought Watch Maps for the growing season.
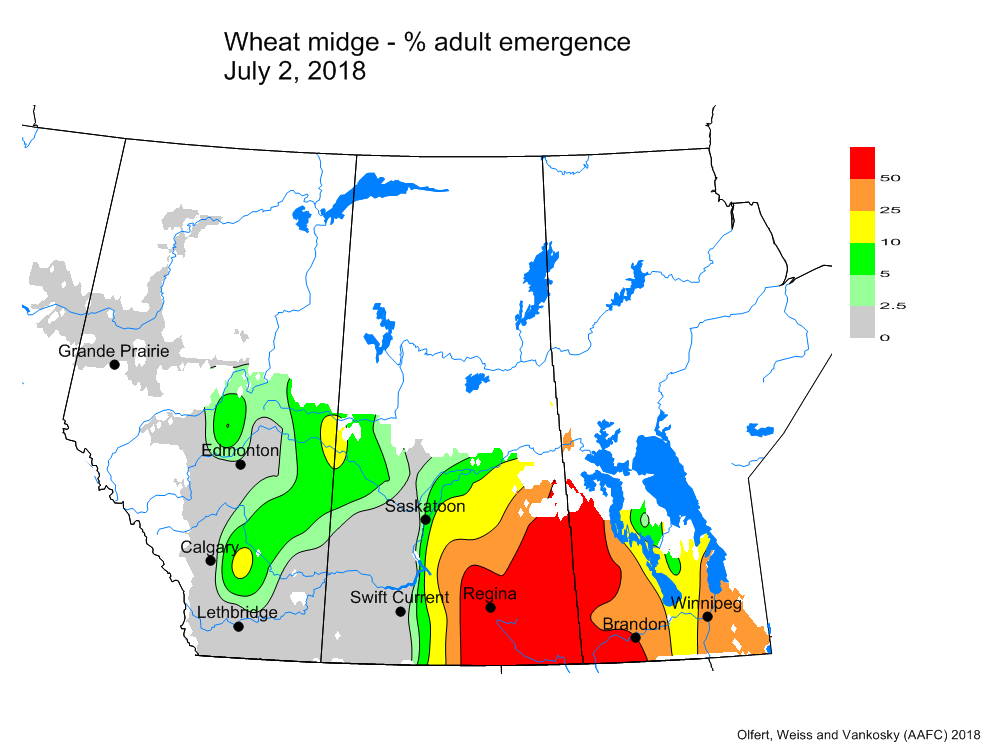
Wheat Midge (Sitodiplosis mosellana) – As of July 2, 2018, the warm, moist conditions in Manitoba are predicted to be favourable for emergence of wheat midge adults, while dry conditions in Alberta and Saskatchewan should result in delayed emergence (Fig. 1). Some populations may have greater than 50% emergence. Oviposition is predicted to have begun and larvae may be appearing in wheat heads.
Figure 1. Percent wheat midge adult emergence based on model simulations for April 1-July 2, 2018.
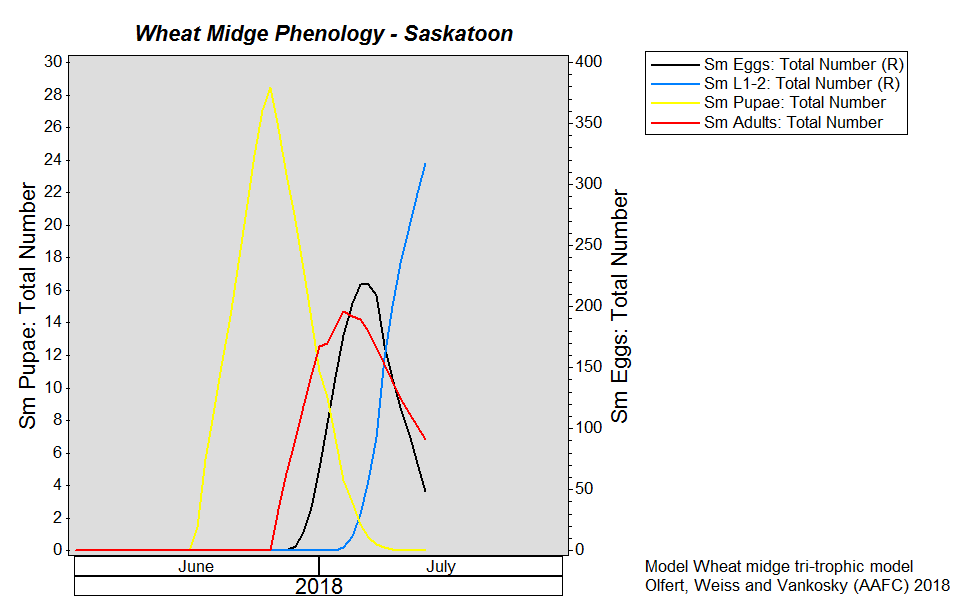
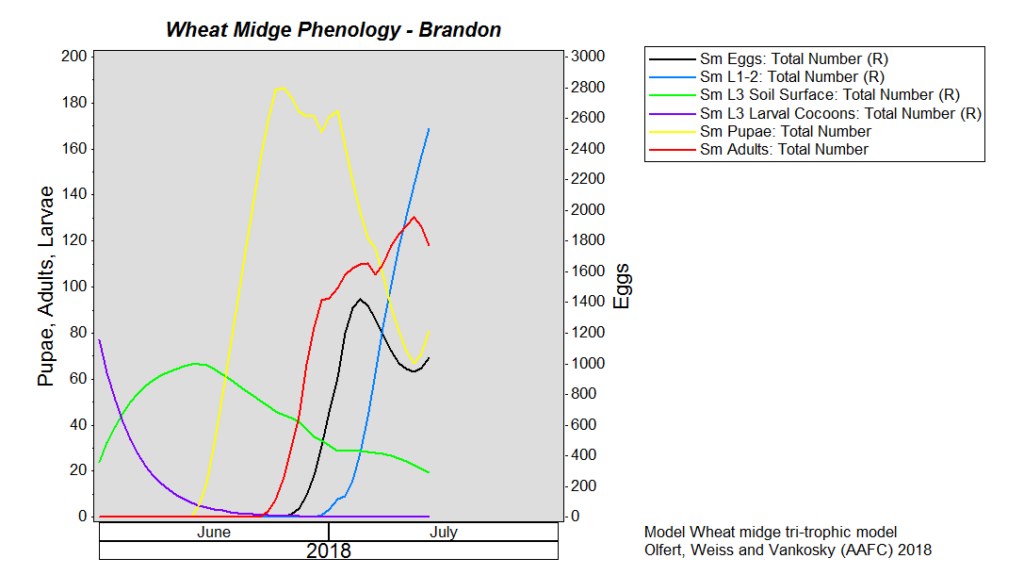
Model runs for Saskatoon SK (Fig. 2) indicate the midge emergence is slower than predicted emergence at Brandon MB (Fig. 3). The delay in midge emergence is related to dryer dryer conditions in June 2018 in Saskatchewan.
Figure 2. Predicted wheat midge phenology for April 1-July 2, 2018, at Saskatoon SK. Figure 3. Predicted wheat midge phenology for April 1-July 2, 2018, at Brandon MB.
Monitoring:
When monitoring wheat fields, pay attention to the synchrony between flying midge and anthesis.
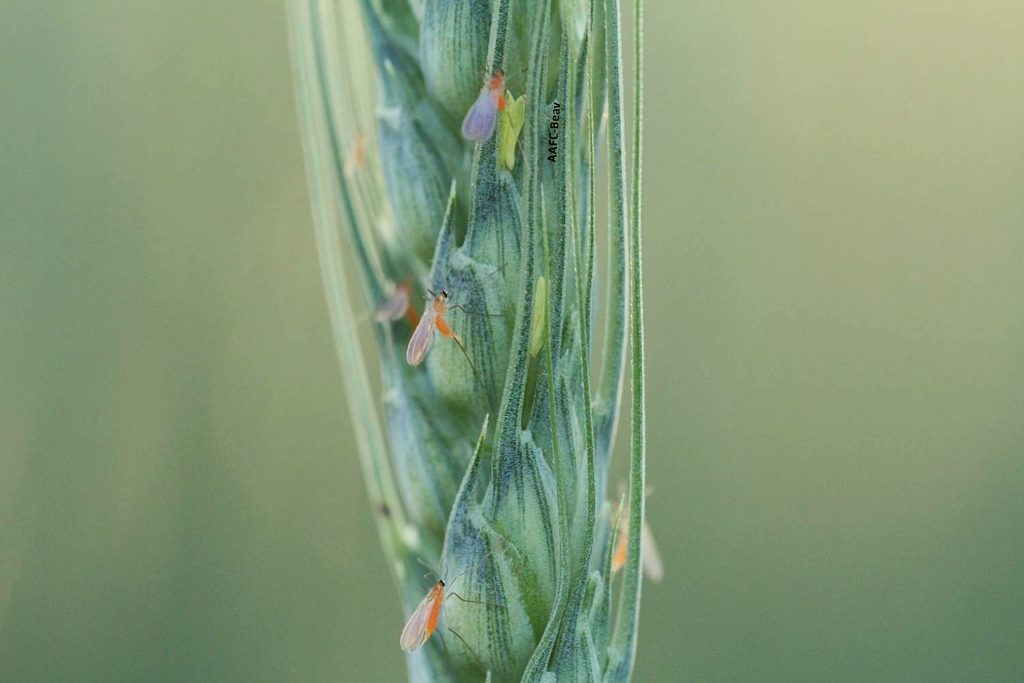
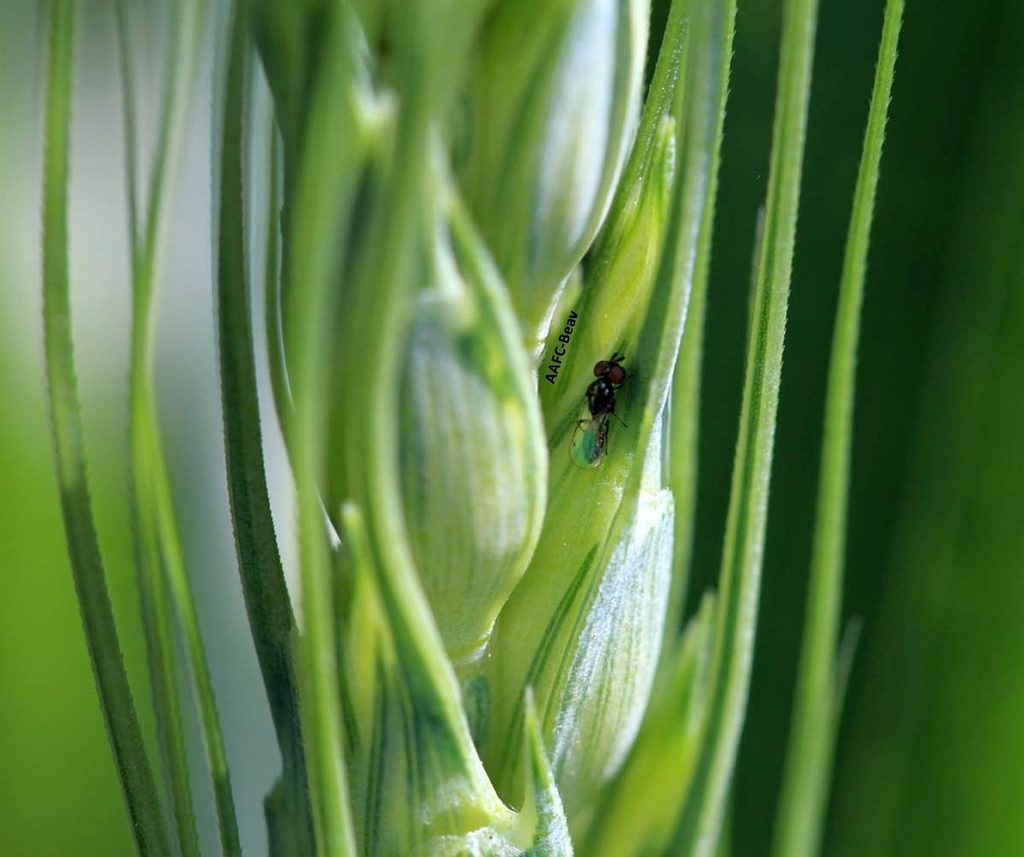
In-field monitoring for wheat midge should be carried out in the evening (preferably after 8:30 pm or later) when the female midges are most active. On warm (at least 15ºC), calm evenings, the midge can be observed in the field, laying their eggs on the wheat heads (photographed by AAFC-Beav-S. Dufton & A. Jorgensen below). Midge populations can be estimated by counting the number of adults present on 4 or 5 wheat heads. Inspect the field daily in at least 3 or 4 locations during the evening.
REMEMBER that in-field counts of wheat midge per head remain the basis of economic threshold decision. Also remember that the parasitoid, Macroglenes penetrans (photographed by AAFC-Beav-S. Dufton below), is actively searching for wheat midge at the same time. Preserve this parasitoid whenever possible and remember your insecticide control options for wheat midge also kill these beneficial insects which help reduce midge populations.
Economic Thresholds for Wheat Midge:
a) To maintain optimum grade: 1 adult midge per 8 to 10 wheat heads during the susceptible stage.
b) For yield only: 1 adult midge per 4 to 5 heads. At this level of infestation, wheat yields will be reduced by approximately 15% if the midge is not controlled.
Inspect the developing kernels for the presence of larvae and the larval damage.
Information related to wheat midge biology and monitoring can be accessed by linking to your provincial fact sheet (Saskatchewan Agriculture or Alberta Agriculture & Forestry). A review of wheat midge on the Canadian prairies was published by Elliott, Olfert, and Hartley in 2011. Additionally, more information can be found by accessing the pages from the new “Field Crop and Forage Pests and their Natural Enemies in Western Canada: Identification and Field Guide”. View ONLY the Wheat midge pages but remember the guide is available as a free downloadable document as both an English-enhanced or French-enhanced version.
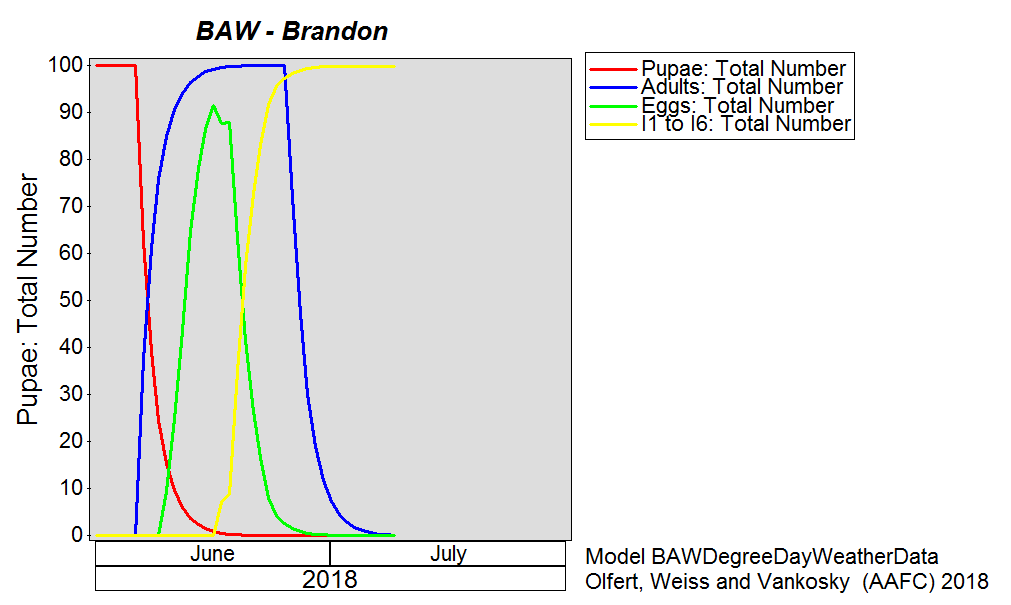
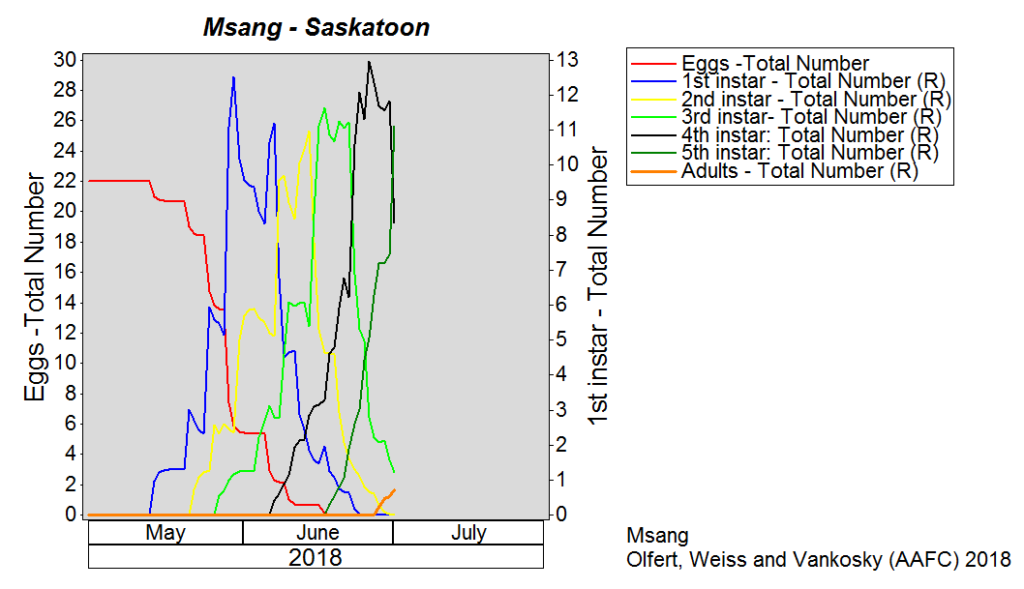
Bertha armyworm (Lepidoptera: Mamestra configurata) – BAW populations are predicted to be in the larval stages and may have begun feeding within the plant canopy on leaves. Figure 1 illustrates that BAW oviposition is complete and that the population is in the larval stage for populations near Brandon (Fig. 1).
Figure 1. Predicted BAW phenoloyg at Brandon MB. Values are based on model simulations for April 1-July 2, 2018 (projected to July 10, 2018)
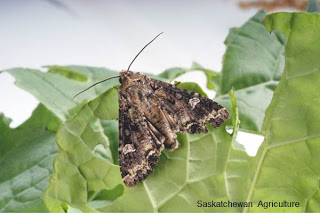
Many thanks to those who are checking a bertha armyworm pheromone trap on a weekly basis. Please use the reference photo below kindly shared by Saskatchewan Agriculture to aid your identification and reporting of trap interceptions. Note the kidney-bean white-patterned shape on each forewing but also know other cutworm species can resemble bertha armyworm moths. Check carefully and thanks for your help!
Monitoring:
Larval sampling should commence once the adult moths are noted.
Sample at least three locations, a minimum of 50 m apart.
At each location, mark an area of 1 m2 and beat the plants growing within that area to dislodge the larvae.
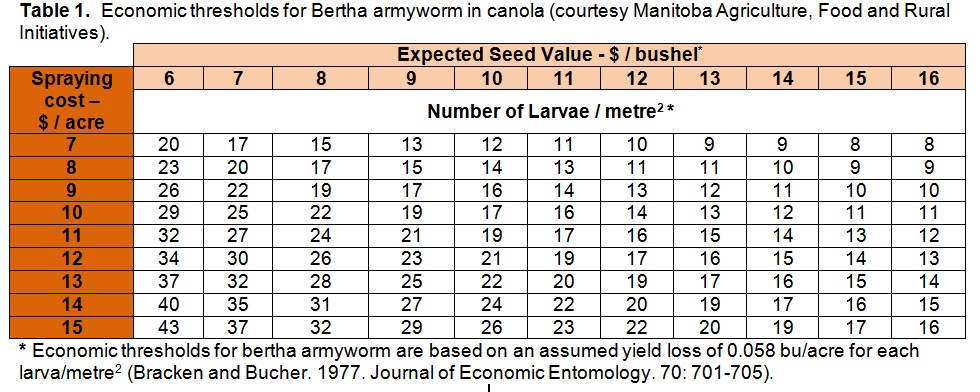
Count them and compare the average against the values in the economic threshold table below:
Scouting tips:
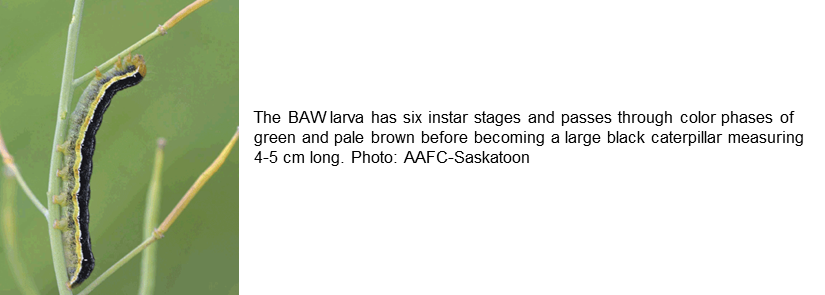
Some bertha armyworm larvae remain green or pale brown throughout their larval life.
Large larvae may drop off the plants and curl up when disturbed, a defensive behavior typical of cutworms and armyworms.
Young larvae chew irregular holes in leaves, but normally cause little damage. The fifth and sixth instar stages cause the most damage by defoliation and seed pod consumption. Crop losses due to pod feeding will be most severe if there are few leaves.
Larvae eat the outer green layer of the stems and pods exposing the white tissue.
At maturity, in late summer or early fall, larvae burrow into the ground and form pupae.
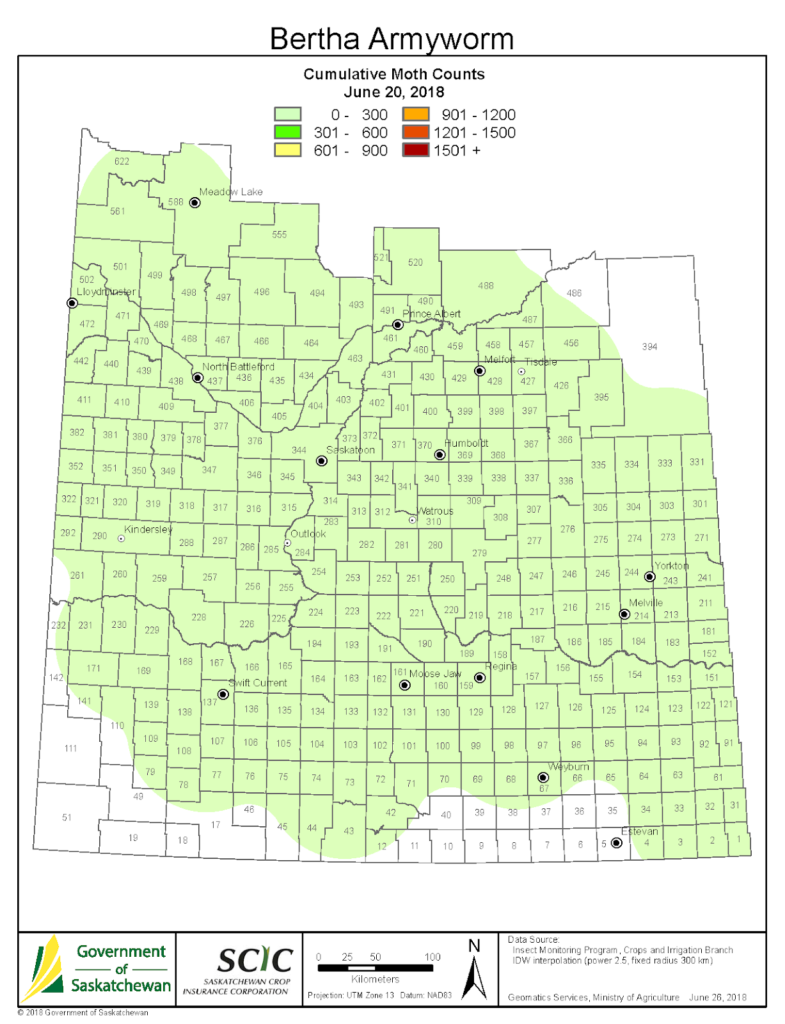
Keep track of the Provincial Entomologist Updates for the latest in-season pheromone trap monitoring results for 2018.
Saskatchewanians can view the latest pheromone trap interceptions below kindly provided by Saskatchewan Agriculture.
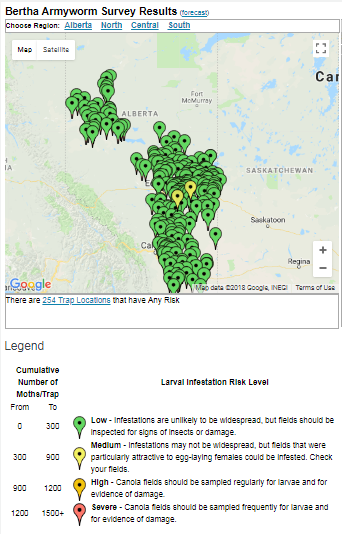
Albertans can access the online reporting map (screenshot retrieved 04Jul018 provided below for reference:
Grasshopper Simulation Model Output – The grasshopper simulation model will be used to monitor grasshopper development across the prairies. Weekly temperature data collected across the prairies is incorporated into the simulation model which calculates estimates of grasshopper development stages based on biological parameters for Melanoplus sanguinipes (Migratory grasshopper).
As of July 2, 2018, the predictive model output indicated that the average instar = 3.7, with 1st instar (5%), 2nd (12%), 3rd (24%), 4th (34%), 5th (23%), and 2.4% in the adult stage. The most rapid development occurred across southern MB and southeast SK (Fig. 1).
Figure 1. Grasshopper development (average instar stage) based on model simulations for April 1-July 2, 2018.
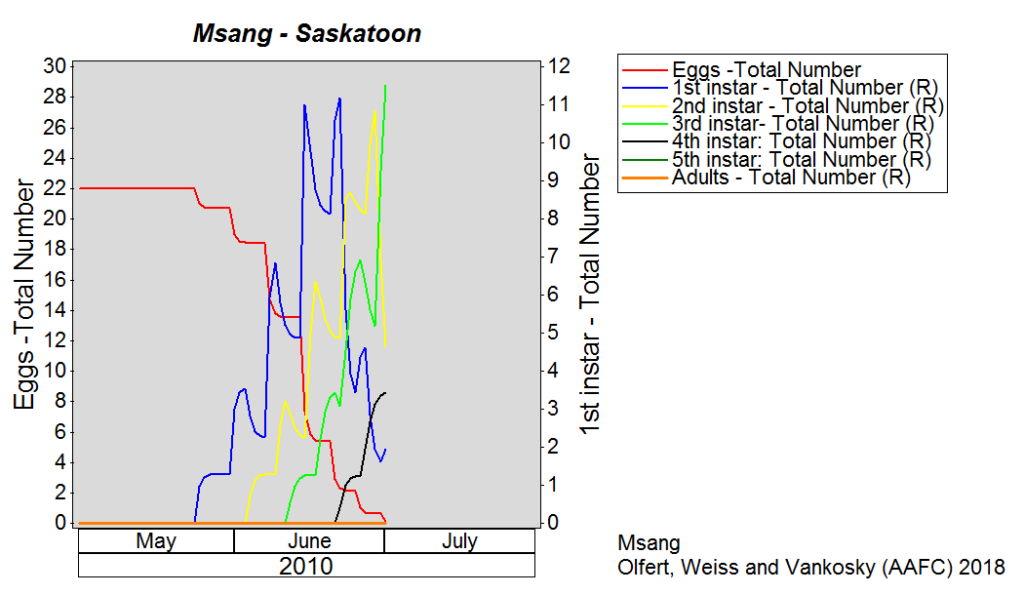
Model output for Saskatoon illustrates that populations are primarily in the 4th and 5th instars with appearance of a few adults (Fig. 2). By comparison, model output based on long-term climate data indicates that grasshopper populations should on average only be in the 3rd and 4th instars (Fig. 3).
Figure 2. Predicted grasshopper phenology at Saskatoon SK. Values are based on model simulations for April 1-July 2, 2018.Figure 3. Predicted grasshopper phenology at Saskatoon SK. Values are based on model simulations for Long Term Climate Normals.
Grasshopper Scouting Steps:
● Measure off a distance of 50 m on the level road surface and mark both starting and finishing points using markers or specific posts on the field margin.
● Starting at one end in either the field or the roadside and walk toward the other end of the 50 m making some disturbance with your feet to encourage any grasshoppers to jump.
● Grasshoppers that jump/fly through the field of view within a one meter width in front of the observer are counted.
● A meter stick can be carried as a visual tool to give perspective for a one meter width. However, after a few stops one can often visualize the necessary width and a meter stick may not be required. Also, a hand-held counter can be useful in counting while the observer counts off the required distance.
● At the end point the total number of grasshoppers is divided by 50 to give an average per meter. For 100 m, repeat this procedure.
● Compare counts to the following damage levels associated with pest species of grasshoppers:
0-2 per m² – None to very light damage
2-4 per m² – Very light damage
4-8 per m² – Light damage
8-12 per m² – Action threshold in cereals and canola
12-24 per m² – Severe damage
>24 per m² – Very severe damage
* For lentils at flowering and pod stages, >2 per m² will cause yield loss.
* For flax at boll stages, >2 per m² will cause yield loss.
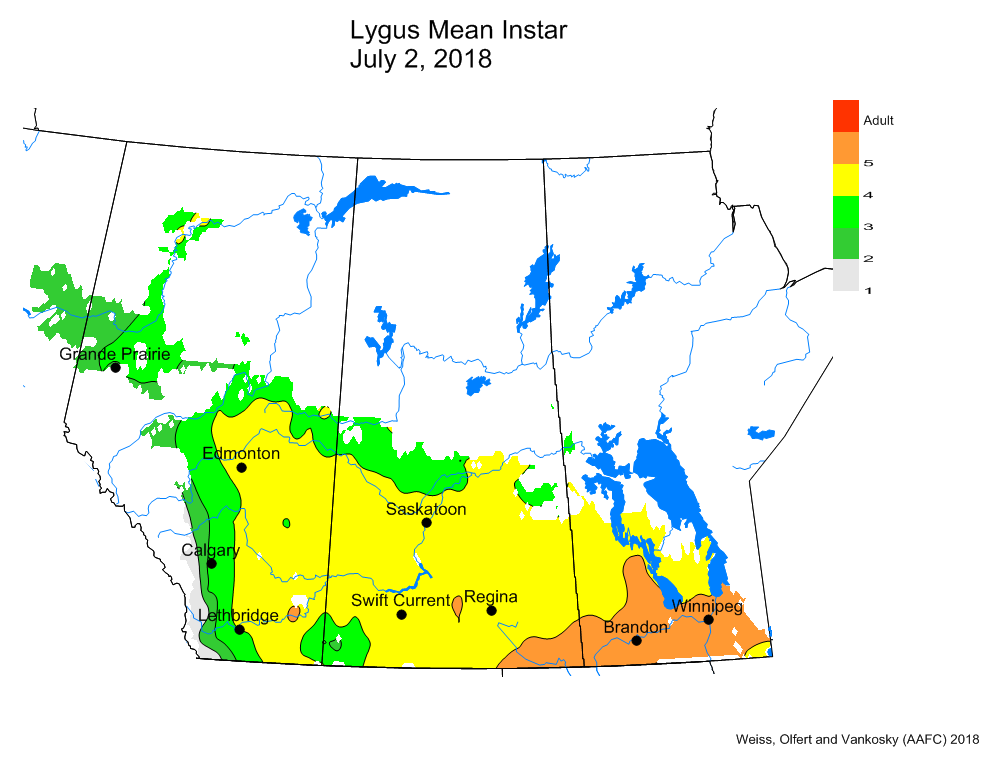
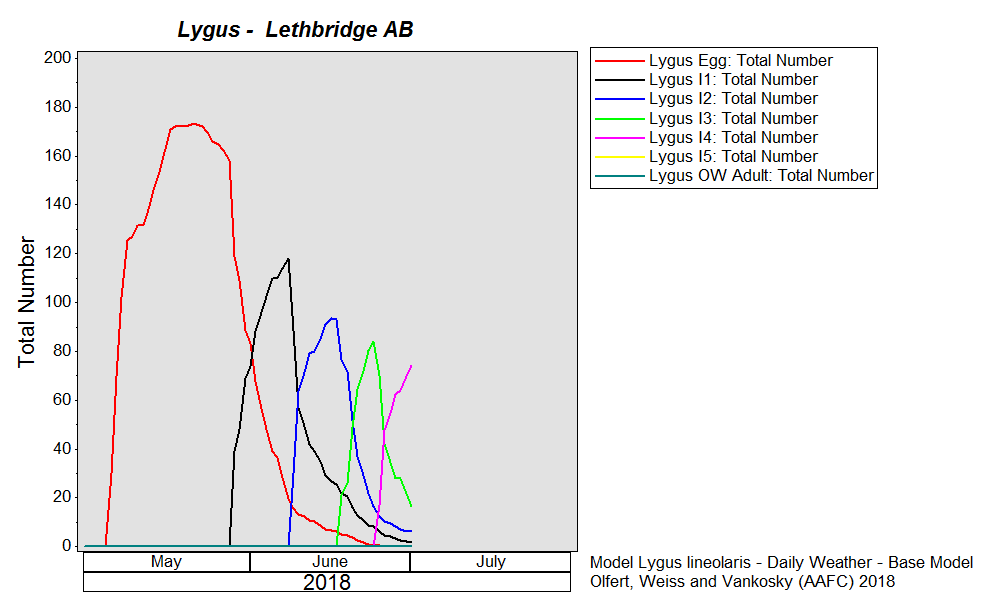
Lygus bugs (Lygus spp.) – As of July 2, 2018, the model indicates the Lygus populations range from the 1st instar stage to adults with most of the population being at the 4th and 5th instar stages (Fig. 1). Warmer temperatures have resulted in rapid development in southern Manitoba and southeast Saskatchewan.
Figure 1. Predicted Lygus development (average instar stage) based on model simulations for April 1-July 2, 2018.
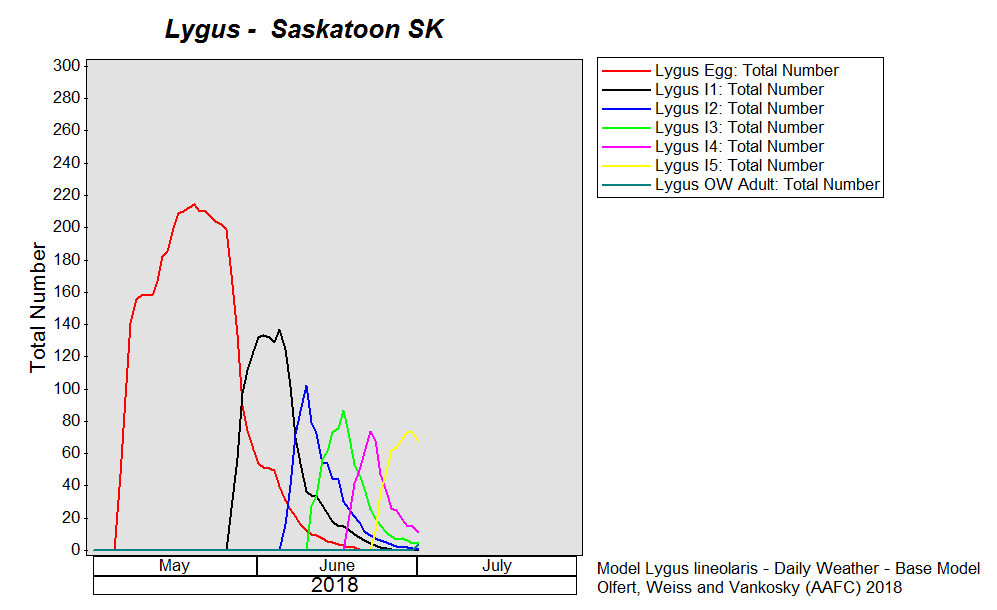
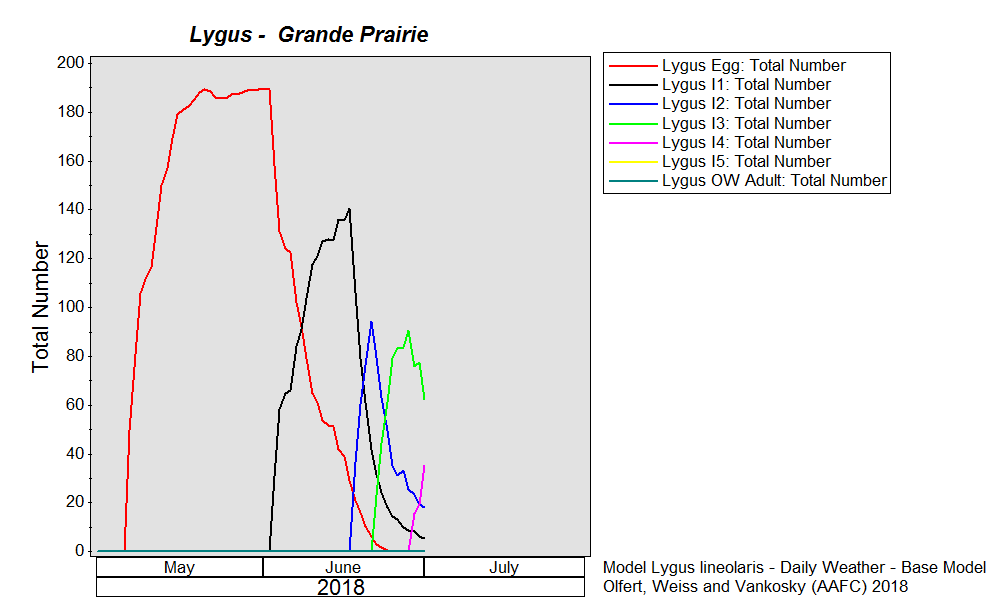
This week, model runs were conducted for Saskatoon, Lethbridge and Grande Prairie to compare site specific development. The Lygus model output suggests that Saskatoon populations should be primarily be in the 3-5th instar stages (Fig. 2) with development predicted to be marginally slower in Lethbridge (Fig. 3). Populations near Grande Prairie are predicted to be in the 3rd instar stage (Fig. 4).
Figure 2. Predicted Lygus phenology for April 1-July 2, 2018, for Saskatoon SK.Figure 3. Predicted Lygus phenology for April 1-July 2, 2018, for Grande Prairie AB.Figure 4. Predicted Lygus phenology for April 1-July 2, 2018, for Lethbridge AB.
Remember – The economic threshold for Lygus in canola is applied at late flower and early pod stages.
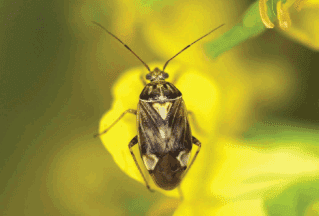
Adult L. lineolaris (5-6 mm long) (photo: AAFC-Saskatoon).
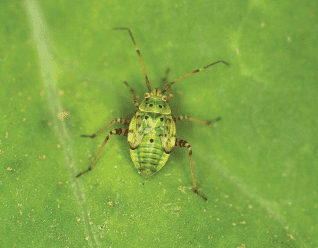
Fifth instar lygus bug nymph (3-4 mm long) (photo: AAFC-Saskatoon).
Damage: Lygus bugs have piercing-sucking mouthparts and physically damage the plant by puncturing the tissue and sucking plant juices. The plants also react to the toxic saliva that the insects inject when they feed. Lygus bug infestations can cause alfalfa to have short stem internodes, excessive branching, and small, distorted leaves. They feed on buds and blossoms and cause them to drop. They also puncture seed pods and feed on the developing seeds causing them to turn brown and shrivel.
Begin monitoring canola when it bolts and continue until seeds within the pods are firm. Since adults can move into canola from alfalfa, check lygus bug numbers in canola when nearby alfalfa crops are cut.
Sample the crop for lygus bugs on a sunny day when the temperature is above 20°C and the crop canopy is dry. With a standard insect net (38 cm diameter), take ten 180° sweeps. Count the number of lygus bugs in the net.
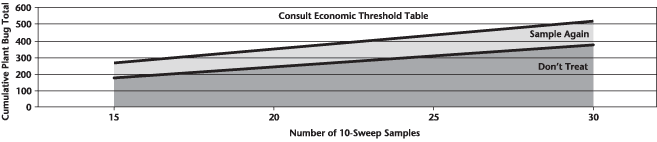
Repeat the sampling in another 14 locations. Samples can be taken along or near the field margins. Calculate the cumulative total number of lygus bugs and then consult the sequential sampling chart (Figure C). If the total number is below the lower threshold line, no treatment is needed. If the total is below the upper threshold line, take more samples. If the total is on or above the upper threshold line, calculate the average number of lygus bugs per 10-sweep sample and consult the economic threshold table.
Sequential sampling for lygus bugs at late flowering stage in canola.
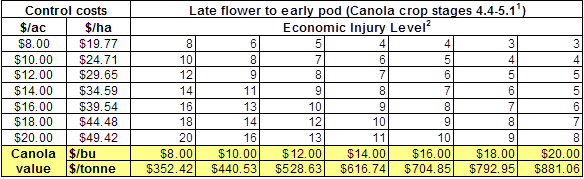
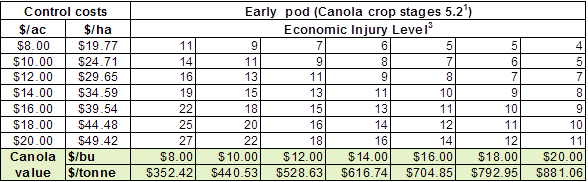
The economic threshold for lygus bugs in canola covers the end of the flowering (Table 1) and the early pod ripening stages (Table 2). Once the seeds have ripened to yellow or brown, the cost of controlling lygus bugs may exceed the damage they will cause prior to harvest, so insecticide application is not warranted.
Remember that insecticide applications at bud stage in canola have not been proven to result in an economic benefit in production. The exception to this is in the Peace River region where early, dry springs and unusually high densities of lygus bug adults can occasionally occur at bud stage. In this situation, high numbers of lygus bugs feeding on moisture-stressed canola at bud stage is suspected to result in delay of flowering so producers in that region must monitor in fields that fail to flower as expected.
Table 1. Economic thresholds for lygus bugs in canola at late flowering and early pod stages (Wise and Lamb 1998).
1 Canola crop stage estimated using Harper and Berkenkamp 1975). 2 Economic thresholds are based on an assumed loss of 0.1235 bu/ac per lygus bug caught in 10 sweeps (Wise and Lamb. 1998. The Canadian Entomologist. 130: 825-836).
Table 2. Economic thresholds for lygus bugs in canola at pod stage (Wise and Lamb 1998).
3 Economic thresholds are based on an assumed loss of 0.0882 bu/ac per lygus bug caught in 10 sweeps (Wise and Lamb. 1998. The Canadian Entomologist. 130: 825-836).
Biological and monitoring information related to Lygus in field crops is posted by the provinces of Manitoba or Alberta fact sheets or the Prairie Pest Monitoring Network’s monitoring protocol. Also refer to the Lygus pages within the new “Field Crop and Forage Pests and their Natural Enemies in Western Canada: Identification and management field guide” – both English-enhanced or French-enhanced versions are available.
Provincial entomologists provide insect pest updates throughout the growing season so we link to their most recent information:
Manitoba‘s Insect and Disease Updates for 2018 can be accessed here. At posting time, specific updates (June 20, and 27) would not open on the Manitoba website – please keep trying though!
Alberta Agriculture and Forestry’s Call of the Land regularly includes insect pest updates from Scott Meers. The most recent Call of the Land (posted July 4, 2018, by Mark Cutts) highlights the importance of field scouting now. You can review the Weekly Insect Update (posted by Scott Meers on June 21, 2018) noting that bertha armyworm moths were detected this first week of pheromone monitoring (check online map), onset of flowering in canola signalling the need for in-field monitoring for cabbage seedpod weevil, continued grasshopper calls from the south and advice to scout now while nymphs are easier to manage, Nutall’s blister beetle transiently showing up in some fields (blister beetle post), and the presence of the beneficial stiletto fly larvae which is a predator within the soil profile and targets wireworm larvae.
If you haven’t downloaded the FREE field guide yet, please do so now!
Field Crop and Forage Pests and their Natural Enemies in Western Canada: IDENTIFICATION AND MANAGEMENT FIELD GUIDE
The 152-page, full-colour field guide, now available online, is designed to help you make informed decisions in managing over 90 harmful pests of field and forage crops in Western Canada. Better decision making helps save time and effort and eliminates unnecessary pesticide applications to improve your bottom line. The guide also helps the reader identify many natural enemies that prey on or parasitize pest insects. Recognizing and fostering populations of natural enemies will enhance their role in keeping or reducing pest populations below economic levels.