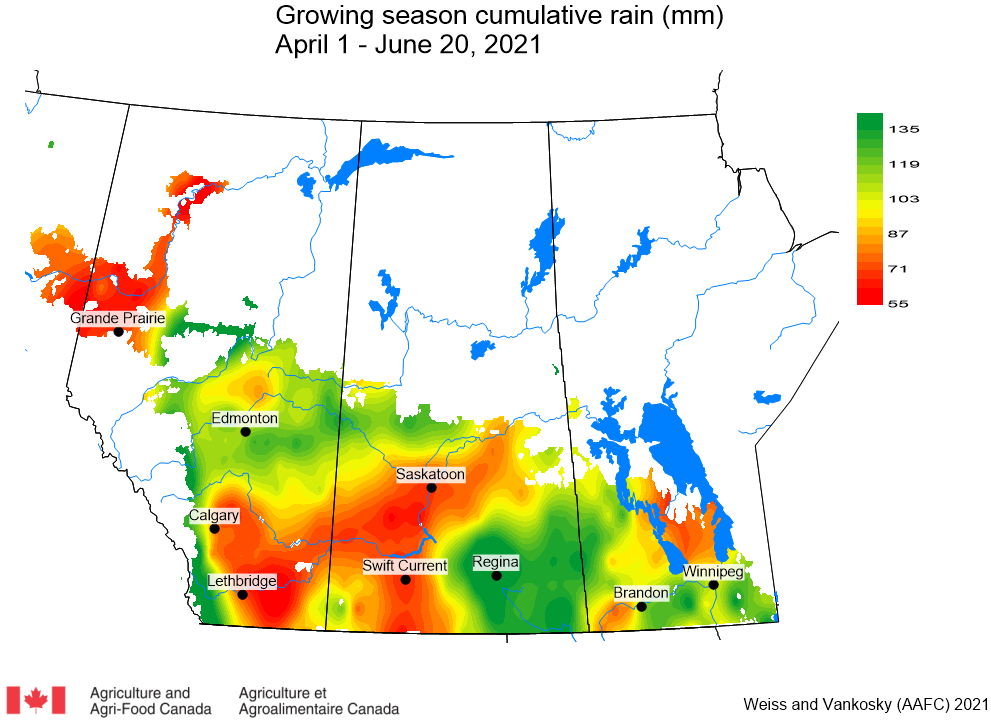
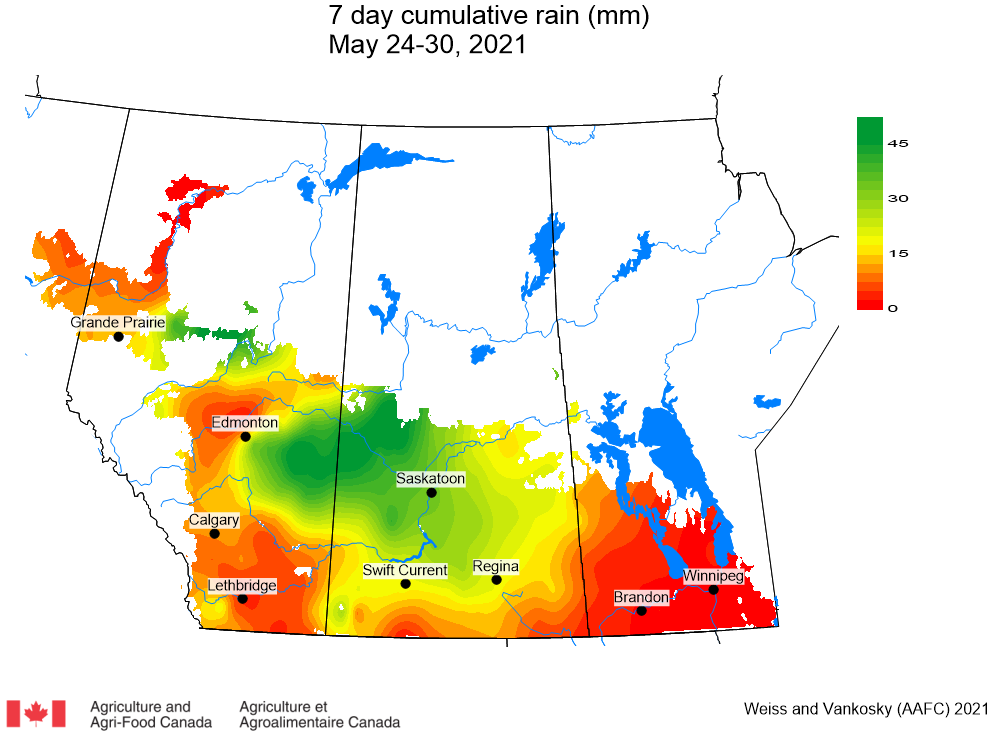
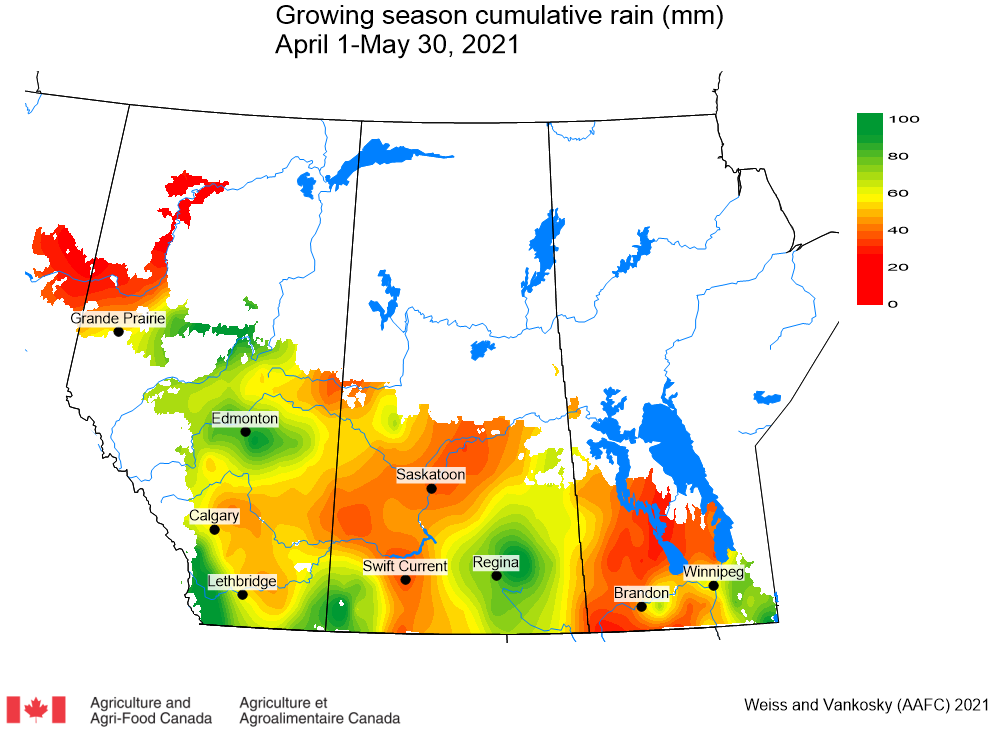
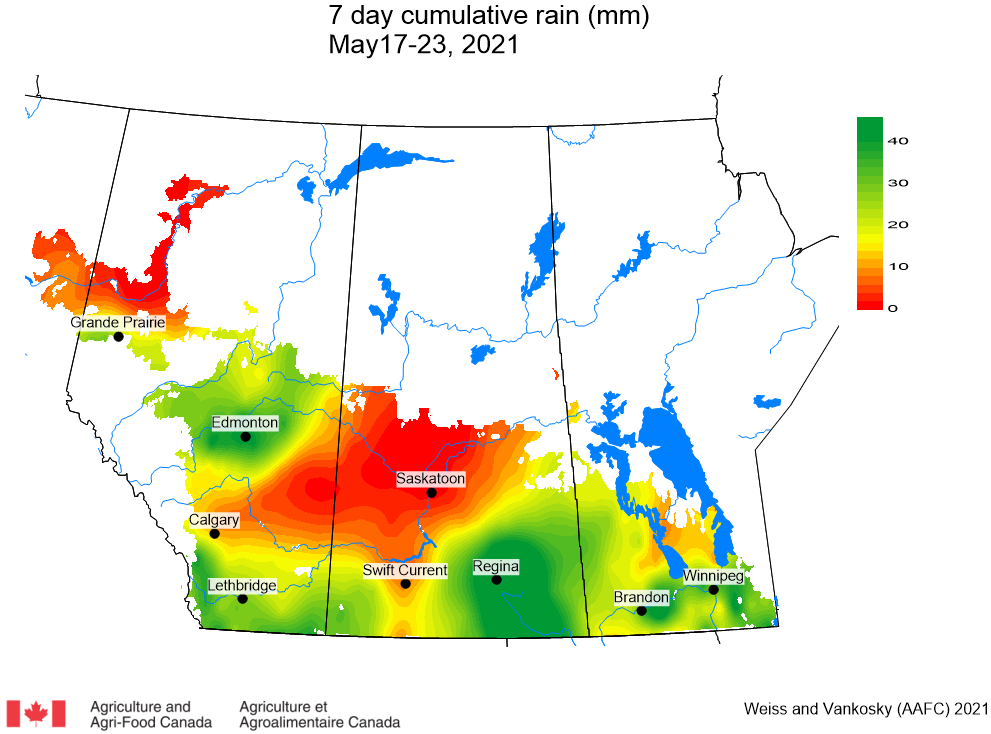
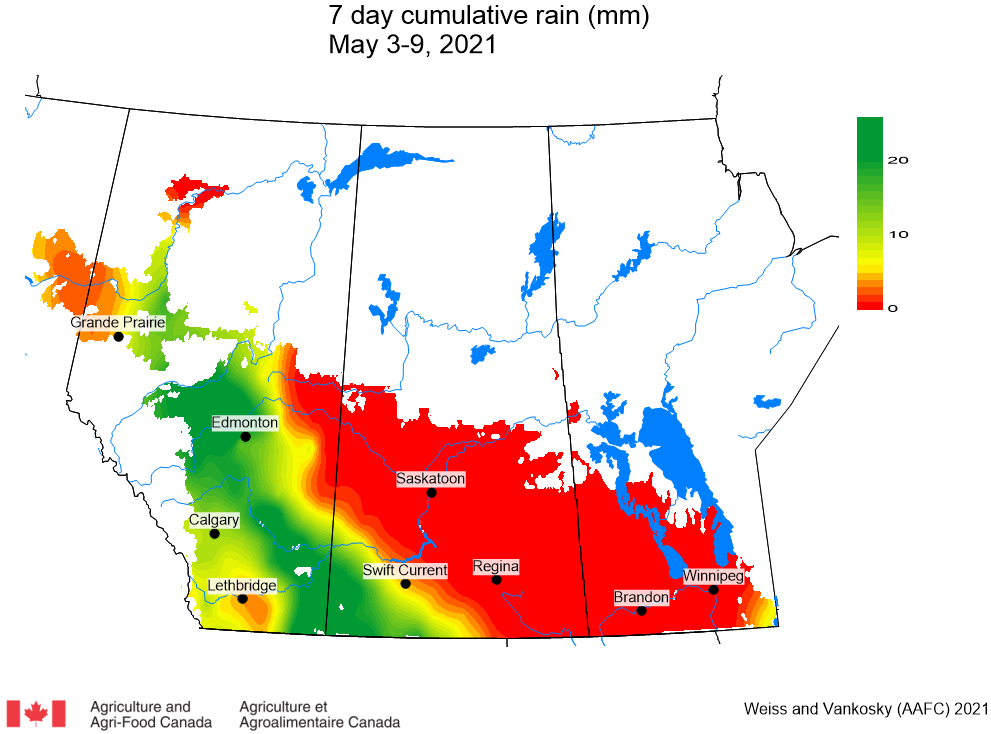
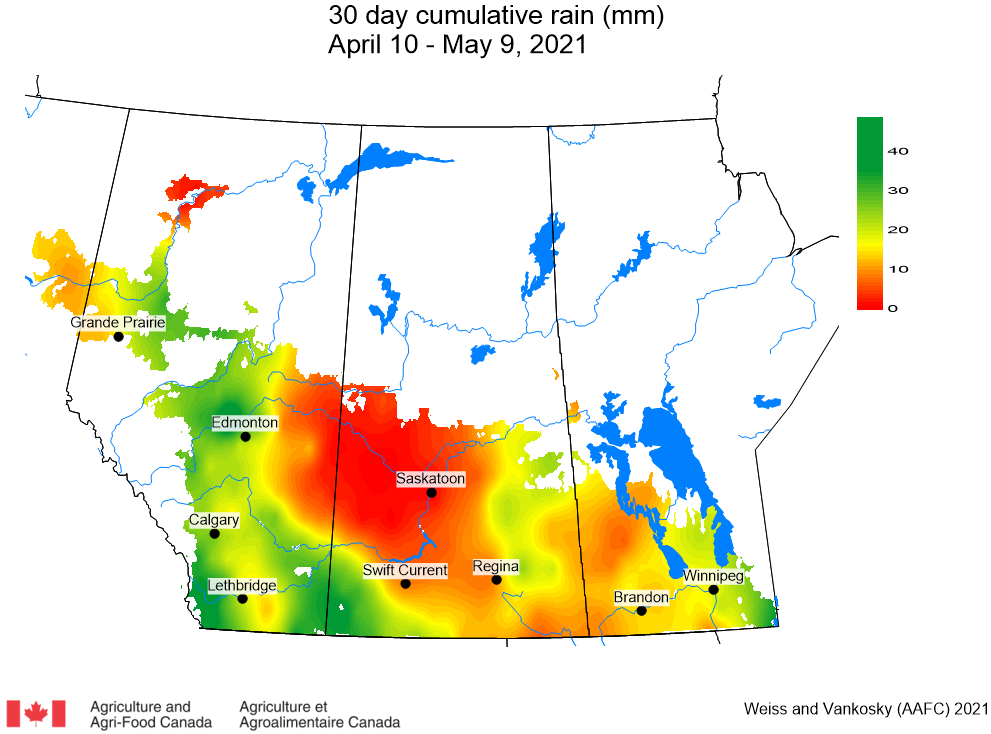
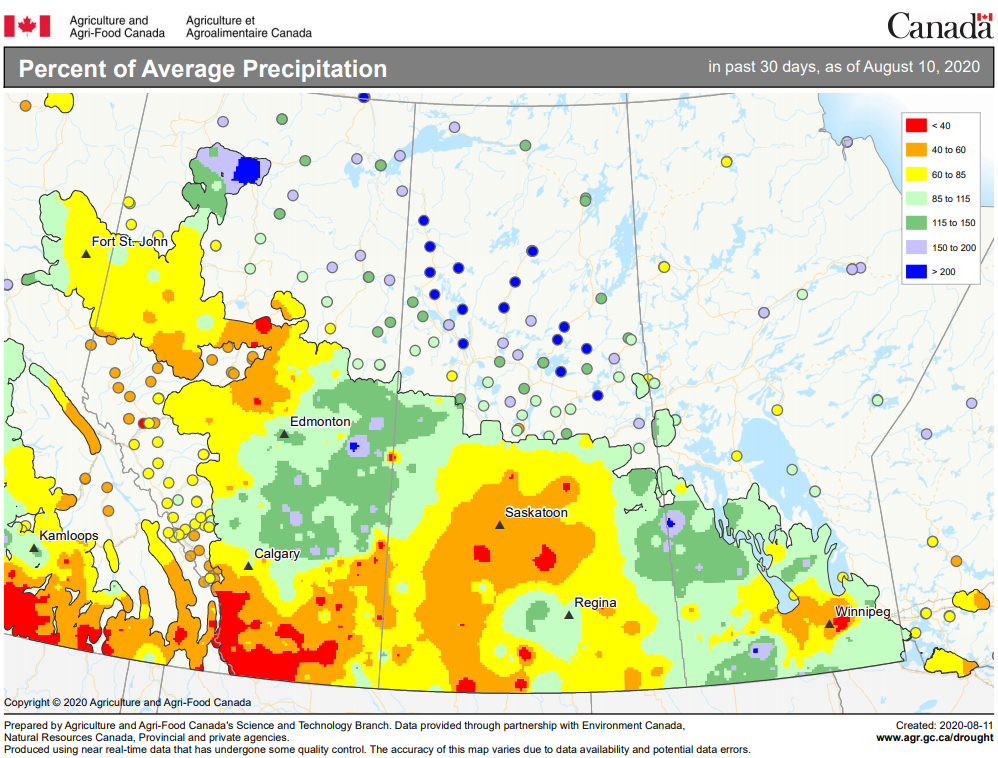
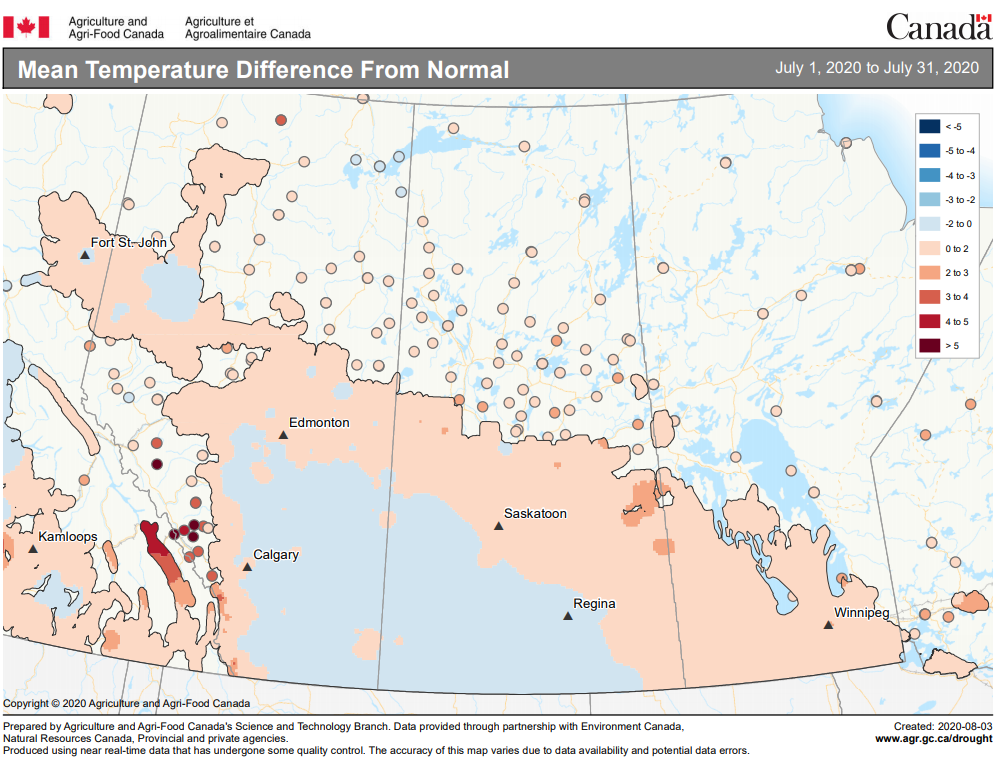
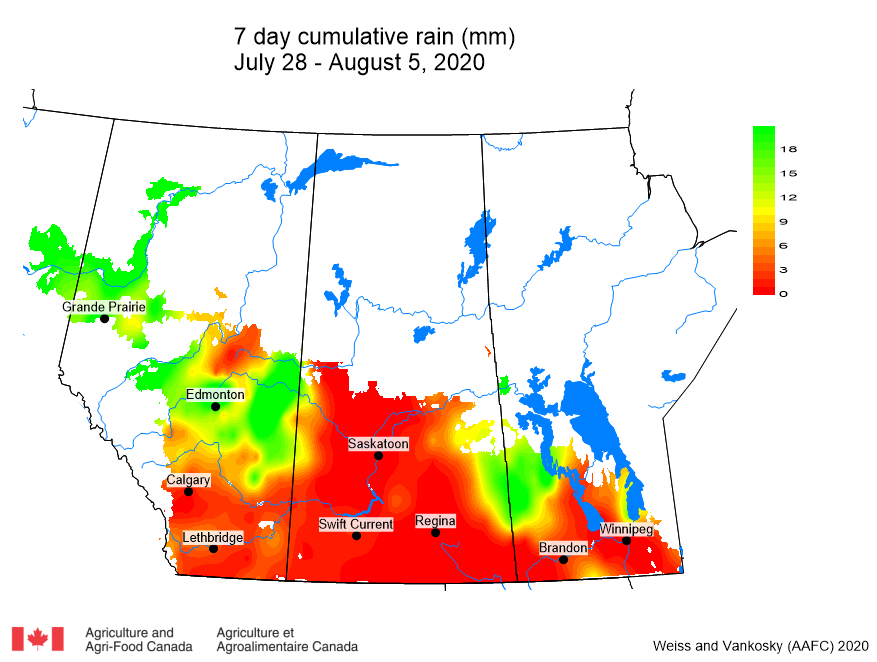
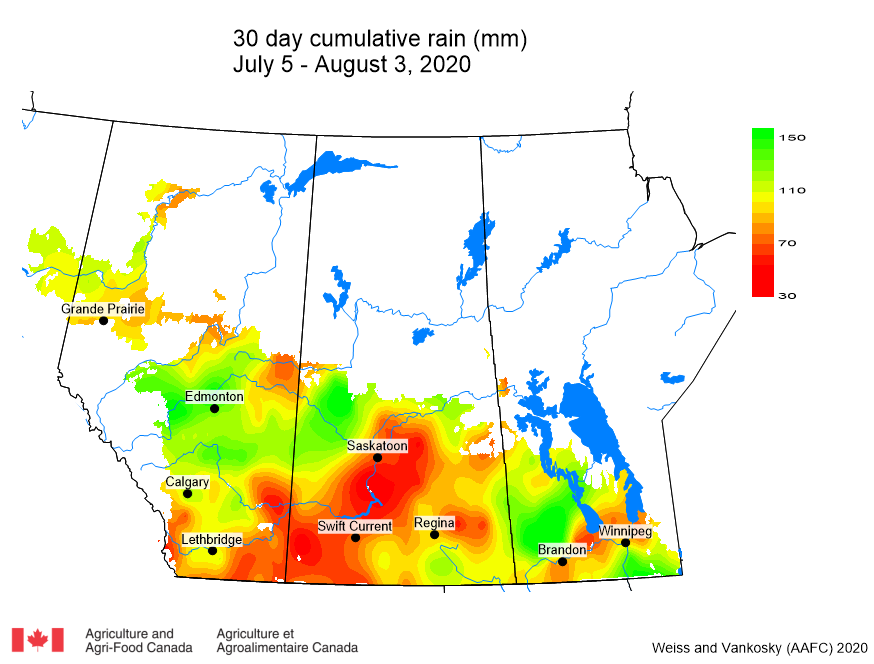
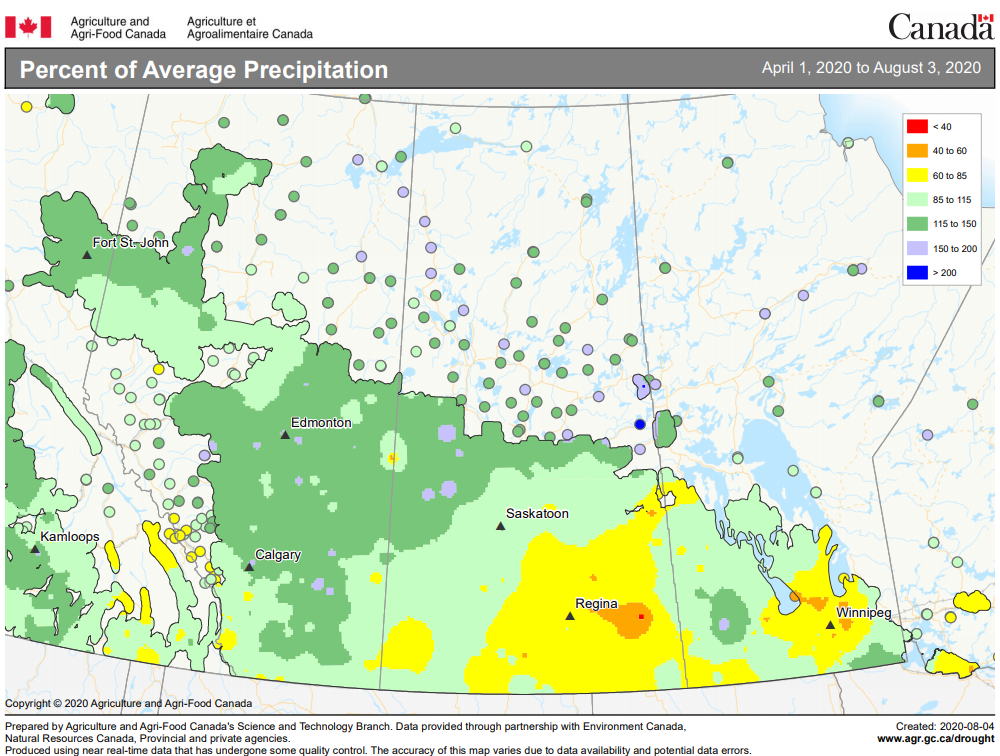
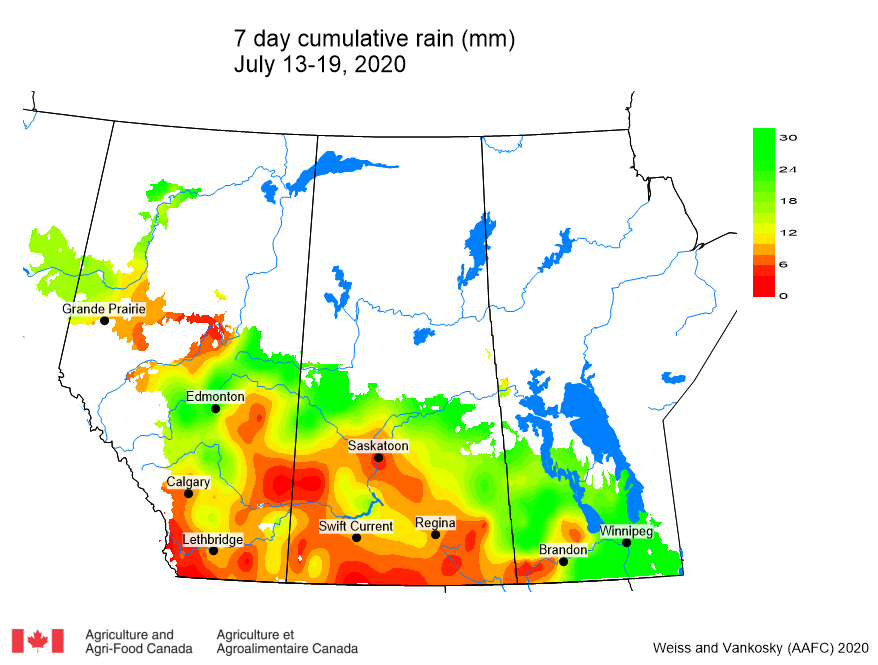
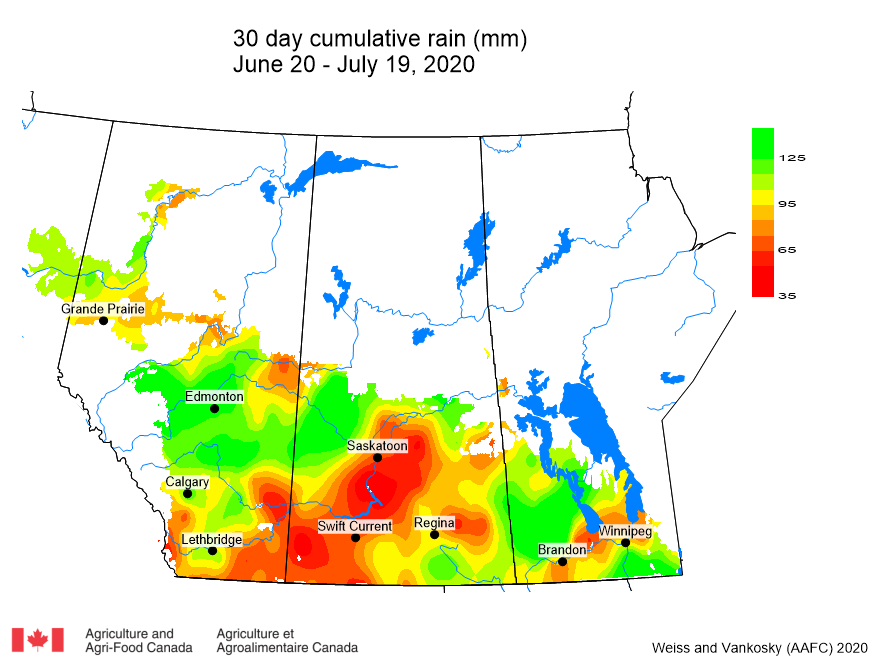
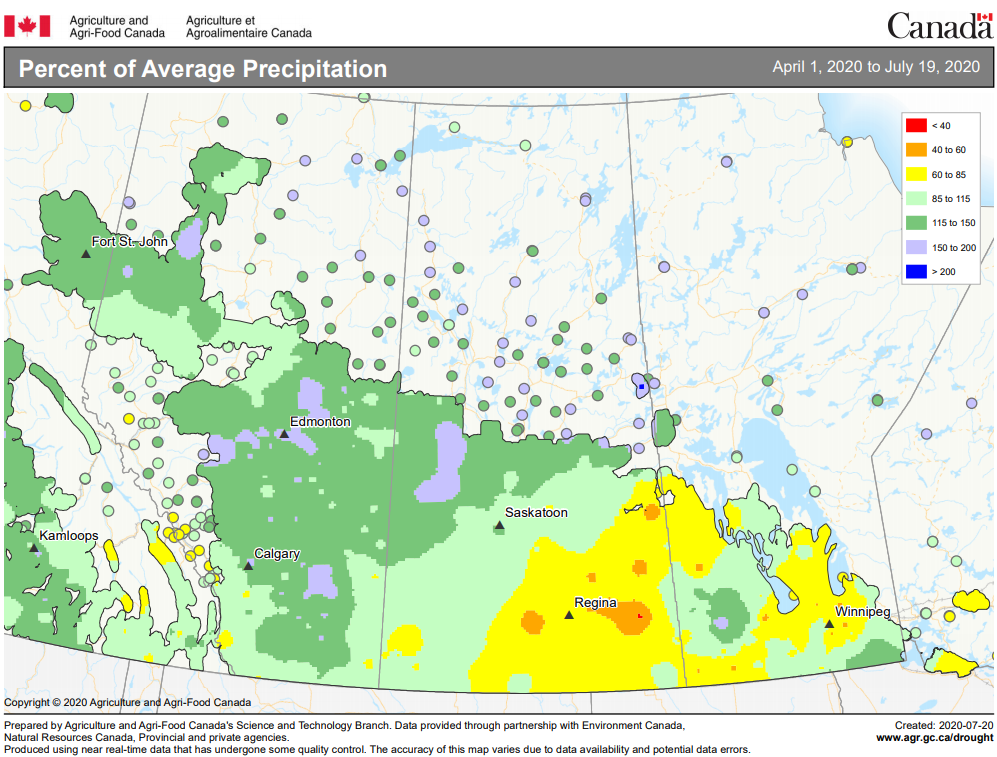
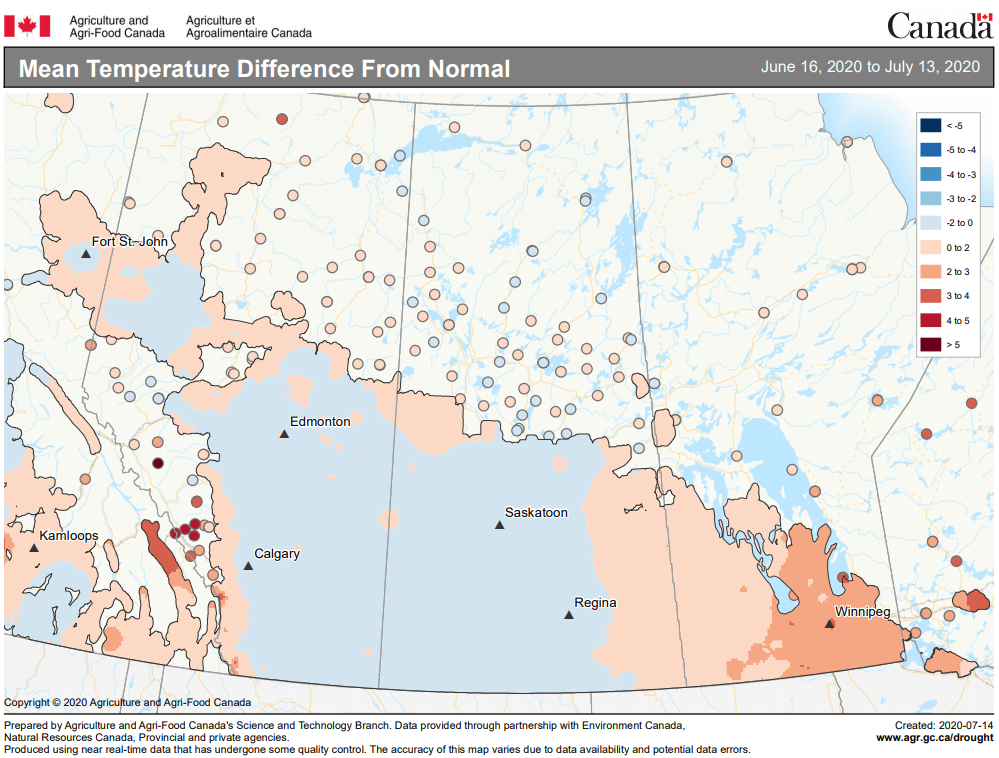
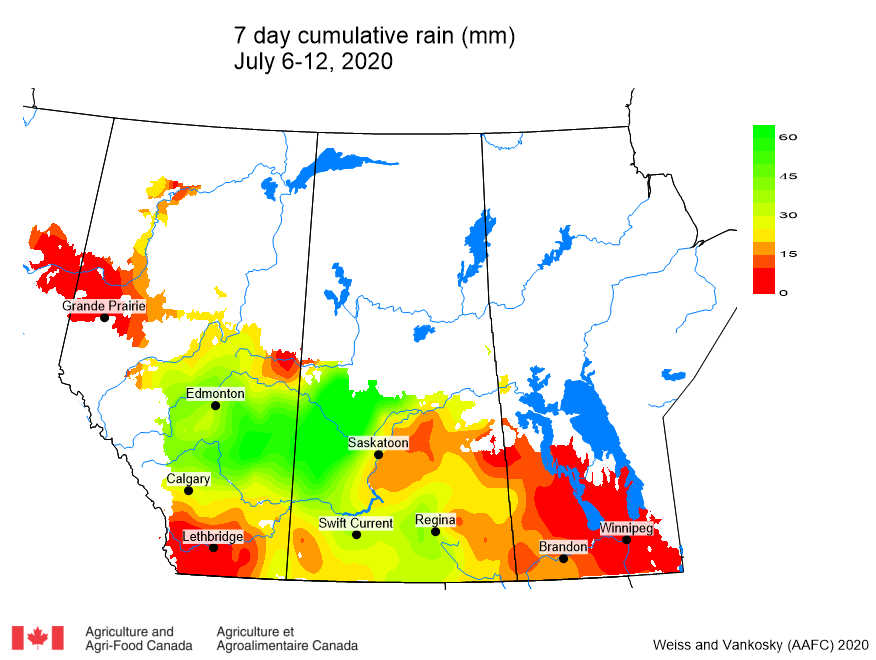
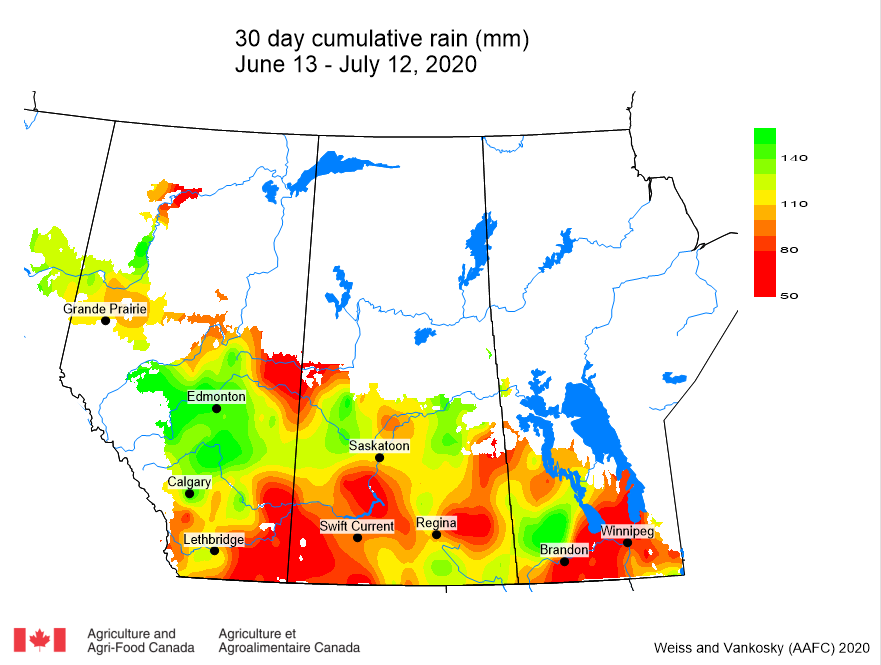
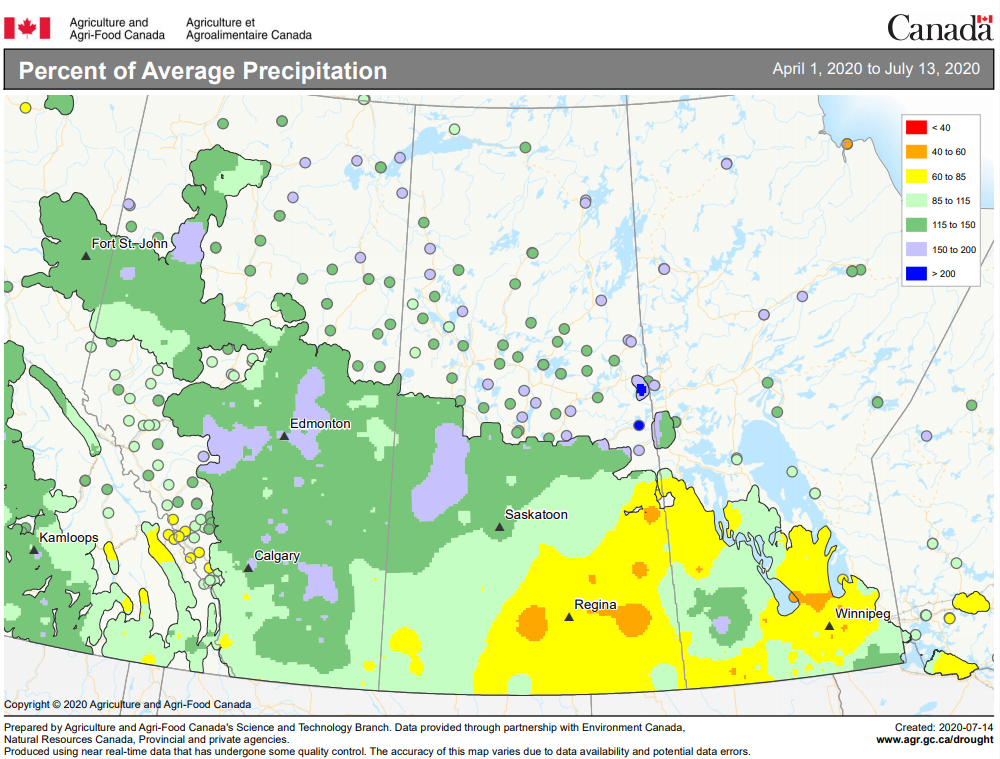
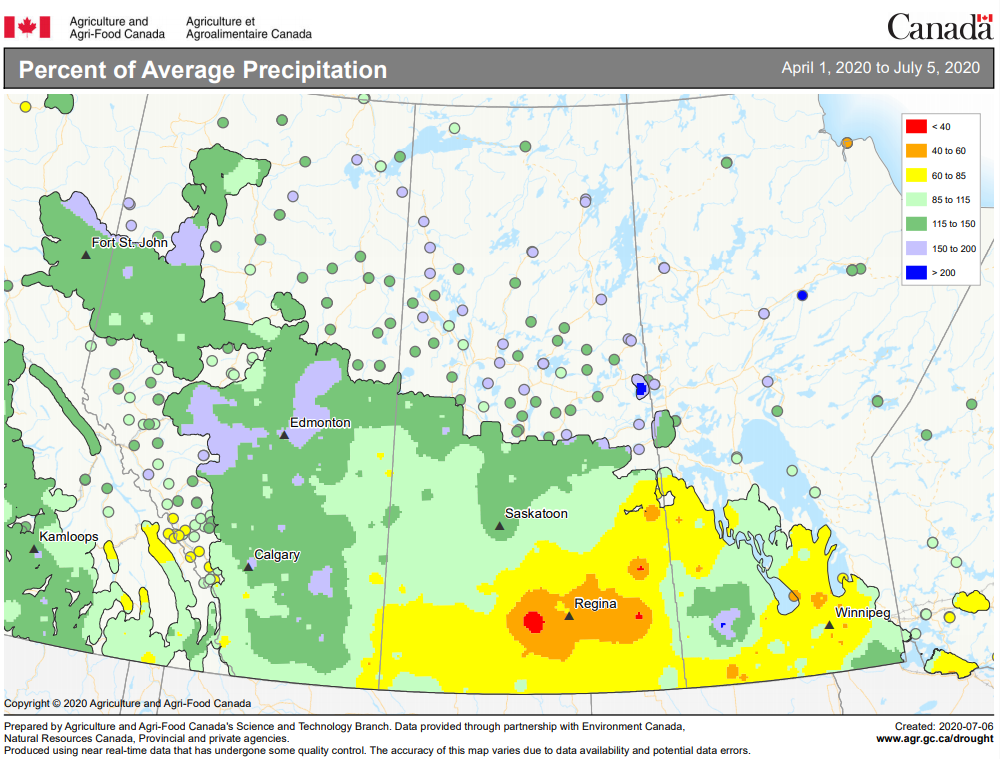
While the PPMN no longer predicts the development of Culex tarsalis, the dominant vector for West Nile Virus (WNV), areas of the Canadian prairies in 2024 have received high levels of precipitation. This is noteworthy because the larvae of C. tarsalis can develop in, “agricultural tailwater, alkaline lake beds, fresh and saline wetlands, secondary treated sewage effluent and oil field run-off” (Centre for Vector Biology URL retrieved 2024Jul04).
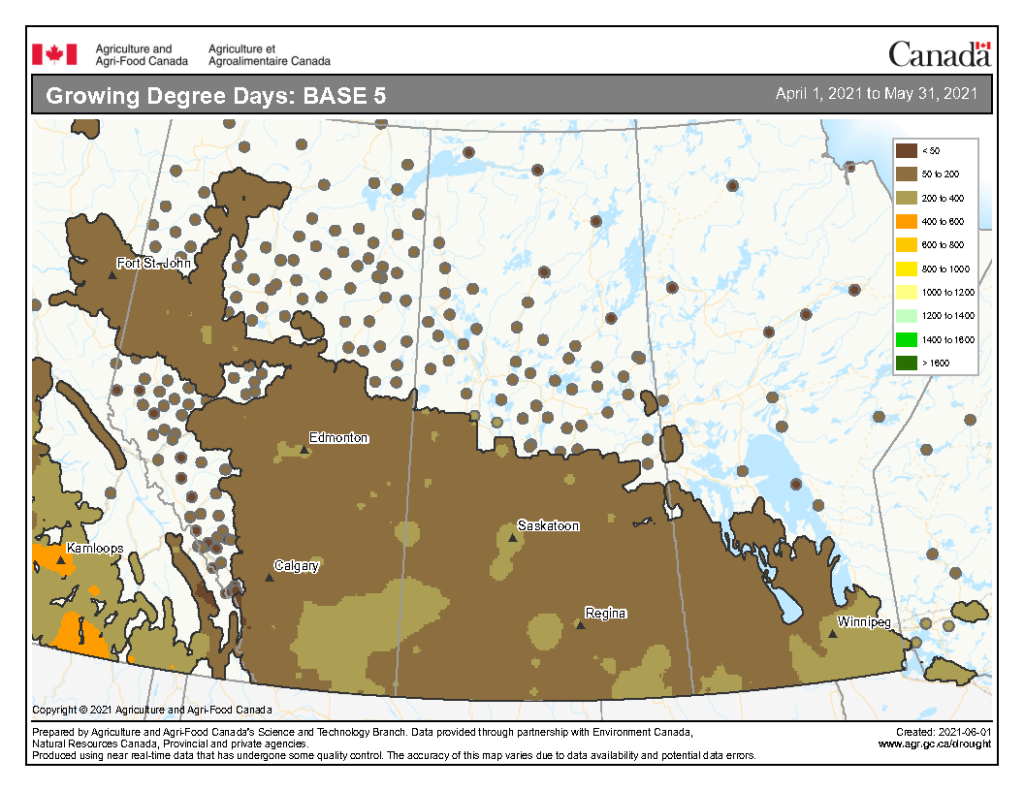
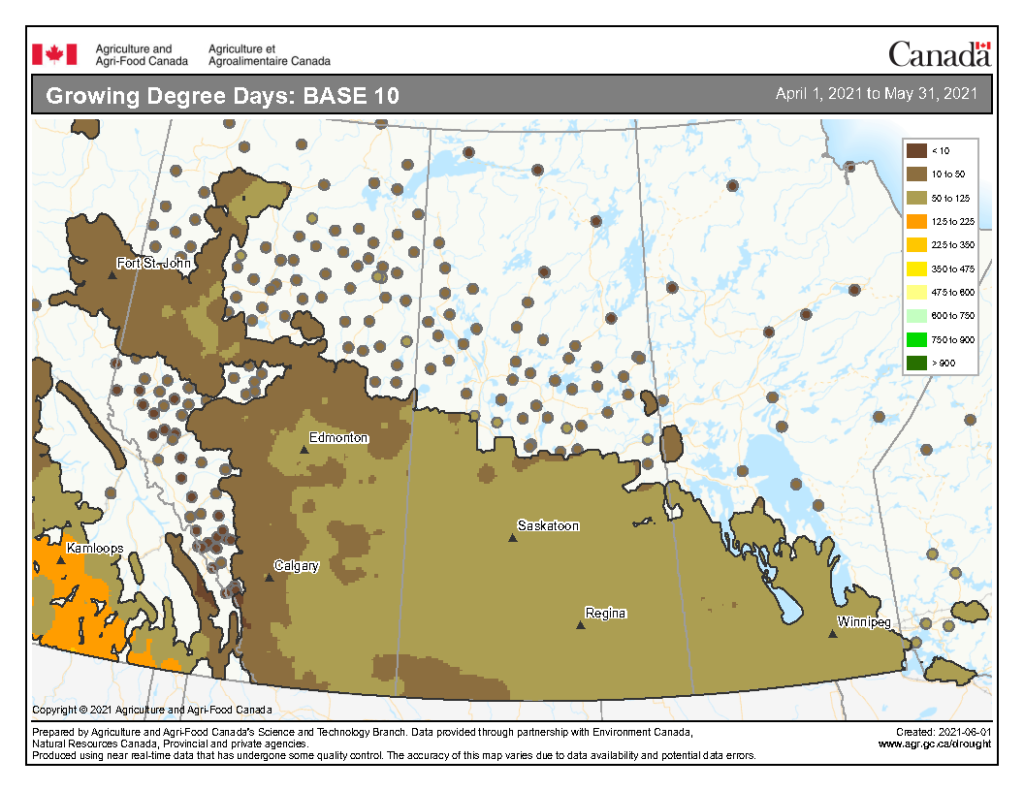
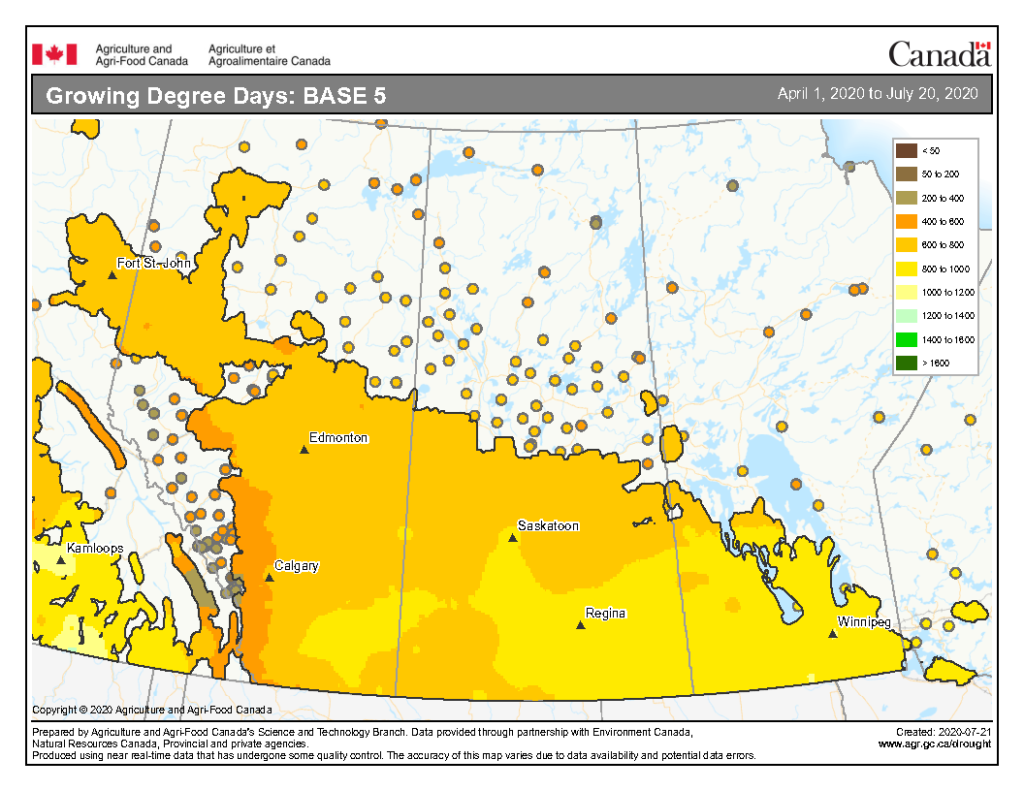
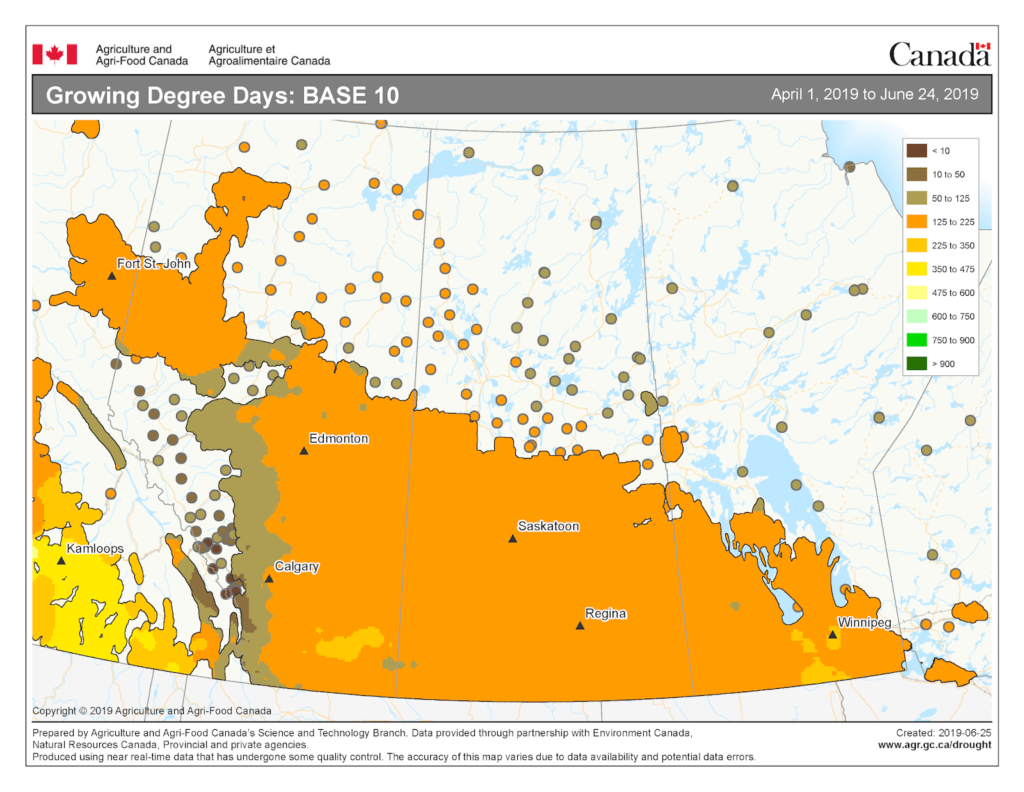
Culex tarsalis have a base developmental threshold of 14.3 °C. Across the Canadian prairies, WNV transmission is of greatest concern as the second generation of C. tarsalis females begin to fly (by 250-300 degree days). In fact, an additional 109 degree days (using Base 14.3 °C) is required within a given mosquito population for virus development to complete to the point that transmission might occur.
Historically, by mid-July, C. tarsalis adults begin to fly in southern parts of the Canadian prairies. By August, protect yourself from mosquitoes when outdoors – this is the window when mosquitoes are most numerous plus have the greatest chance of carrying WNV. Field scouts and outdoor enthusiasts should wear DEET to protect against C. tarsalis and WNV.
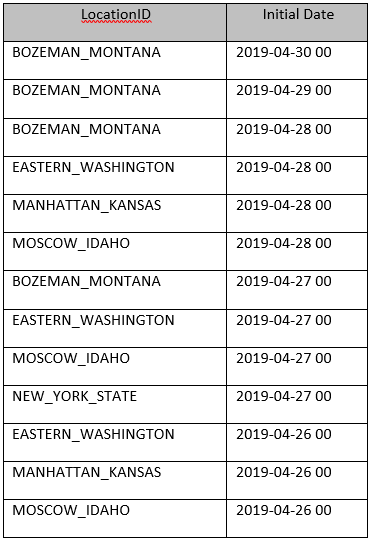
For reference, the following table of data was quickly generated using AAFC Drought Watch Historical Daily Air Temperatures since April 1, 2024:
| Location | Degree Days (base 14.3 °C) as of August 21, 2024 | Observed date heat units >200 Degree Days | Potential date when >390 Degree Days attained |
| Winnipeg | 384.0 | July 20 | August 24 |
| Brandon | 302.8 | July 27 | Unable to project |
| Regina | 352.9 | July 26 | September 2 |
| Saskatoon | 320.4 | July 29 | Unable to project |
| Lethbridge | 331.2 | July 25 | Unable to project |
| Edmonton | 205.9 | August 20 | Unable to project |
| Grande Prairie | 239.2 | August 11 | Unable to project |
The Public Health Agency of Canada posts information related to West Nile Virus in Canada. Link here to view the latest case numbers and seasonal updates. Bird surveillance continues to be an important way to detect and monitor West Nile Virus. The Canadian Wildlife Health Cooperative (CWHC) works with governmental agencies (i.e., provincial laboratories and the National Microbiology Laboratory) and other organizations to report the occurrence of WNV. Access information on surveillance posted by the provinces of Manitoba, Saskatchewan, or Alberta.