Temperatures this week, June 18-24, 2019, were similar to last week. Over the past seven days temperatures were cooler than normal. The warmest temperatures were observed across MB while temperatures were cooler in western SK and across AB (Fig. 1). The is a complete reversal to last week.
Average 30 day temperatures were warmest across southern MB and SK (Fig. 2). Cooler temperatures were reported across eastern and northern AB. The mean temperature differences from normal (May 21 – June 17, 2019) have been zero to two °C warmer than normal for AB and SK while temperatures in MB have been zero to two °C cooler than normal (Fig. 3).
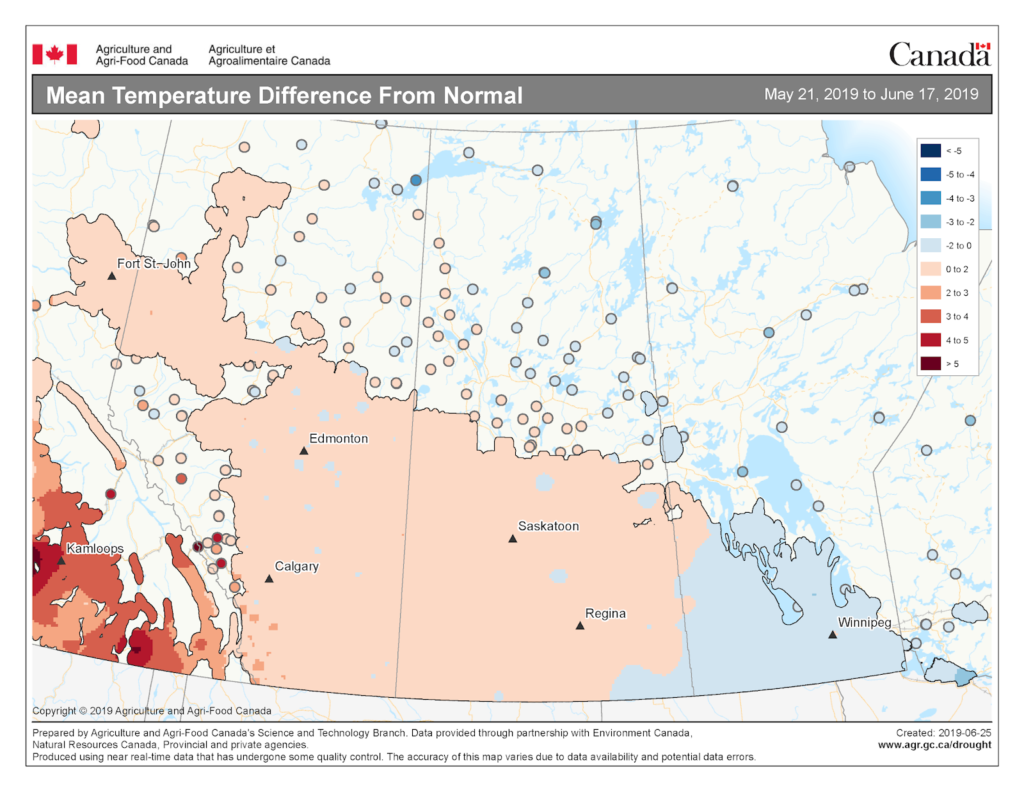
Image has not been reproduced in affiliation with, or with the endorsement of the Government of Canada and was retrieved (25Jun2019). Access the full map at http://www.agr.gc.ca/DW-GS/current-actuelles.jspx?lang=eng&jsEnabled=true
Growing season temperatures (April 1-June 24, 2019) have been warmest across the southern prairies (Fig. 4). The warmest growing season temperatures have been reported for southern AB and an area south of Winnipeg MB. Across the prairies, the average growing season temperature has been 1.2 °C below normal.
This past week significant rainfall amounts were reported for most of SK and across central regions of AB (Fig. 5). Across the prairies, rainfall amounts for the past 30 days (May 26 – June 24, 2019) have been near normal (Fig. 6). The Edmonton region has been the wettest.
The growing degree day map (GDD) (Base 5 ºC, April 1-June 24, 2019) is below (Fig. 9):
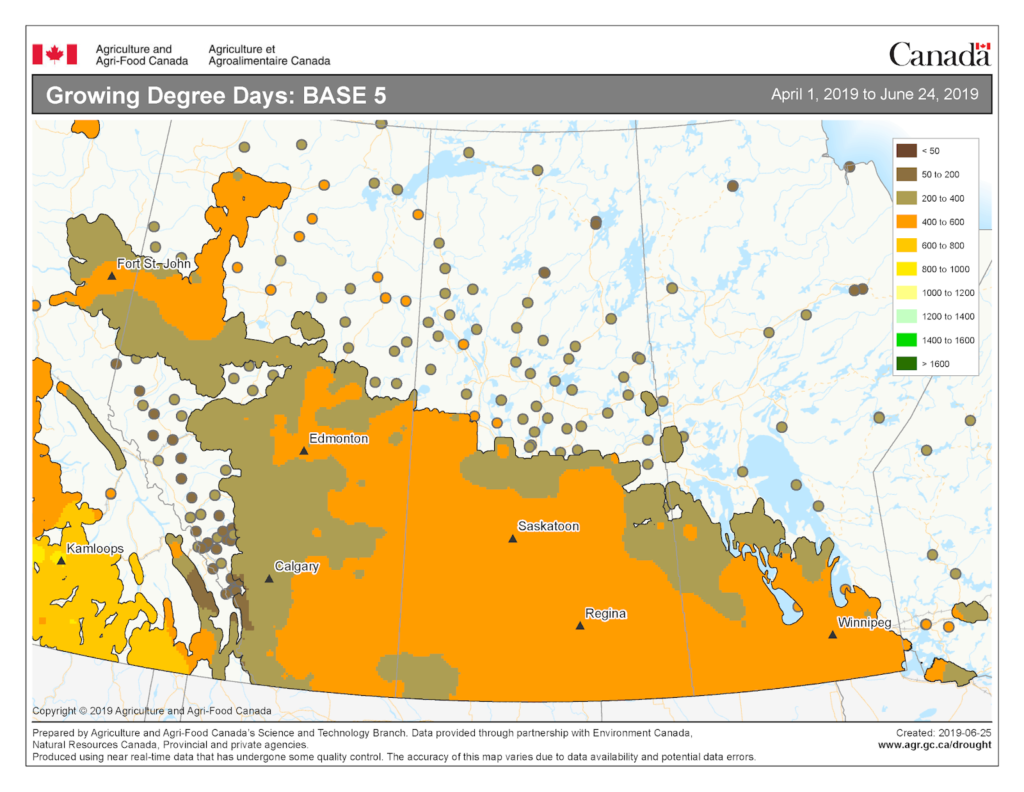
Image has not been reproduced in affiliation with, or with the endorsement of the Government of Canada and was retrieved (25Jun2019). Access the full map at http://www.agr.gc.ca/DW-GS/current-actuelles.jspx?lang=eng&jsEnabled=true
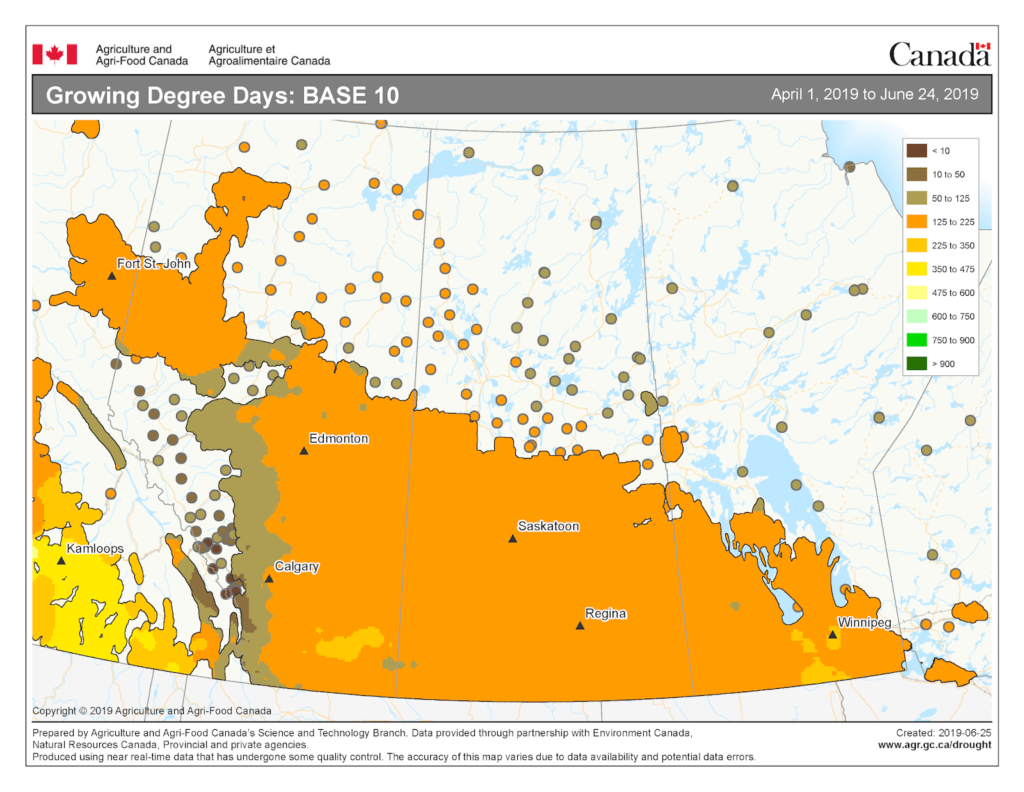
The growing degree day map (GDD) (Base 10 ºC, April 1-June 24, 2019) is below (Fig. 10):
The lowest temperatures (°C) observed the past seven days ranged from about 11 to 0 °C in the map below (Fig. 11).
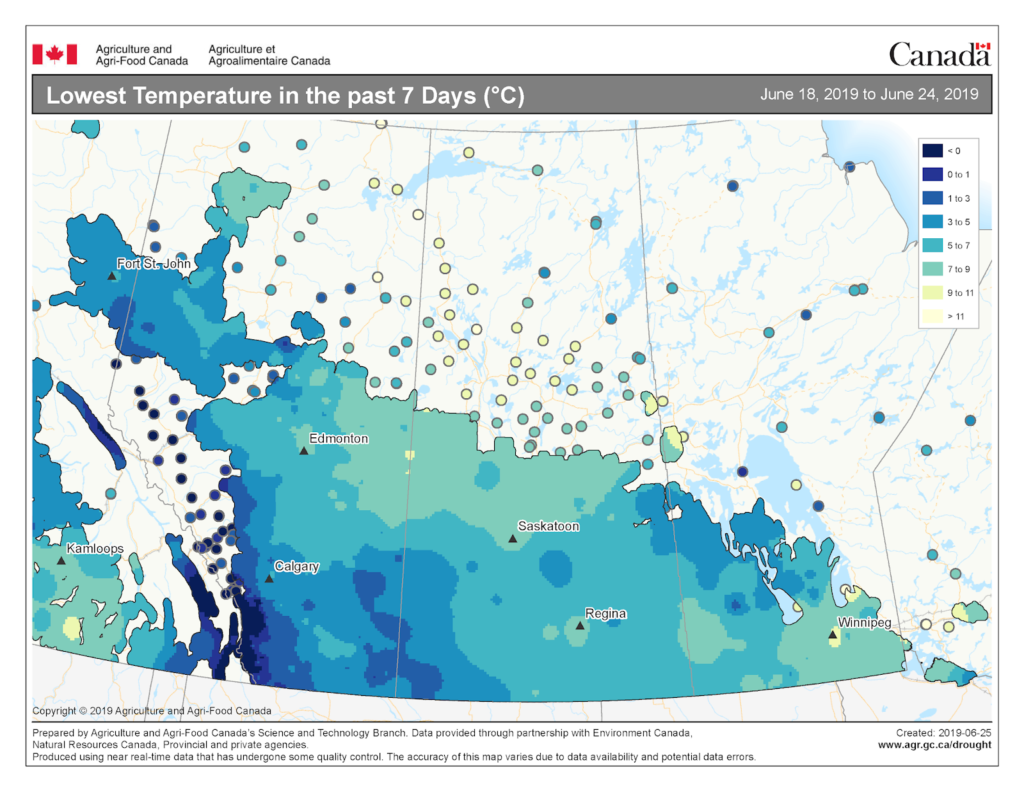
Image has not been reproduced in affiliation with, or with the endorsement of the Government of Canada and was retrieved (25Jun2019). Access the full map at http://www.agr.gc.ca/DW-GS/current-actuelles.jspx?lang=eng&jsEnabled=true
The highest temperatures (°C) observed the past seven days ranged from about 16 to at least 27 °C in the map below (Fig. 12).
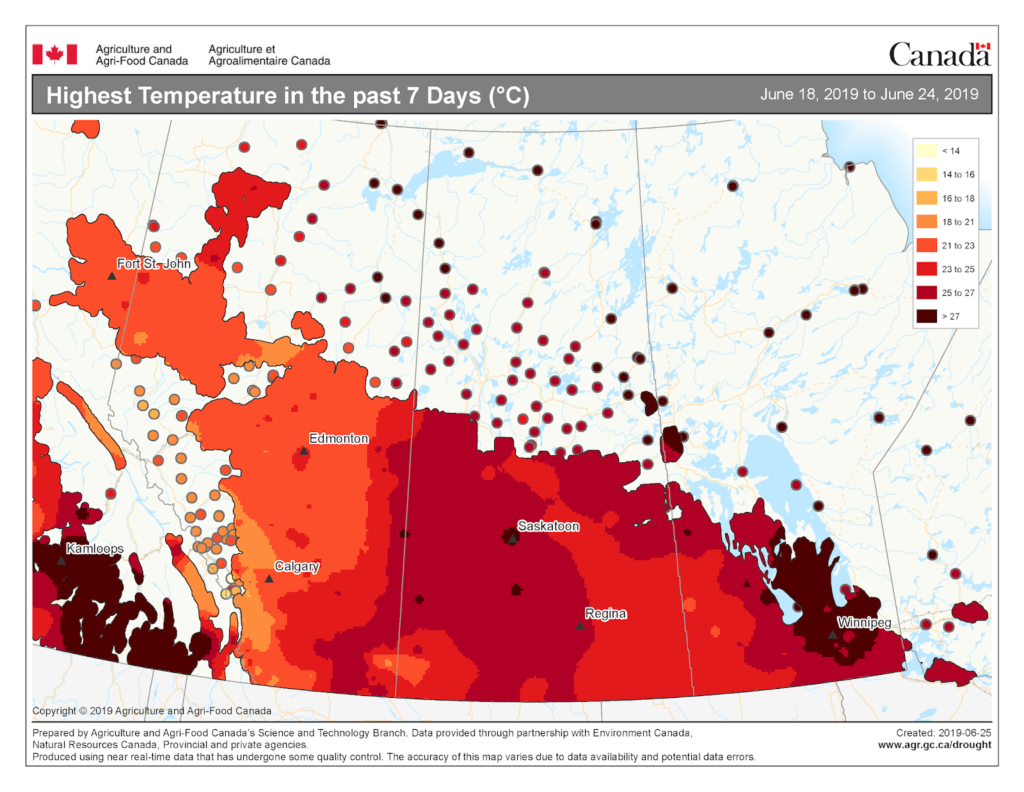
Image has not been reproduced in affiliation with, or with the endorsement of the Government of Canada and was retrieved (24Jun2019). Access the full map at http://www.agr.gc.ca/DW-GS/current-actuelles.jspx?lang=eng&jsEnabled=true
The maps above are all produced by Agriculture and Agri-Food Canada. Growers can bookmark the AAFC Drought Watch Maps for the growing season.