Weekly Update – Weather Synopsis

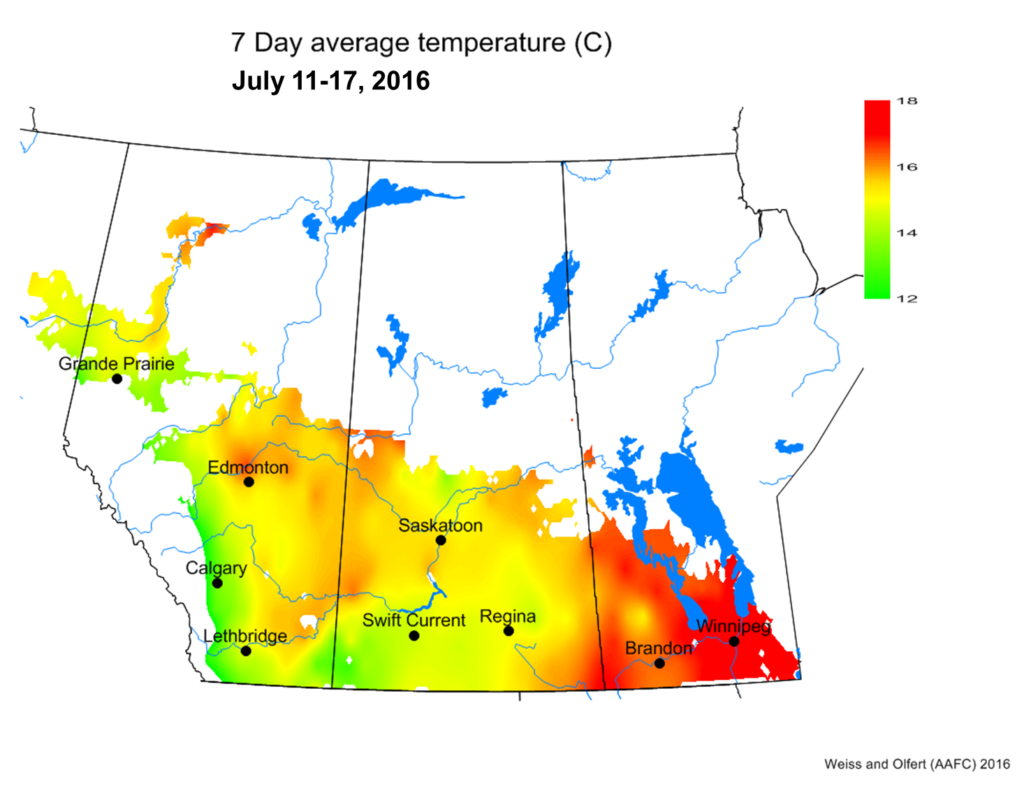
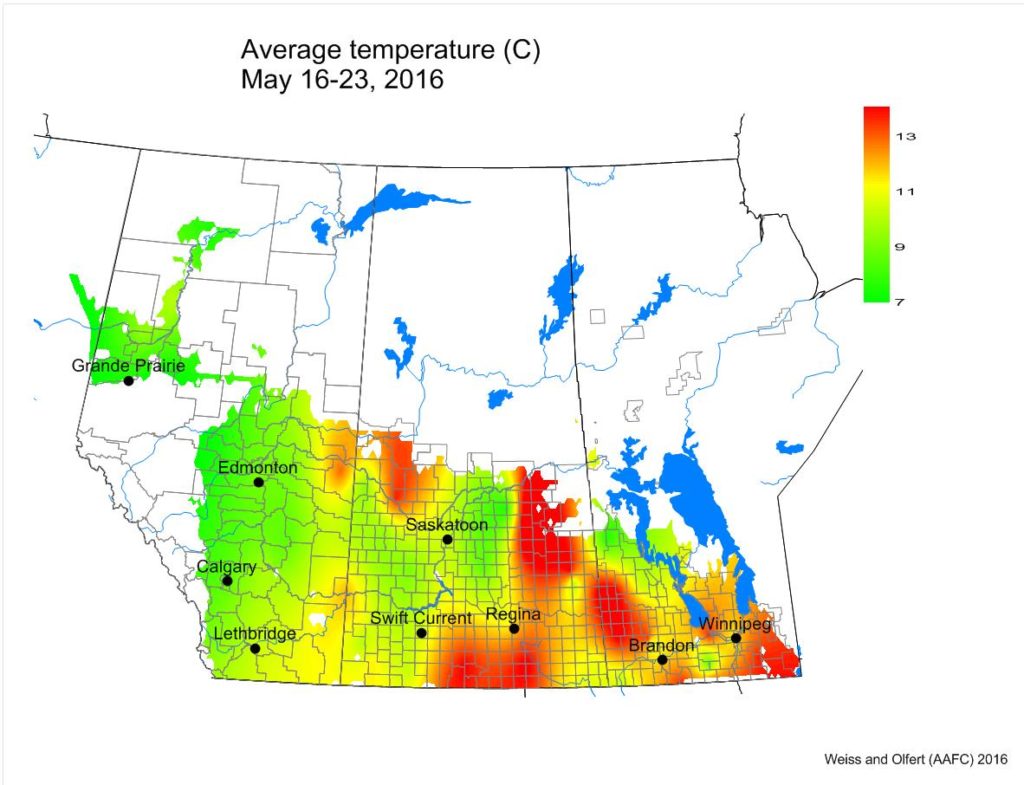
The average temperature over the past seven days (July 11-17, 2016) was slightly cooler than Long Term Normal (LTN). 


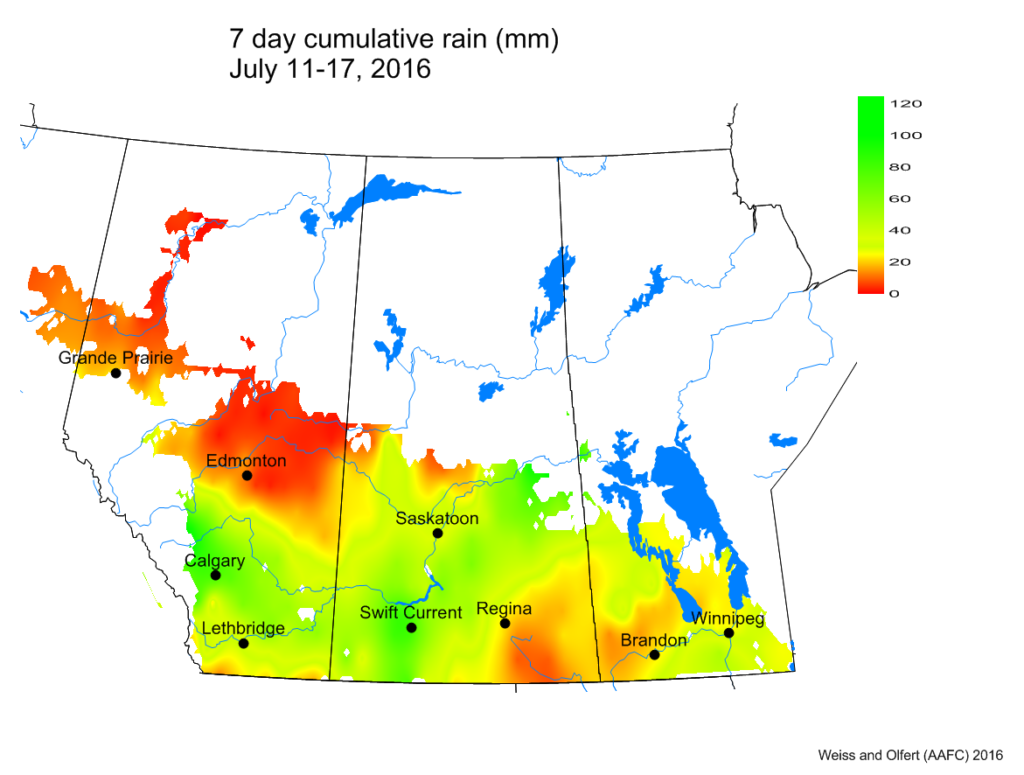
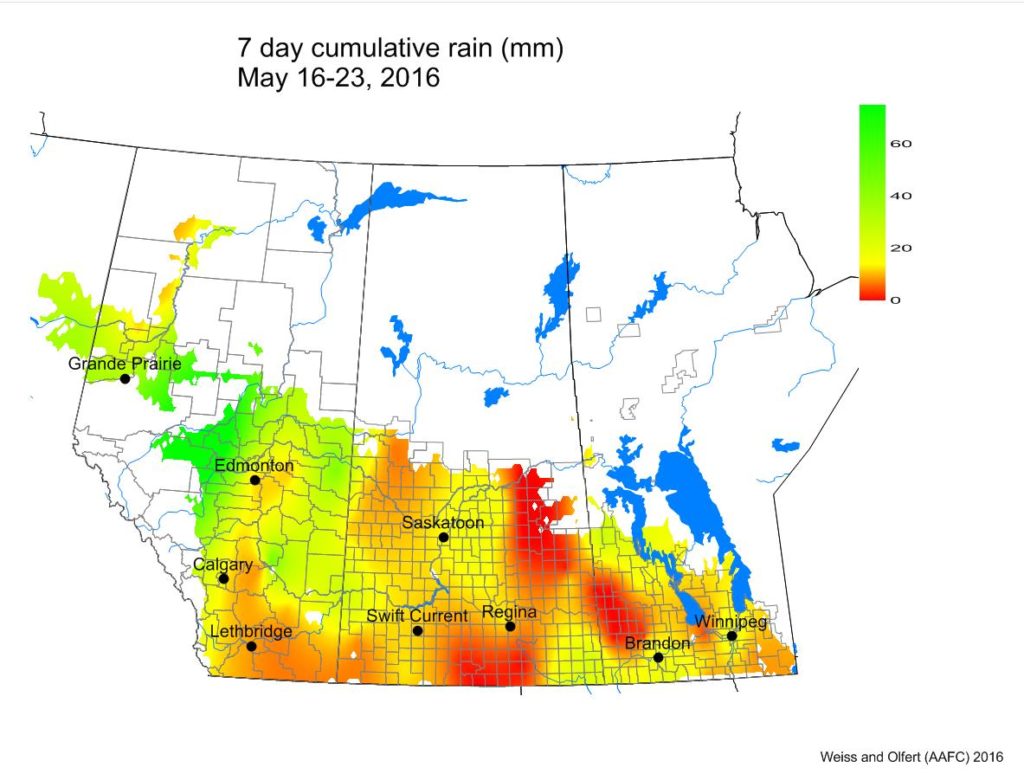
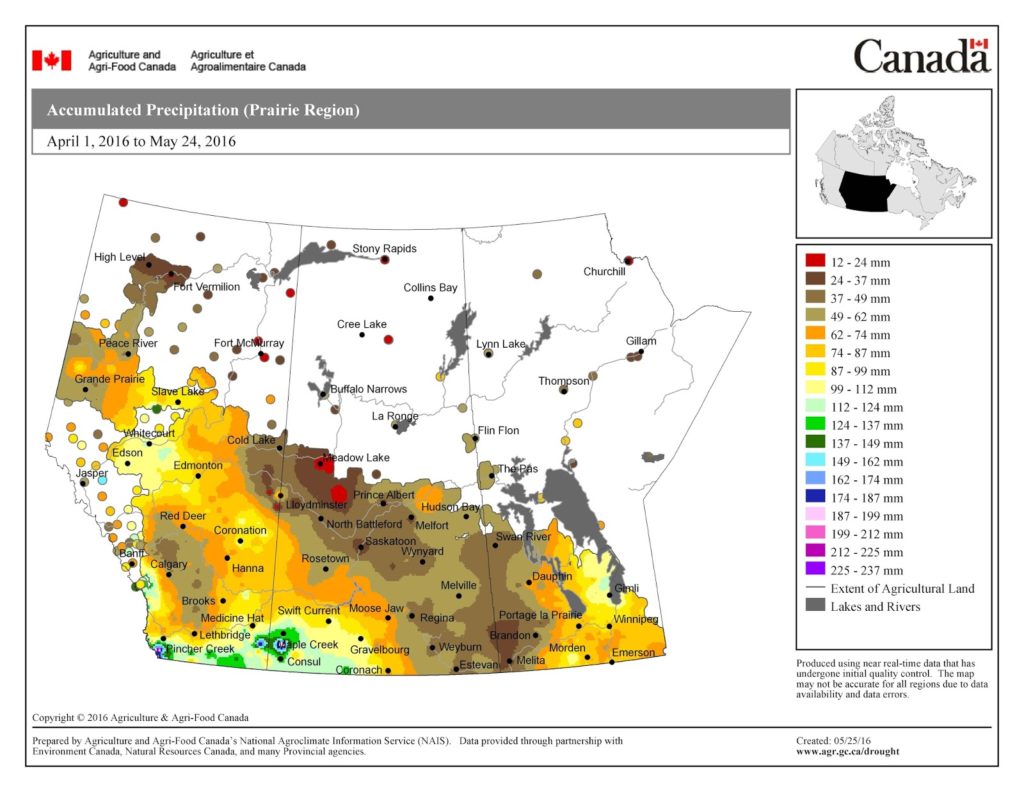
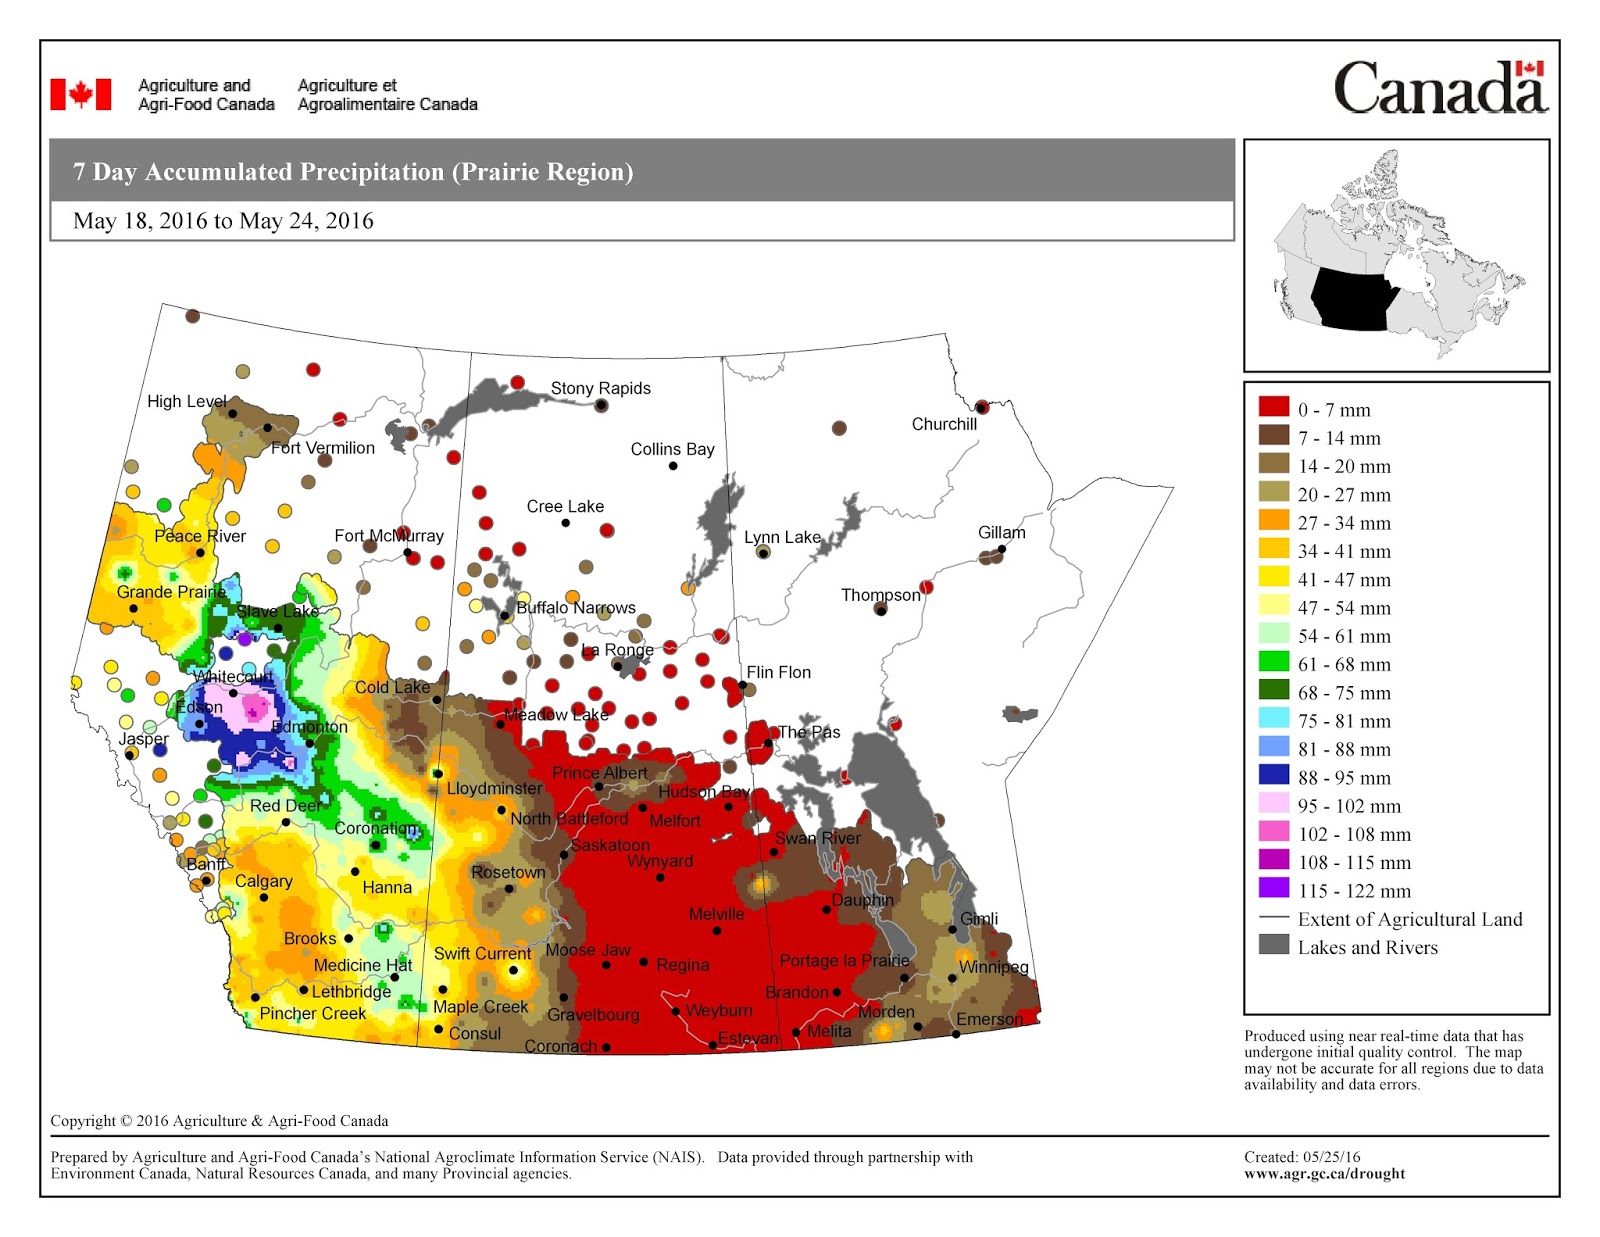
Across the southern prairies, the 7-day average cumulative rainfall was well above LTN values.


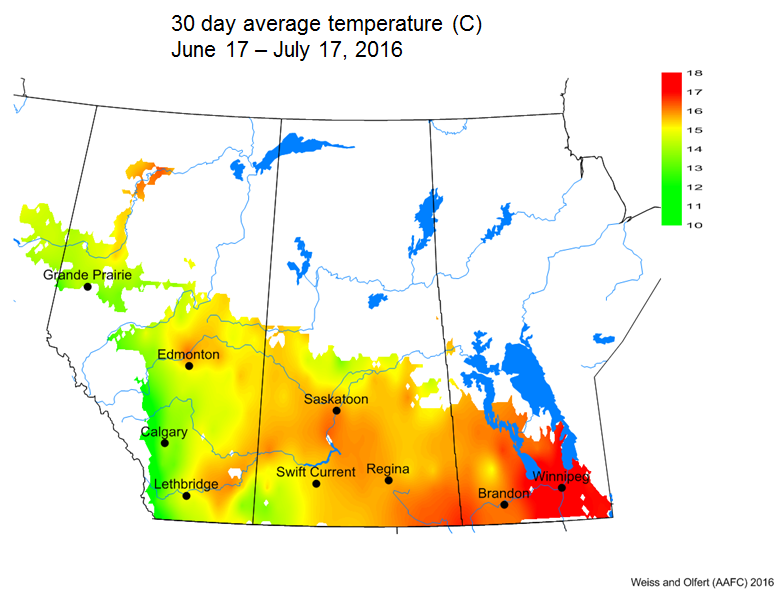
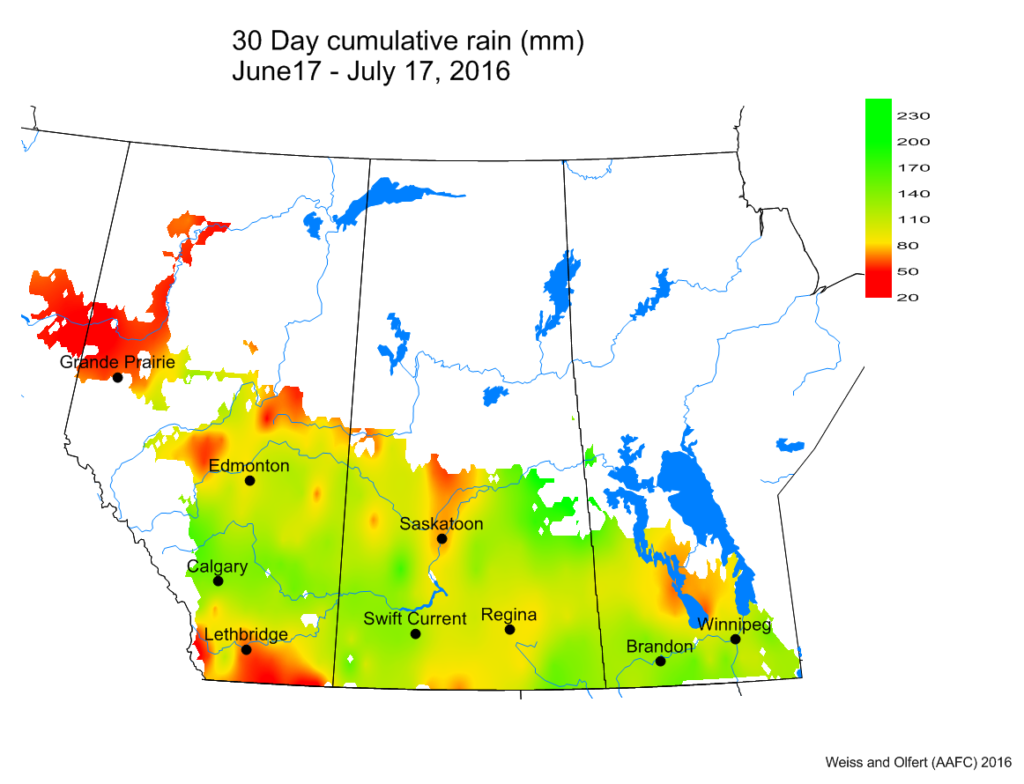
The average 30 day temperature for June 17 to July 17, 2016, was similar LTN and rainfall was 20% greater than LTN.


The average growing season temperature (April 1 – July 17, 2016) has been less than 1°C warmer than normal. 


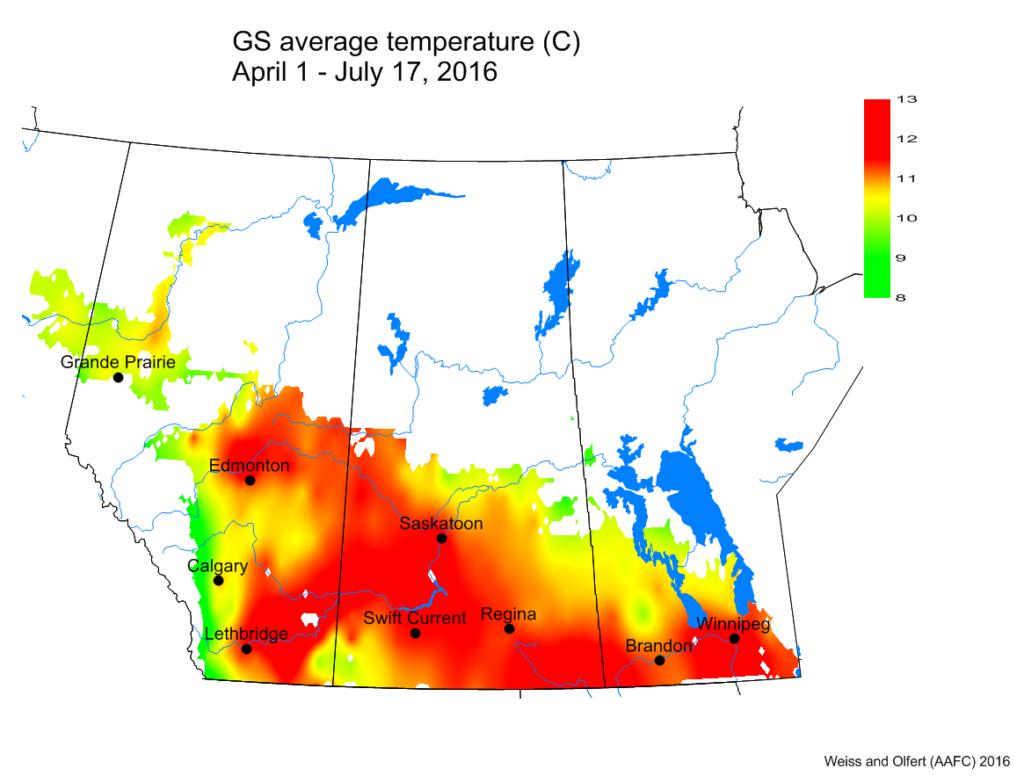
Growing season rainfall has been approximately 20% above average.


The map below is the modelled soil moisture map for the prairies (up to July 17, 2016).


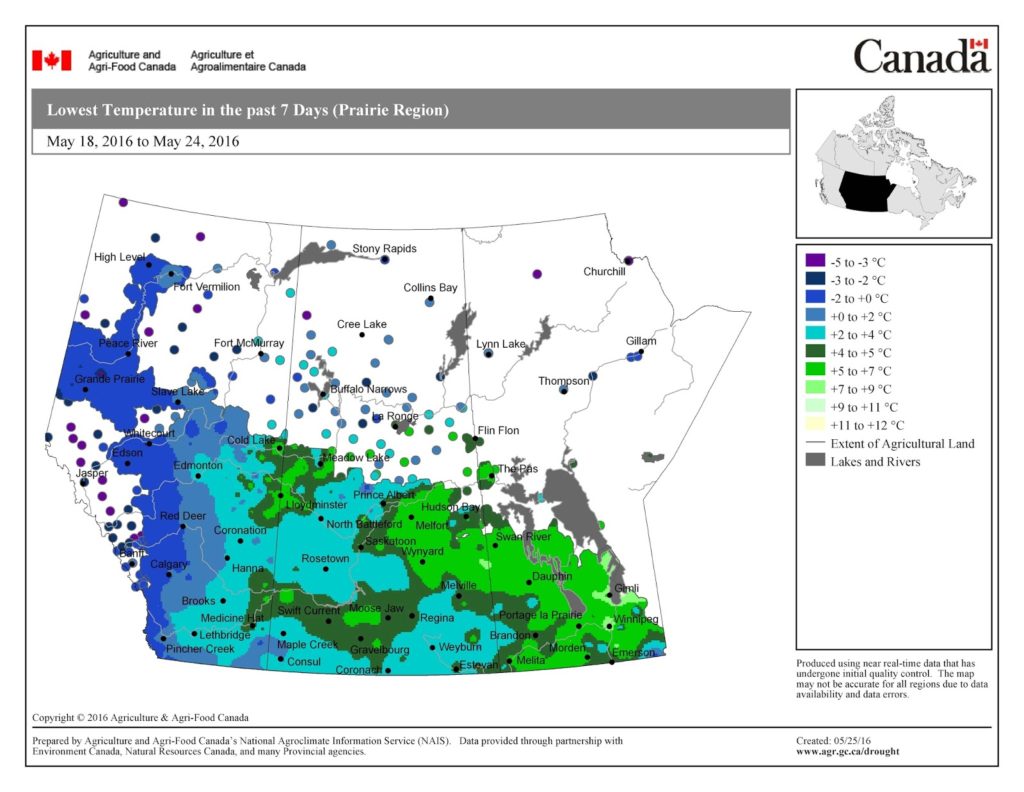
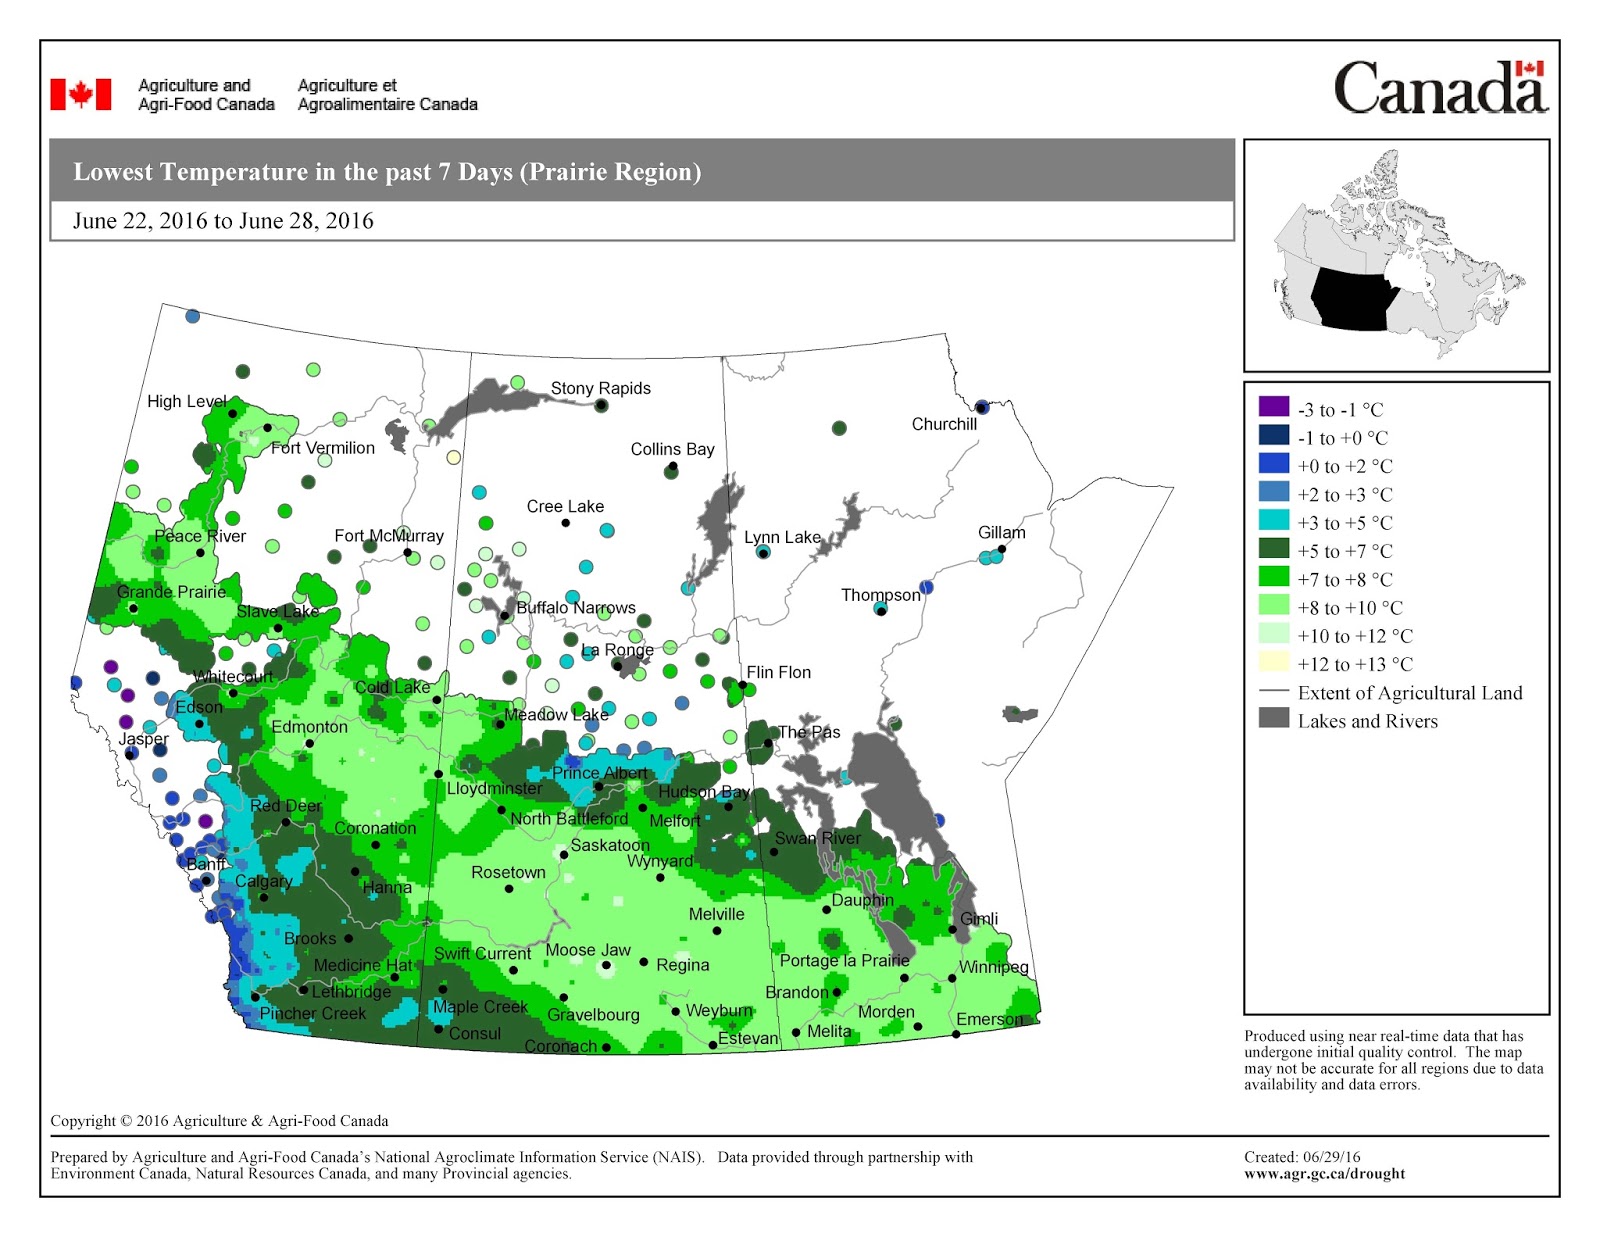
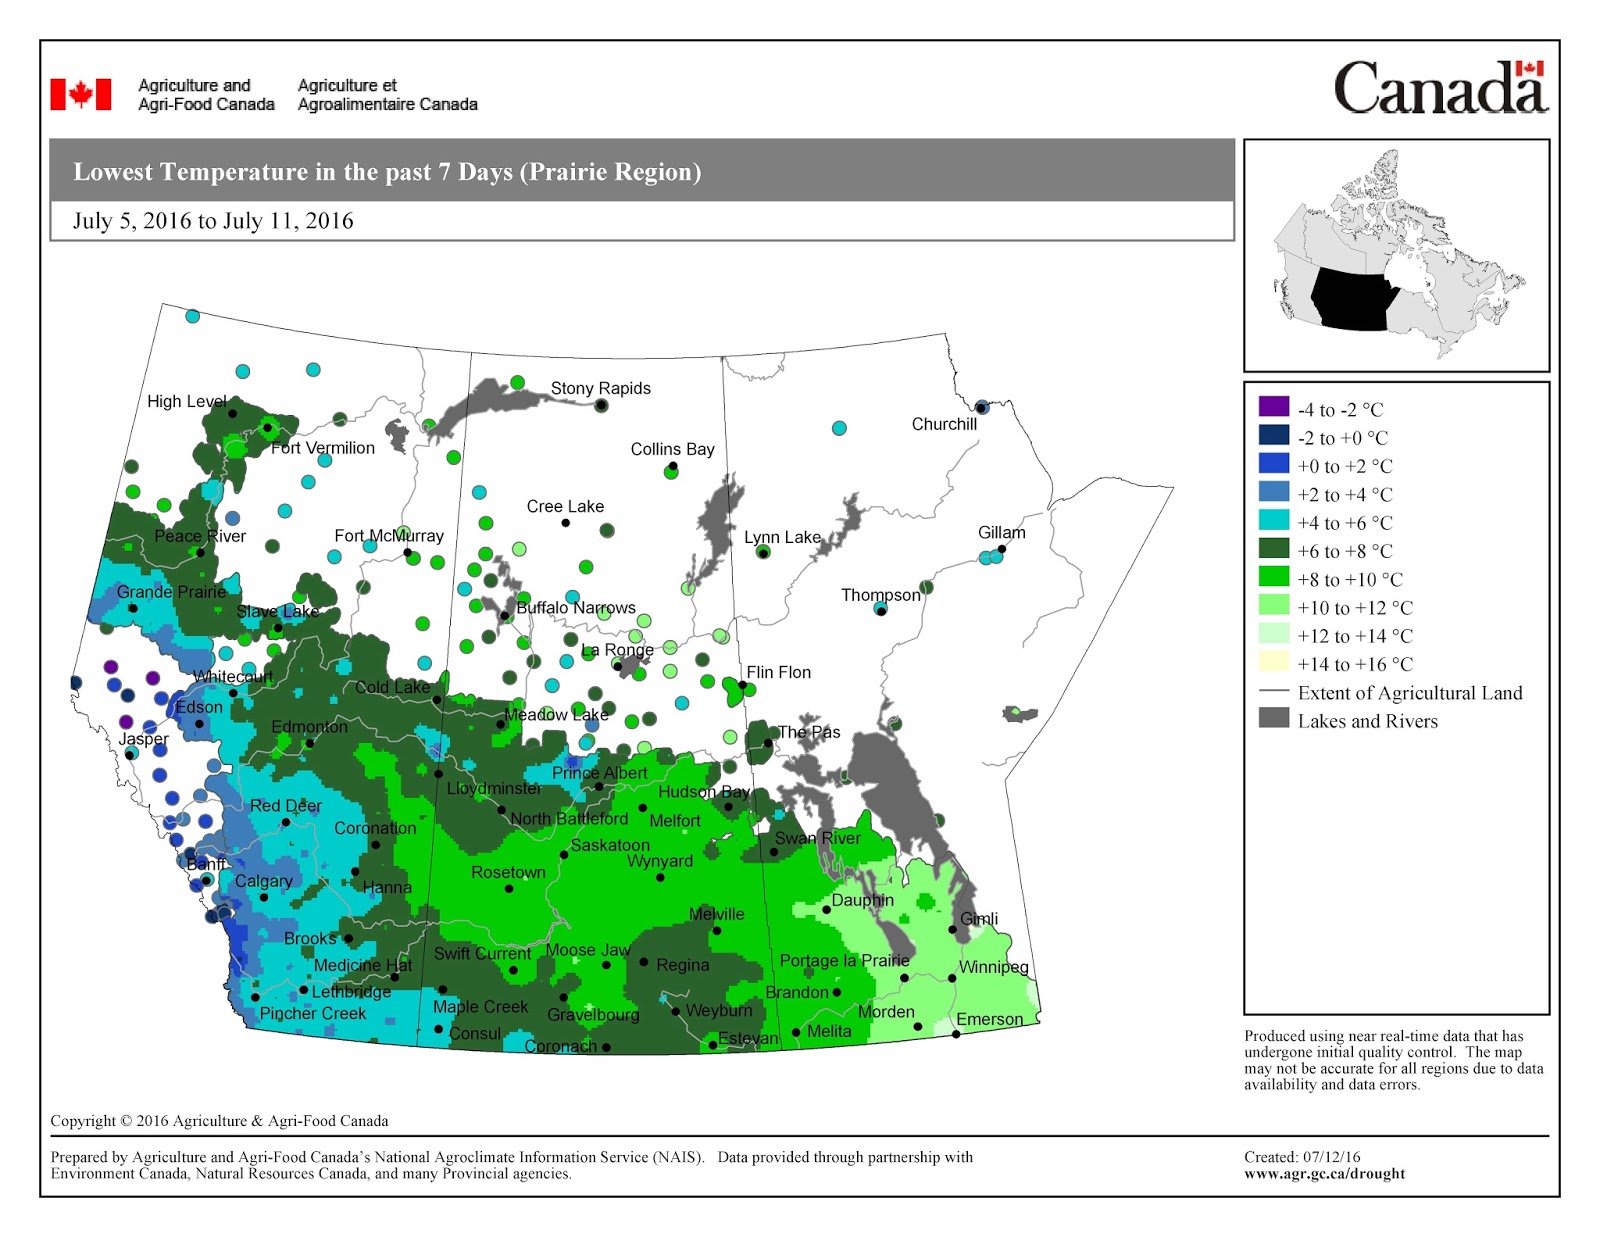
The map below shows the Lowest Temperatures the Past 7 Days (July 13-19, 2016) across the prairies:


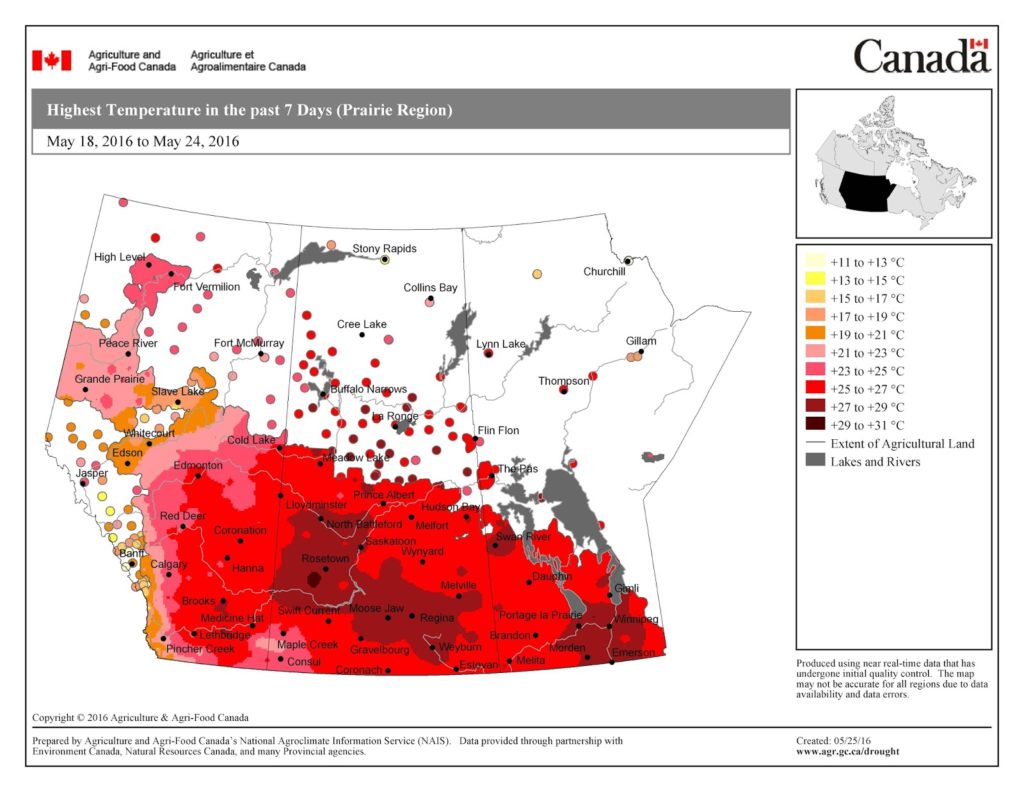
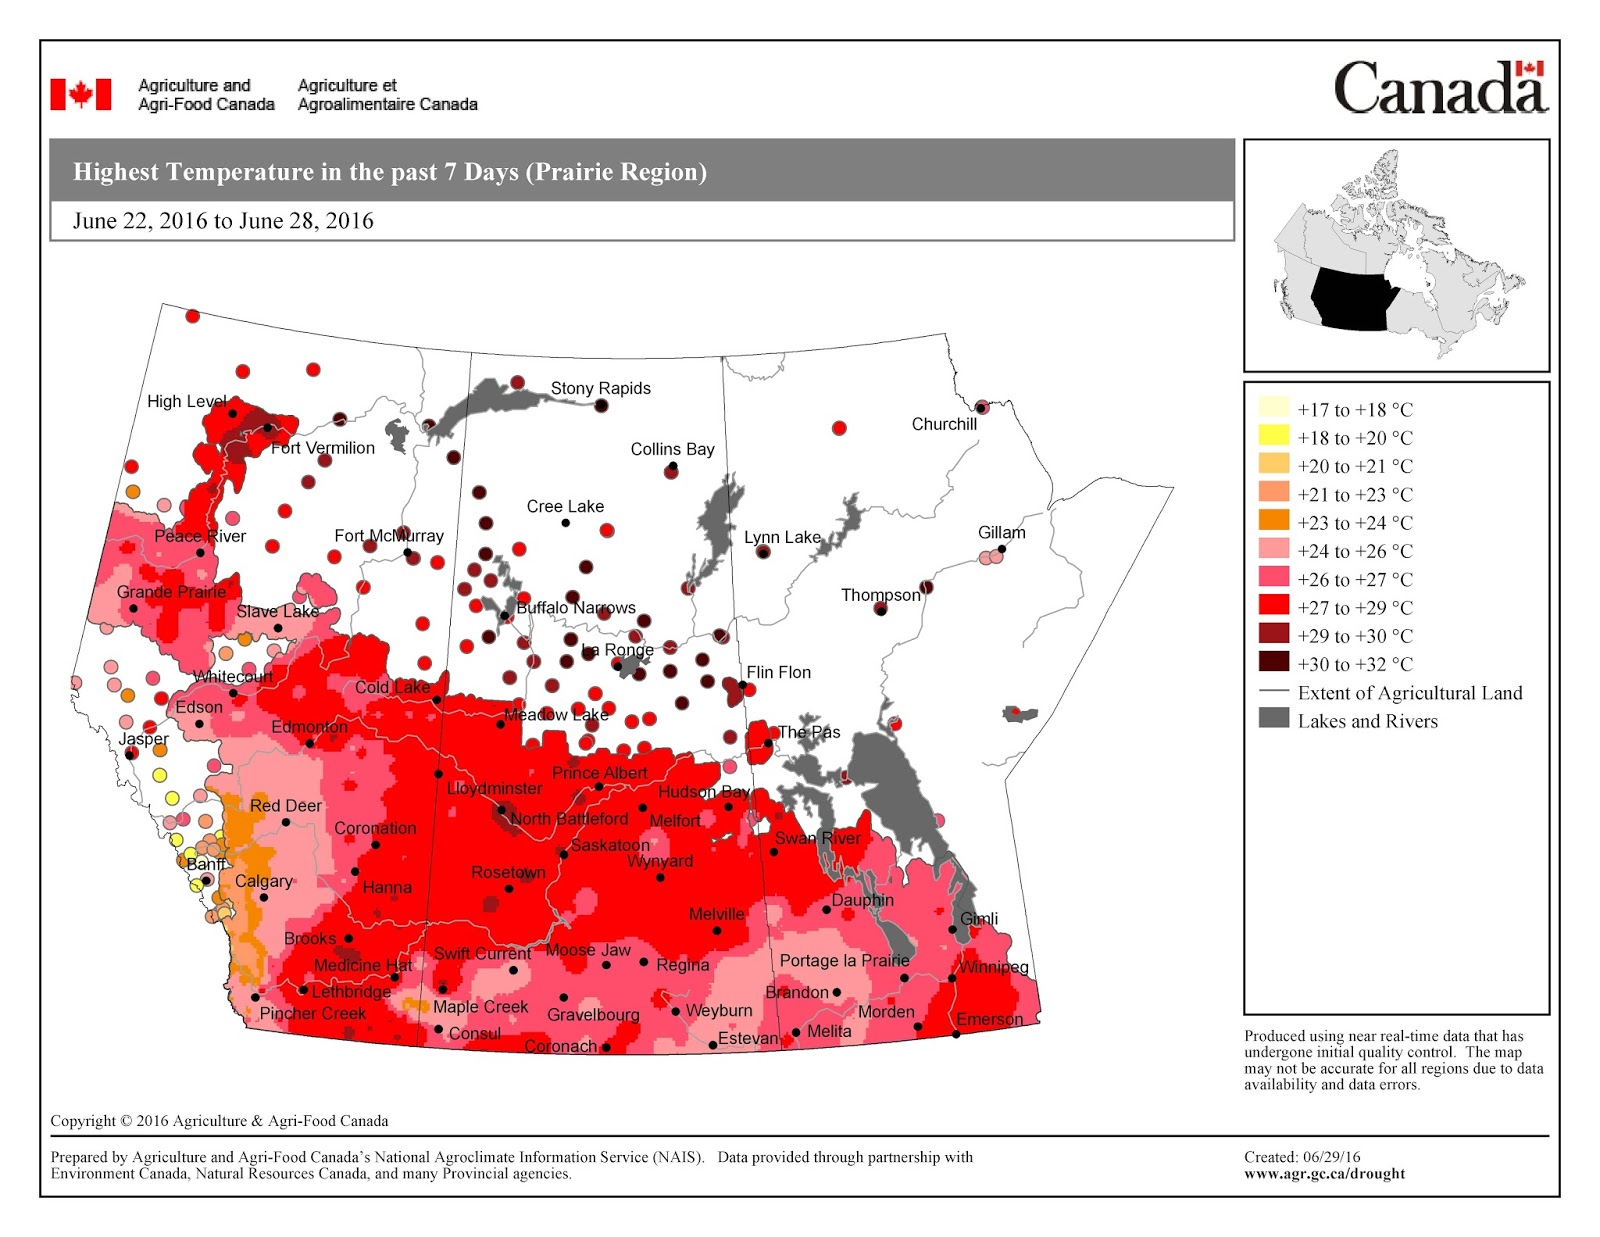
The map below shows the Highest Temperatures the Past 7 Days (July 13-19, 2016):


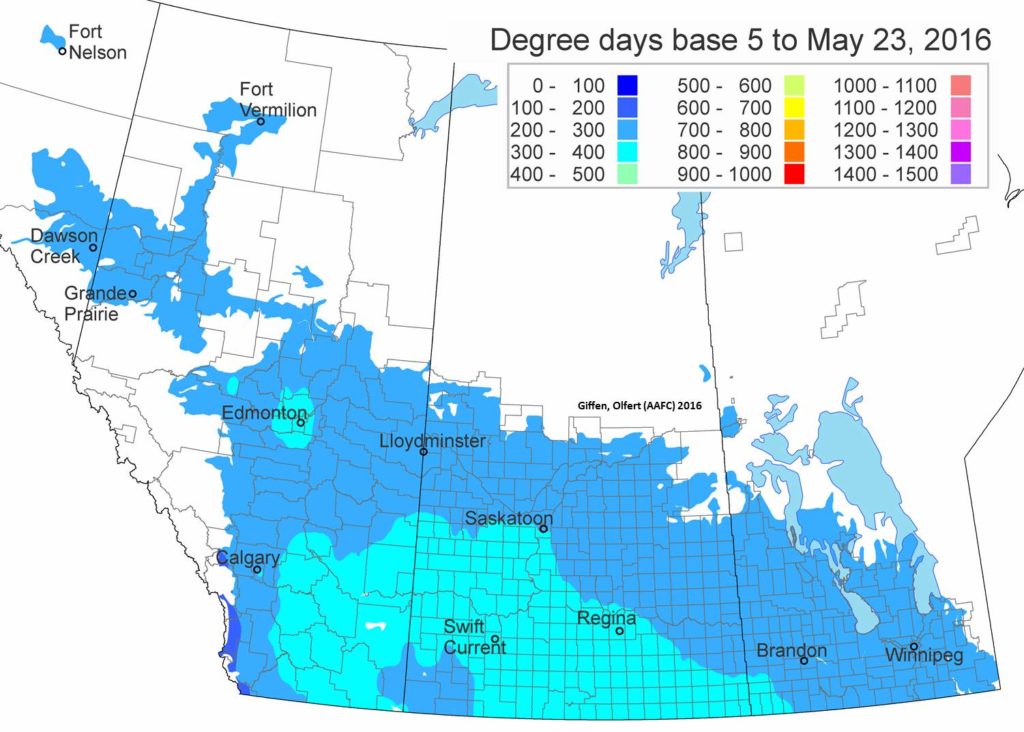
The updated growing degree day map (GDD) (Base 5ºC, March 1 – July 17, 2016) is below:


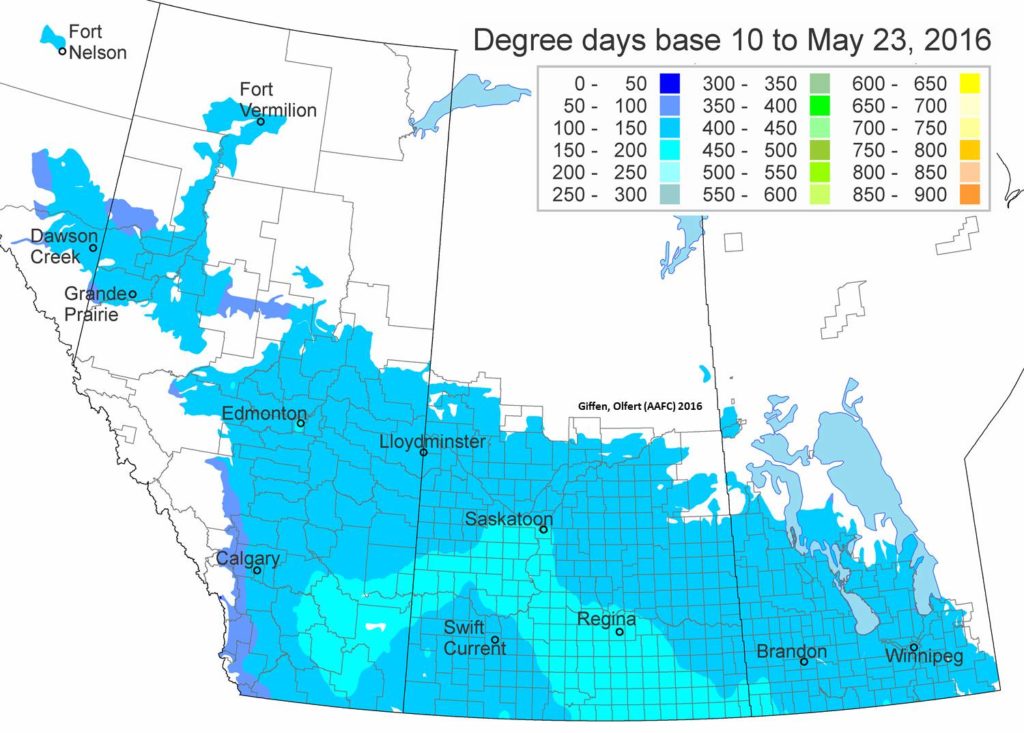
While the growing degree day map (GDD) (Base 10ºC, March 1 – July 17, 2015) is below:


The maps above are all produced by Agriculture and Agri-Food Canada.  Growers may wish to bookmark the AAFC Drought Watch Maps for the growing season.


Additional precipitation and temperature data or maps are provided by the following:
Manitoba AGriculture’s Crop Weather Report
Alberta Agriculture and Food’s Weather Stations
Environment Canada’s Historical Data Interface

Weekly Update – Weather Synopsis

Across the prairies, meteorological conditions were similar to long term average values for May 16-23, 2016. The average temperature was 11.1 °C and was much warmer than the previous seven days (8.7 °C) and was 1 °C warmer than the average temperature.  Temperatures were generally warmer in Manitoba and eastern Saskatchewan than western Saskatchewan and Alberta.


This past week, many Albertan locations reported significant rainfall amounts while minimal amounts were reported for Saskatchewan and Manitoba.  


The map below shows the Accumulated Precipitation the past 7 days (i.e., May 16-23, 2016) which fell as both rain and snow in the west: 


The map below reflects the Accumulated Precipitation for the Growing Season so far for the prairie provinces (i.e., April 1-May 24, 2016):


Compared to last week, soil moisture levels were predicted improve across most of Alberta.  Lower soil moisture values were predicted across most of Saskatchewan.


Again cooler temperatures put newly emerging crops at risk.  The map below shows the Lowest Temperatures the Past 7 Days (May 18-24, 2016) across the prairies:

The map below shows the Highest Temperatures the Past 7 Days (May 18-24, 2016):

The updated growing degree day map (GDD) (Base 5ºC, March 1 – May 23, 2016) is below:


While the growing degree day map (GDD) (Base 10ºC, March 1 – May 23, 2016) is below:


The maps above are all produced by Agriculture and Agri-Food Canada.  Growers may wish to bookmark the AAFC Drought Watch Maps for the growing season.

Grain News – Les Henry’s Annual Soil Moisture Map

On February 19, 2016, Grain News published Les Henry’s Annual Soil Moisture Map.


In the article, the map is described as,  “general conditions in general areas” but it estimates subsoil moisture from three inches to four feet. 


For reference, a copy of Les Henry’s map is included below but please link here to read the entire Grain News article.