The Prairie Pest Monitoring Network is excited to share our new website as we continue to update and expand! We have a few VERY IMPORTANT DETAILS below – please read on and Subscribe!
Re-Subscribe to receive our Weekly Updates – Due to Canada’s Anti-Spam Legislation and just plain good manners, we cannot copy your subscription from the old Blog to this new website. Please go to our homepage, click the red “subscribe today” button, type your email address in the white box, confirm you’re NOT a robot, then watch your Inbox or Spam folder to confirm your subscription. Subscribers receive the Weekly Update, Insect of the Week, and any new updates delivered to their Inbox in our new newsletter format.
Same great information – The new website is organized like the Blog. Risk maps, insect monitoring protocols, Weekly Updates, and Insect of the Week features are all easy to find. We’re still working in the background on the new website so don’t be surprised if you link back to the PPMN Blog – we’re keeping it but all new content will move to the new website as of July 10, 2020.
You made us a success – Thank you for using the Blog since it was launched in 2015! We are able to transition to a website now because the Blog is so popular. The new website overcomes some of the Blog shortcomings (e.g., data storage limits). In the future, we hope to introduce new tools to improve insect pest monitoring and insect pest management. Over the coming months, we will work to add information, pictures and links.
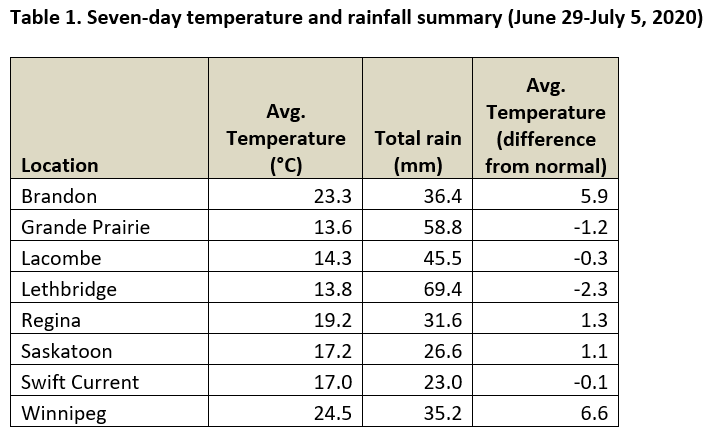
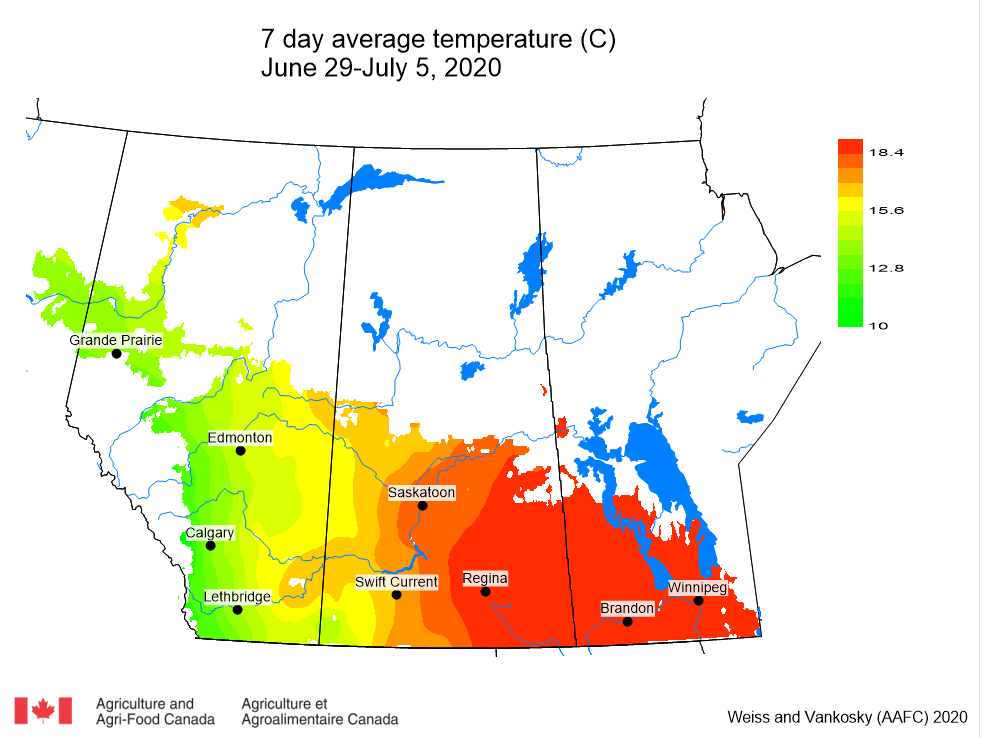
This week, June 29-July 5, 2020, prairie temperatures were warmest in Manitoba and eastern Saskatchewan and seven day cumulative rainfall varied across the prairies (Table 1). Average 7-day temperatures continue to be warmest across Manitoba and eastern Saskatchewan and coolest across most of Alberta (Fig. 1). The weekly average temperature at Winnipeg (24.5 °C) was 6.6 °C warmer than the long term average value and was 10.9 °C warmer than the 7-day observed temperature at Grande Prairie (Table 1; Fig. 1). The average weekly temperature for Lethbridge was 13.8 °C and 2.3 °C cooler than normal (Table 1).
Figure 1. Observed average temperatures across the Canadian prairies the past seven days (June 29-July 5, 2020).
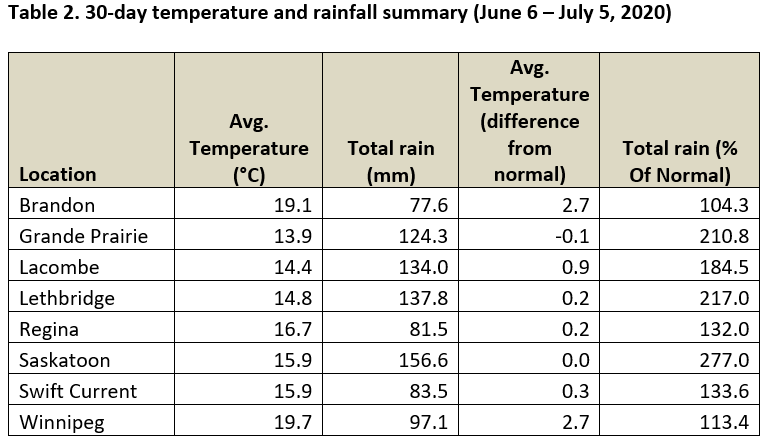
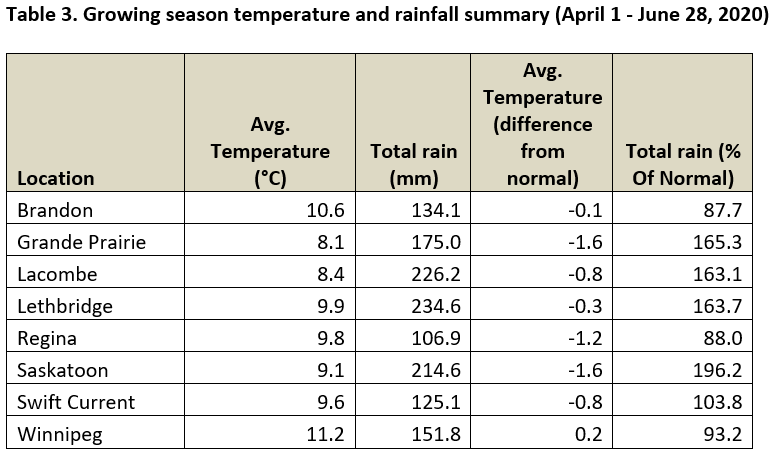
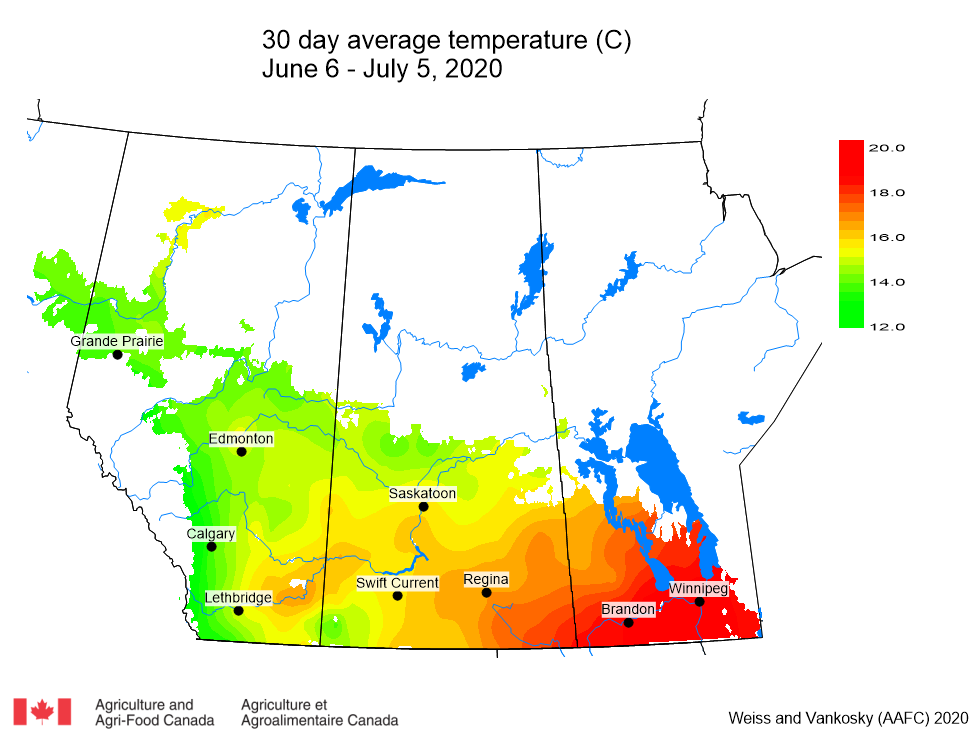
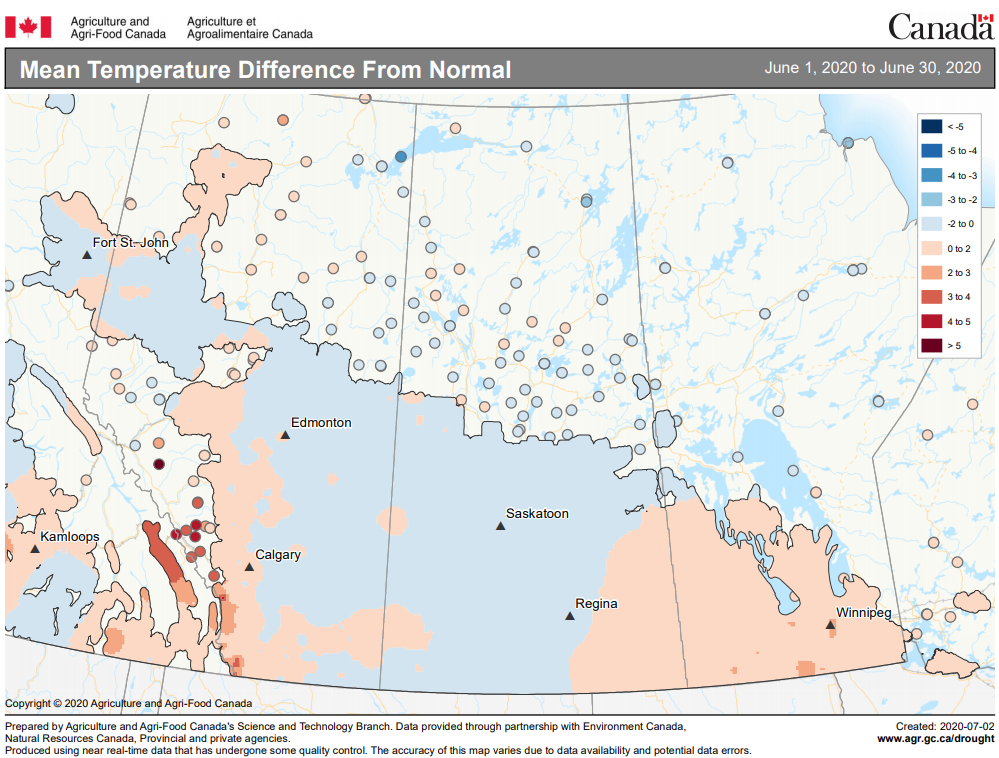
Average 30-day (June 6-July 5, 2020) temperatures continue to be cooler in Alberta than southern Saskatchewan and Manitoba (Table 2). The average 30-day temperature at Winnipeg and Brandon continued to be greater than locations in Alberta and Saskatchewan (Table 2; Fig. 2). June temperature anomalies indicate that temperatures have been below normal across most of Alberta and Saskatchewan and were 0 to 2 °C warmer than average across southeastern Saskatchewan and southern Manitoba (Table 2; Fig. 3). Based on growing season temperatures (April 1 – July 5, 2020), conditions were warmest for southern locations (Table 3).
Figure 2. Observed average temperatures across the Canadian prairies the past 30 days (June 6-July 5, 2020).Figure 3. Mean temperature difference from Normal for the month of June 2020. Image has not been reproduced in affiliation with, or with the endorsement of the Government of Canada and was retrieved (05Jul2020). Access the full map at http://www.agr.gc.ca/DW-GS/current-actuelles.jspx?lang=eng&jsEnabled=true&reset=1588297059209
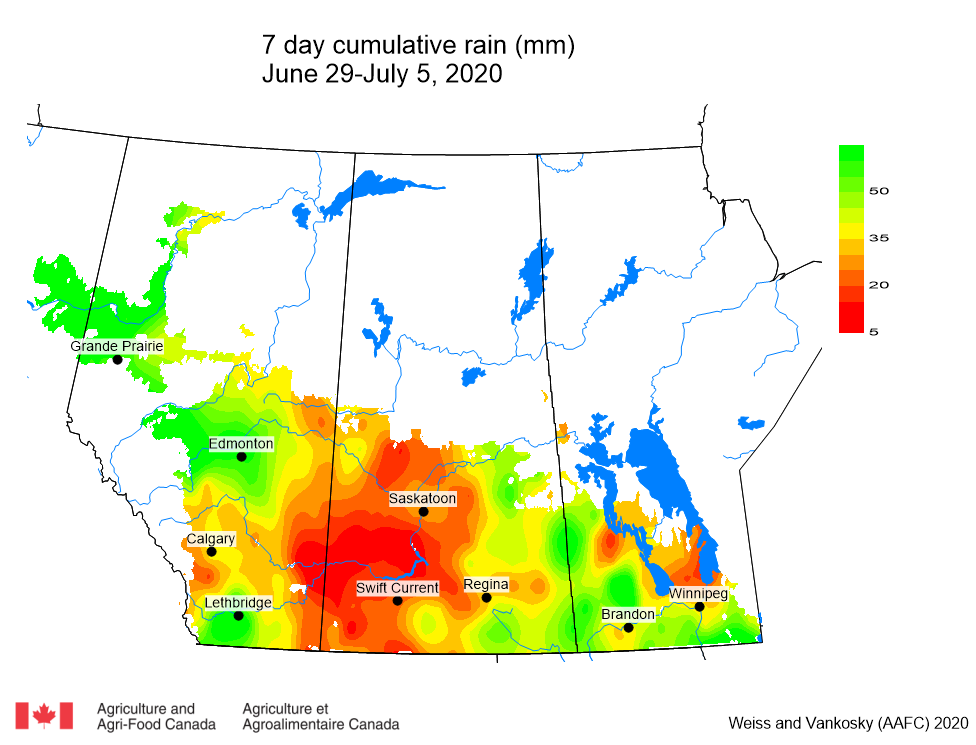
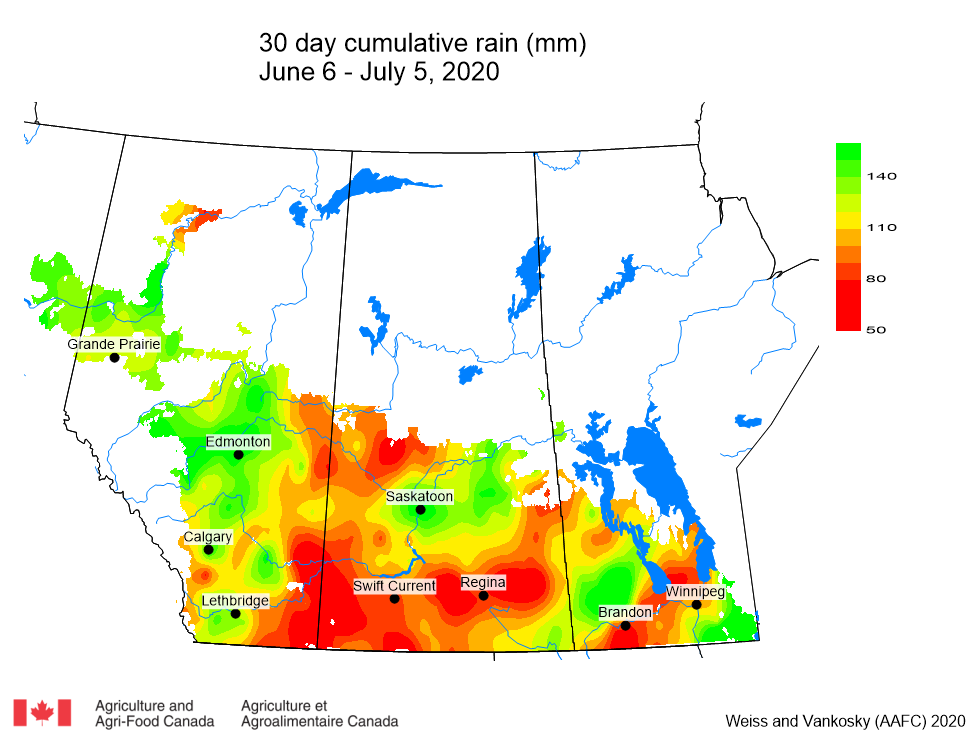
Cumulative rainfall for the past 7 days was lowest across western regions of Saskatchewan (Table 1; Fig. 4). Lethbridge reported 69.4 mm. Cumulative 30-day rainfall continued to be greatest across central regions of Alberta (Table 2; Fig. 5). Rainfall amounts were lowest across the most of Saskatchewan.
Figure 4. Observed cumulative precipitation across the Canadian prairies the past seven days (June 29-July 5, 2020).
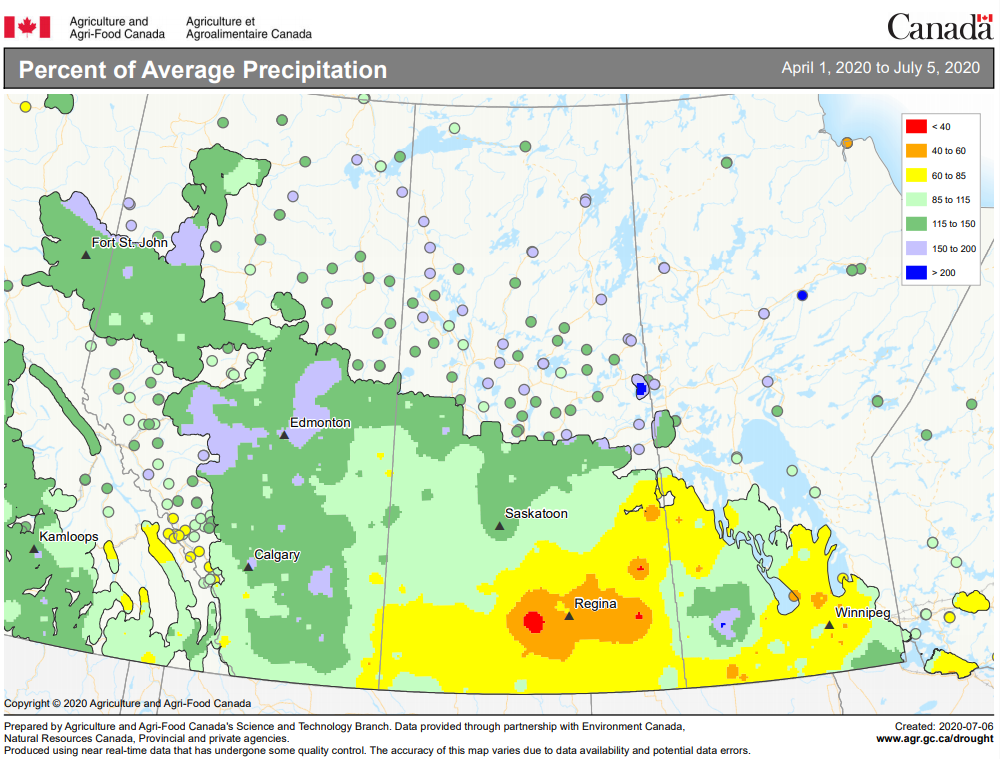
Total 30-day rainfall at Saskatoon, Lethbridge, Lacombe and Grande Prairie exceeded 100 mm (Table 2; Fig. 5). Saskatoon has reported 156.6 mm (277% of normal) in the past 30 days (Table 2). Growing season rainfall (percent of average) is below normal southern Saskatchewan and most of Manitoba. Rainfall amounts are above average across central regions of Saskatchewan and across Alberta.
Figure 5. Observed cumulative precipitation across the Canadian prairies the past 30 days (June 6-July 5, 2020).Figure 6. Percent of average precipitation for the growing season (April 1-July 5, 2020). Image has not been reproduced in affiliation with, or with the endorsement of the Government of Canada and was retrieved (05Jul2020). Access the full map at http://www.agr.gc.ca/DW-GS/current-actuelles.jspx?lang=eng&jsEnabled=true&reset=1588297059209
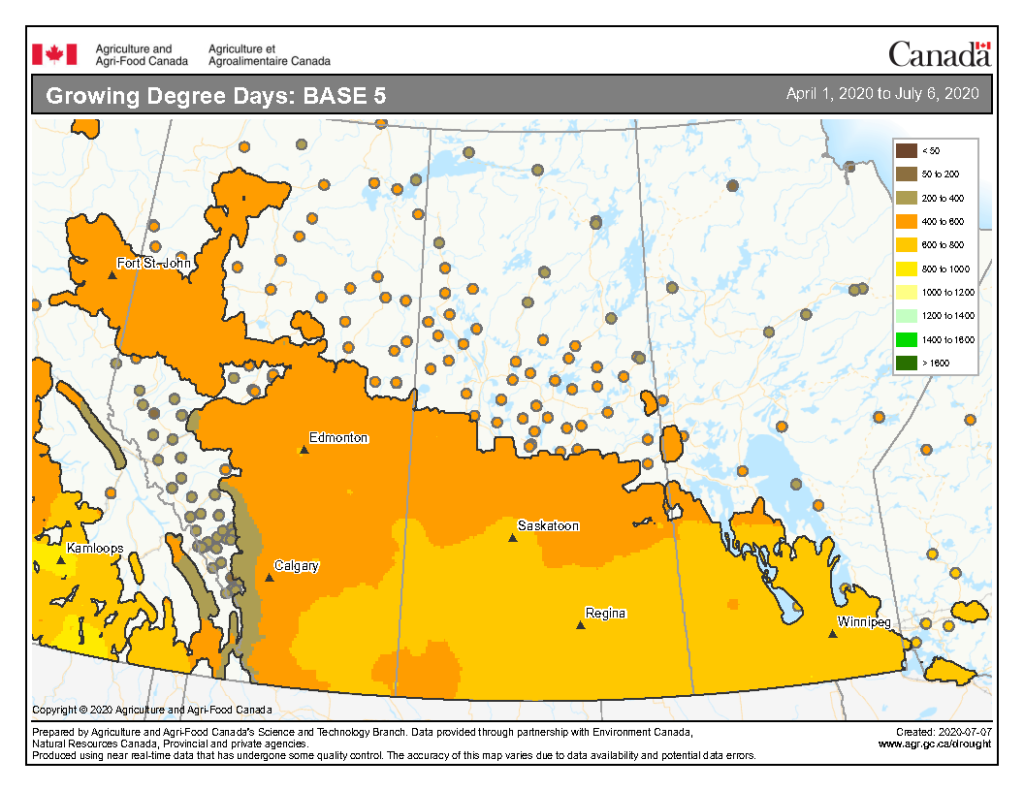
The growing degree day map (GDD) (Base 5 ºC, April 1-July 6, 2020) is below (Fig. 7):
Figure 7. Growing degree day map (Base 5 °C) observed across the Canadian prairies for the growing season (April 1-July 6, 2020). Image has not been reproduced in affiliation with, or with the endorsement of the Government of Canada and was retrieved (09Jul2020). Access the full map at http://www.agr.gc.ca/DW-GS/current-actuelles.jspx?lang=eng&jsEnabled=true&reset=1588297059209
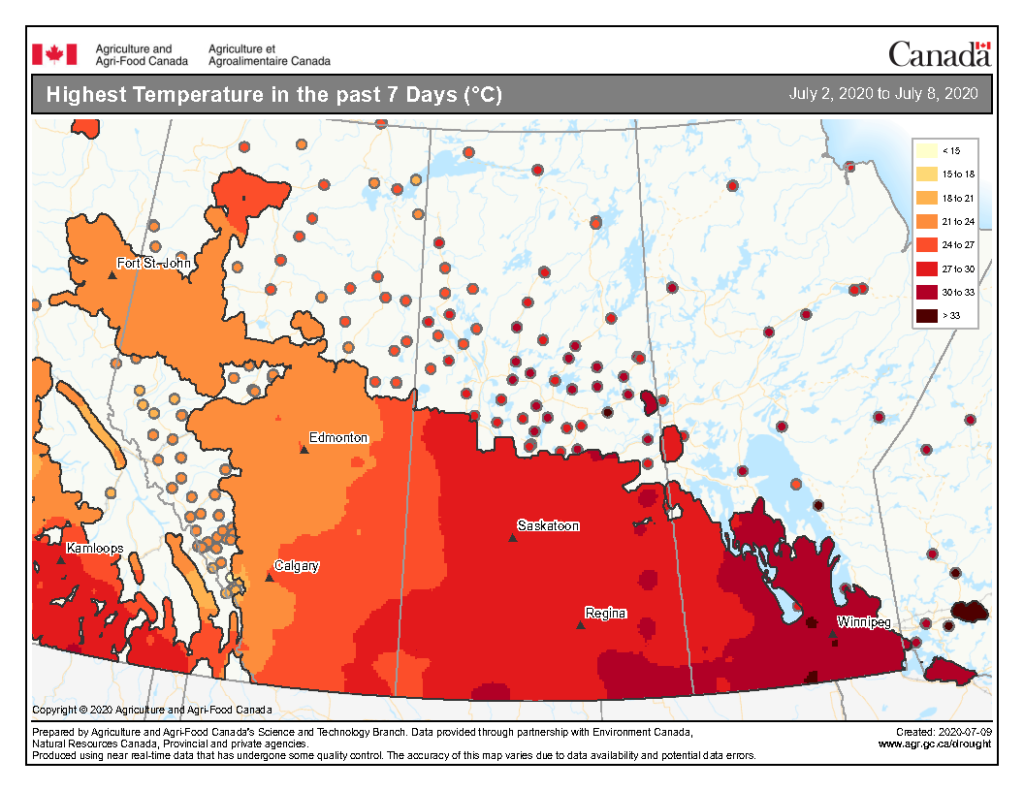
The highest temperatures (°C) observed the past seven days ranged from <15 to >33 °C in the map below (Fig. 8).
The maps above are all produced by Agriculture and Agri-Food Canada. Growers can bookmark the AAFC Current Conditions Drought Watch Maps for the growing season. Historical weather data can be access at the AAFC Drought Watch website, Environment Canada’s Historical Data website, or your provincial weather network.
Wheat midge overwinter as larval cocoons in the soil. Soil moisture conditions in May and June can have significant impact on wheat midge emergence. Adequate rainfall promotes termination of diapause and movement of larval to the sol surface where pupation occurs. Insufficient rainfall in May and June can result in delayed movement of larvae to the soil surface. Elliott et al. (2009) reported that wheat midge emergence was delayed or erratic if rainfall did not exceed 20-30 mm during May. Olfert et al. (2016) ran model simulations to demonstrate how rainfall impacts wheat midge population density. Our wheat midge model (Olfert et al. 2020) indicates that dry conditions may result in: (a) Delayed adult emergence and oviposition, (b) Reduced numbers of adults and eggs.
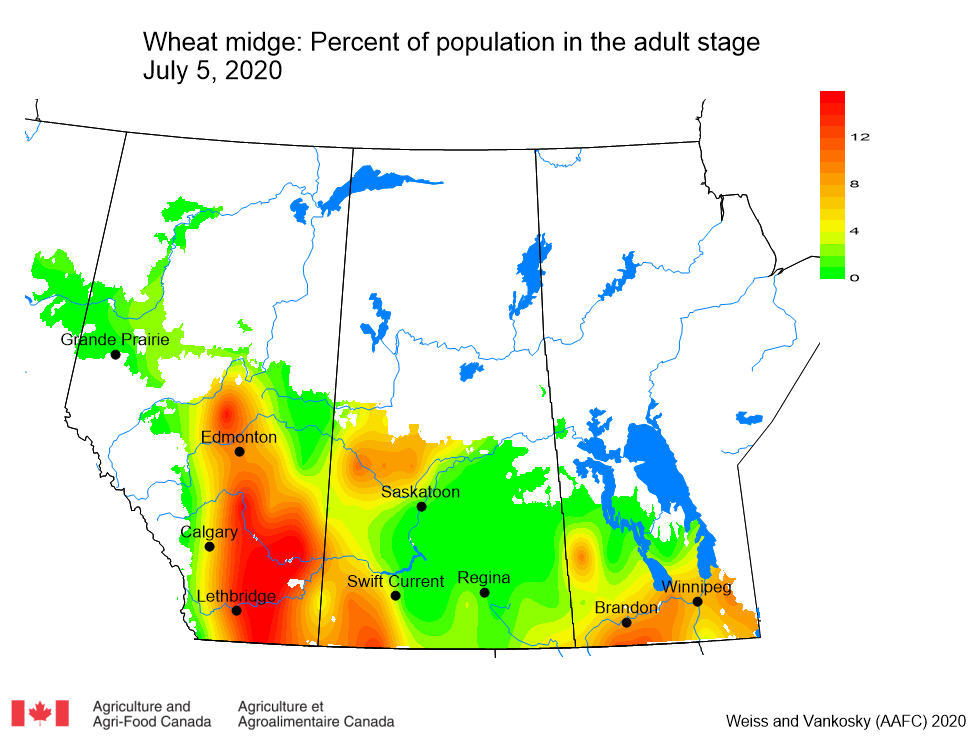
Wheat midge model runs indicate that, where wheat midge are present, pupation is occurring across Alberta, northwest Saskatchewan and southern Manitoba (Fig. 1). Simulations suggest that, though still less than 15%, adult emergence has begun, most notably across Alberta (Fig. 1). Females lay eggs on developing wheat heads. This typically occurs in evenings when winds are calm. Wheat midge monitoring protocol suggests that wheat fields should be inspected for adults in late June and early July as wheat heads are emerging. The next three weeks are very important for monitoring wheat midge populations for the purpose of making management decisions.
Figure 1. Predicted percent of population of wheat midge (Sitodiplosis mosellana) at adult stage across the Canadian prairies (as of July 5, 2020).
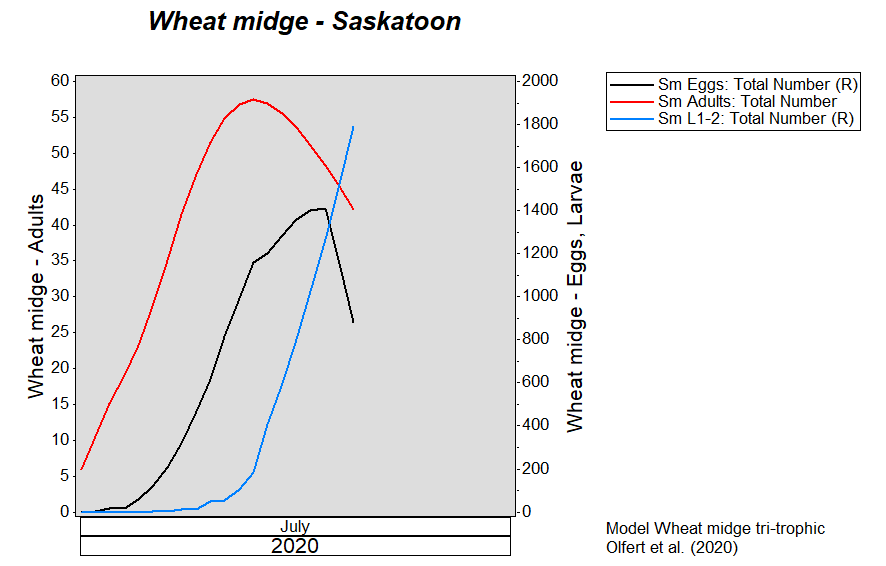
Simulations were run to July 21 to assess population development over the next two weeks (Figs. 2-4). The first graph illustrates development of wheat midge populations near Saskatoon (Fig. 2). Adult emergence has begun and should peak next week, suggesting that monitoring fields for adults should begin in the next few days. Oviposition has just started and larvae will occur soon after.
Figure 2. Predicted wheat midge (Sitodiplosis mosellana) phenology at Saskatoon SK projected to July 21, 2020.
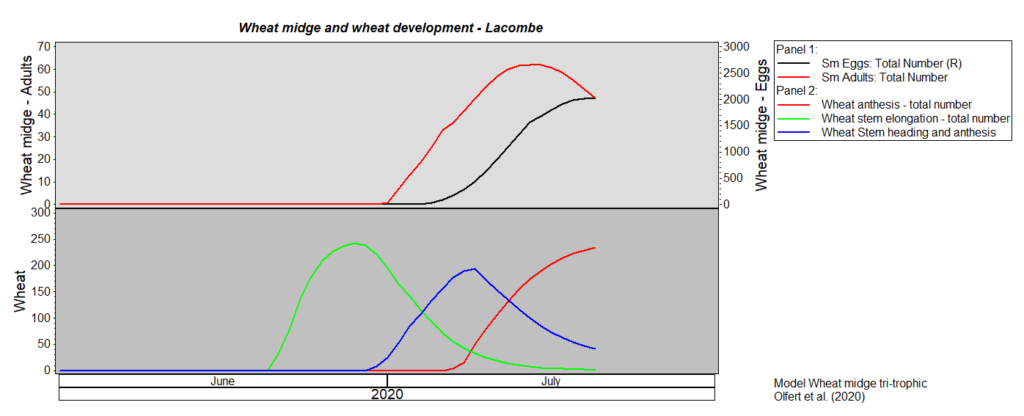
The second graph compares synchrony between wheat midge and wheat for fields near Lacombe (Fig. 3). The graph indicates that adult emergence and oviposition may occur this year when the crop is most susceptible.
Figure 3. Comparison of predicted phenology of wheat midge (Sitodiplosis mosellana) and wheat at Lacombe AB projected to July 21, 2020.
The last graph compares phenology of wheat midge adults near Saskatoon with the phenology of Macroglenes penetrans, a parasitoid of wheat midge (Fig. 4). The parasitioid wasp lays is eggs inside wheat midge eggs. The graph shows that the timing of emergence and oviposition of wheat midge adults is similar to the emergence and oviposition timing of M. penetrans. All of this information can be used as a guide to determine when fields should be monitored.
Figure 4. Comparison of predicted phenology of wheat midge (Sitodiplosis mosellana) and its parasitoid, Macroglenes penetrans, at Saskatoon SK projected to July 21, 2020.
More information about Wheat midge can be found by accessing the pages from the new “Field Crop and Forage Pests and their Natural Enemies in Western Canada: Identification and Field Guide”. View ONLY the Wheat midge pages but remember the guide is available as a free downloadable document as both an English-enhanced or French-enhanced version.
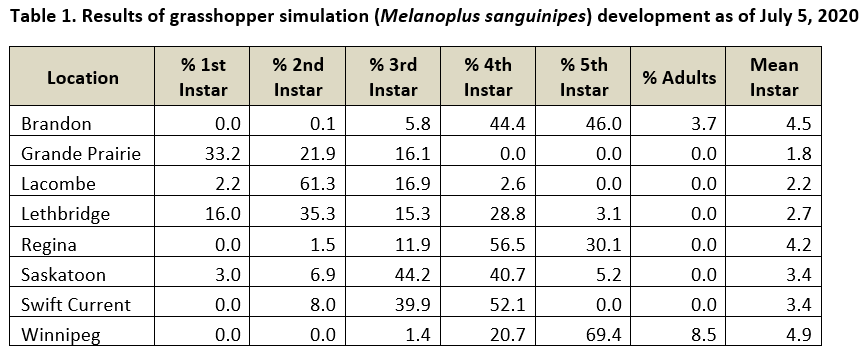
As of July 5, 2020, the grasshopper model estimates that hatch is essentially complete. Development is slowest in the Peace River region where the simulation indicates that approximately 30% of the population is still in the egg stage (Fig. 1). Across the prairies, the majority of the nymphal population is predicted to be in the second to fourth instar stages (Table 1; Fig. 1). Development in Manitoba is predicted to be well ahead of most locations across Alberta (Table 1; Fig. 1). Recent warm temperatures in eastern Saskatchewan and Manitoba have resulted in higher rates of grasshopper development. This week, adults are predicted to occur at locations across southern Manitoba and southeastern Saskatchewan (Table 1; Fig. 1). Across the prairies, populations are predicted to be 11, 9, 25, 25, 22, 8 and less than 1% in egg, first, second, third, fourth, fifth and adult stages, respectively (Table 1).
Figure 1. Predicted average instar stages of grasshopper (Melanoplus sanguinipes) populations across the Canadian prairies (as of July 5, 2020).
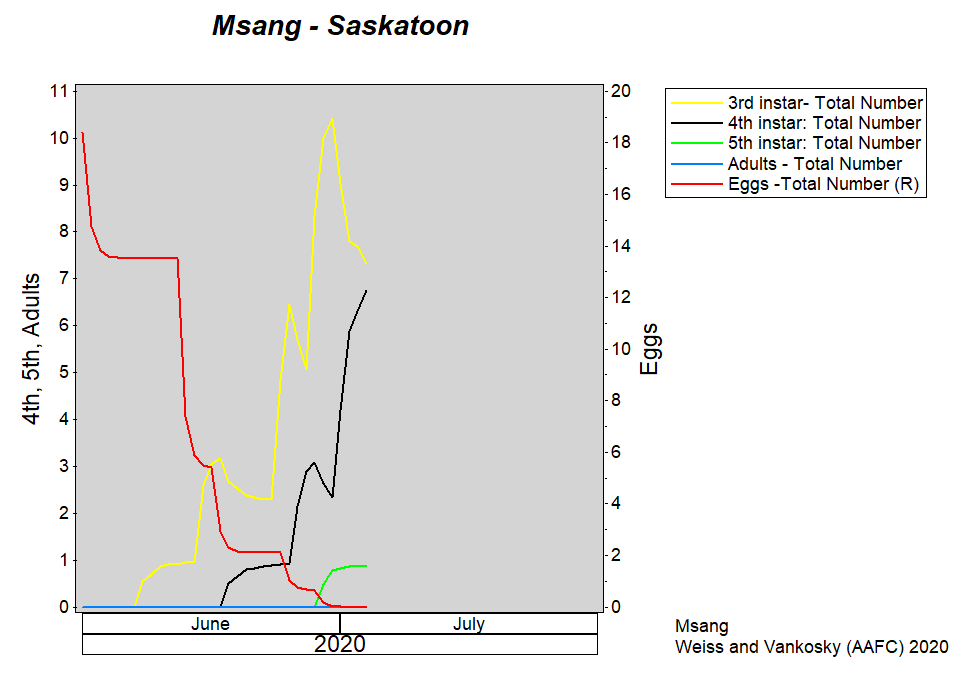
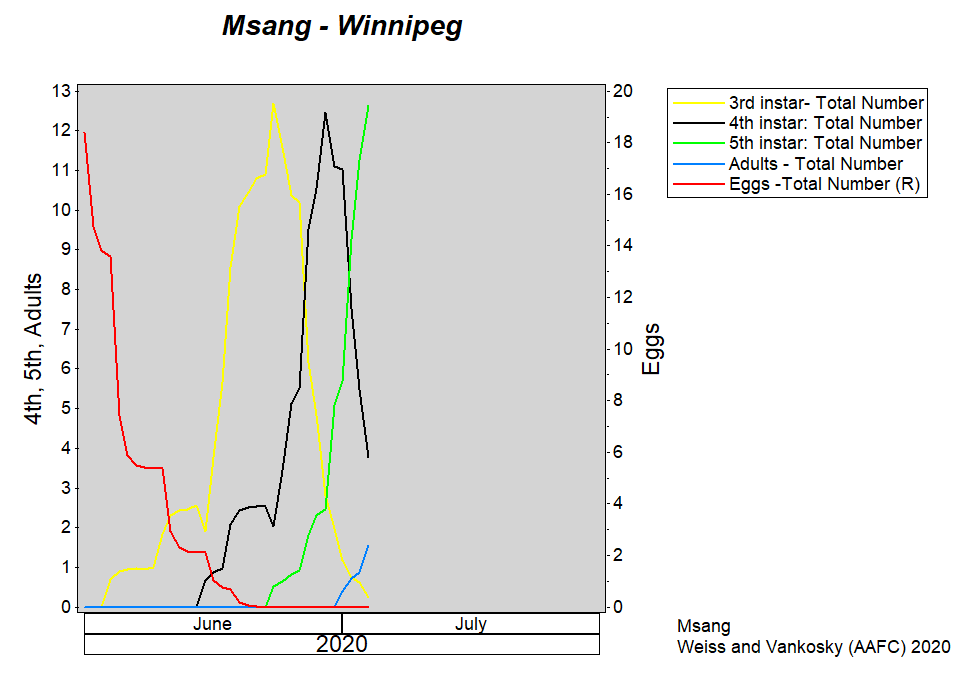
The two graphs compare predicted development for Saskatoon (Fig. 2) and Winnipeg (Fig. 3). Grasshopper populations near Saskatoon are expected to be predominantly in the third and fourth instars (Fig. 2) while populations near Winnipeg are expected to be primarily in the fifth instar with some adults beginning to appear (Fig. 3).
Figure 2. Predicted grasshopper (Melanoplus sanguinipes) phenology at Saskatoon SK. Values are based on model simulations (April 1-July 5, 2020).Figure 3. Predicted grasshopper (Melanoplus sanguinipes) phenology at Winnipeg MB. Values are based on model simulations (April 1-July 5, 2020).
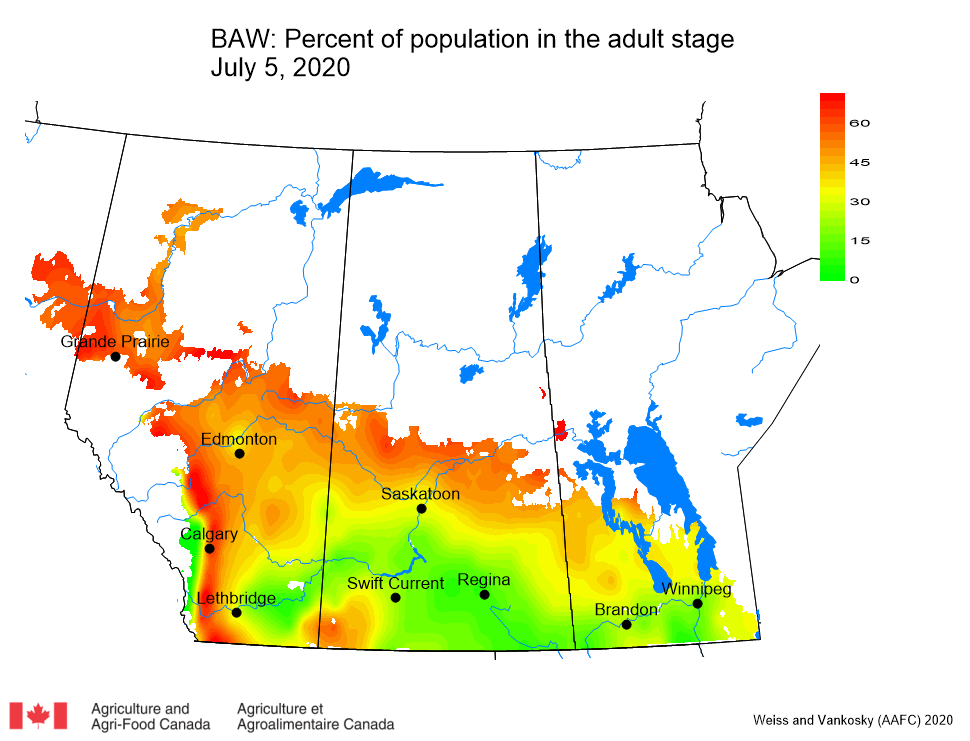
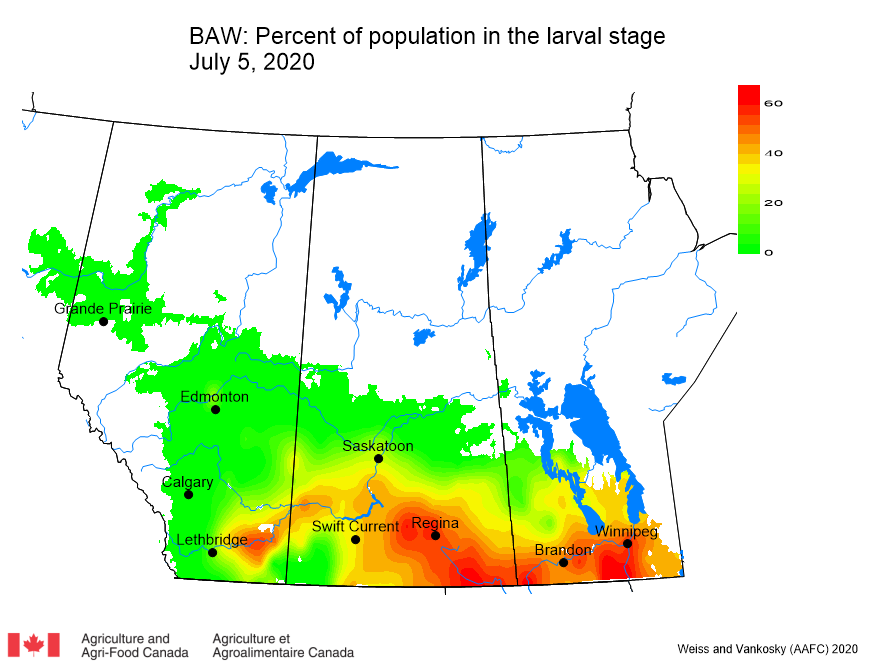
Model simulations for July 5, 2020, indicate that 5 % of the population is in the pupal stage (26 % last week), 43 % is in the adult stage (52 % last week), and 37 % of the population is in the egg stage (20 % last week). In southern Manitoba and southeastern Saskatchewan, larval stages are predicted to increase this week (14 % compared to 2 % last week). Across the Parkland and Peace River regions, BAW populations are predicted to be mostly adults with oviposition occurring in these areas (Fig. 1). Operation of BAW traps in these areas should continue until adult emergence is complete. Populations across southern regions are primarily in the larval stage (Fig. 2).
Figure 1. Predicted percent of bertha armyworm (Mamestra configurata) population in the adult stageas of July 5, 2020.Figure 2. Predicted percent of bertha armyworm (Mamestra configurata) population in the larval stageas of July 5, 2020.
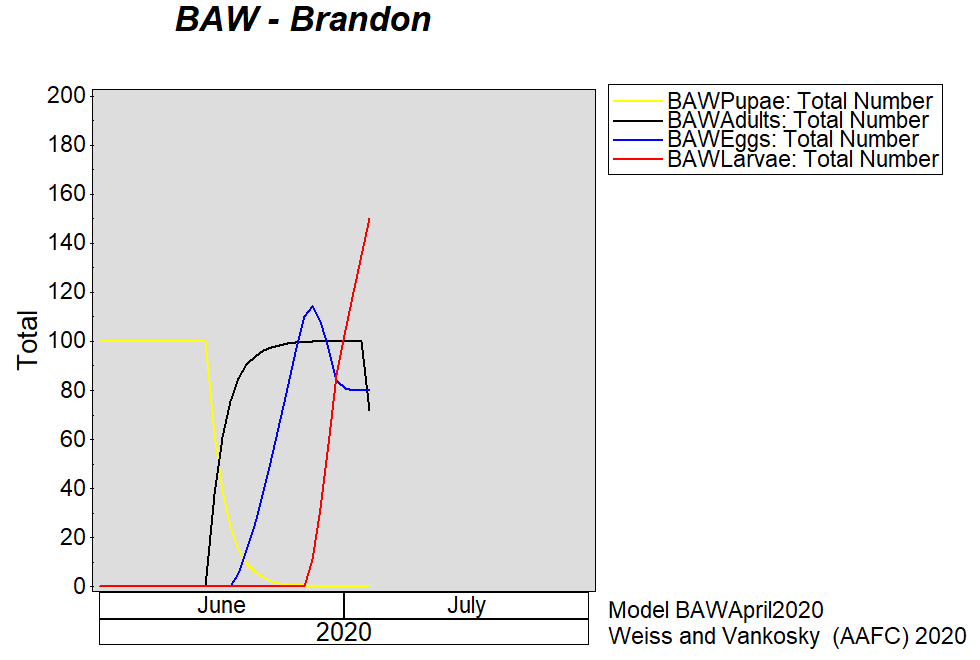
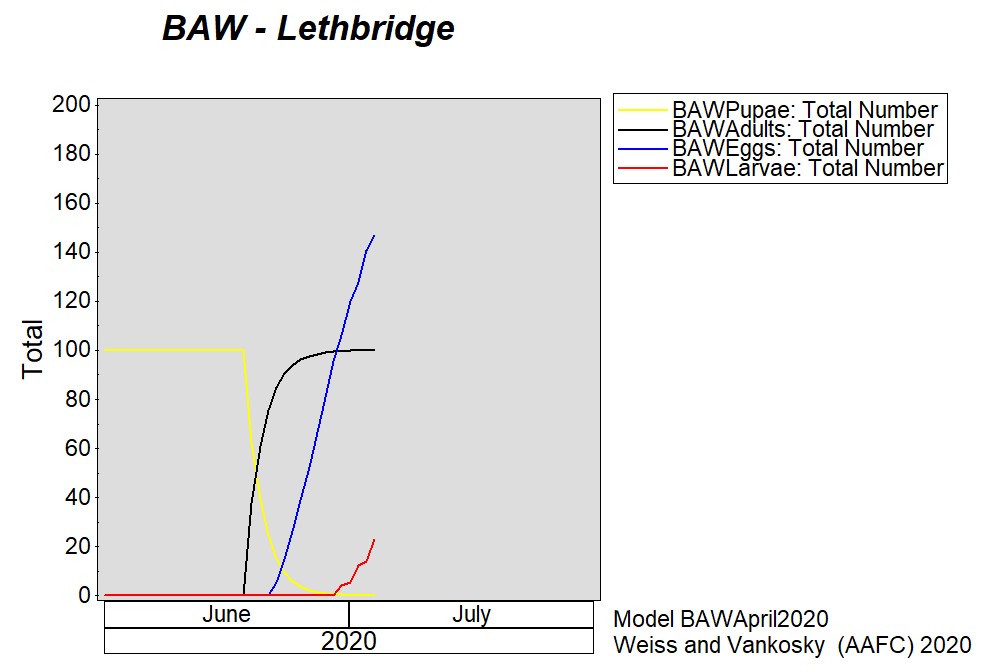
The two graphs demonstrate that larval development near Brandon (Fig. 3) is predicted to be ahead of fields near Lethbridge (Fig. 4).
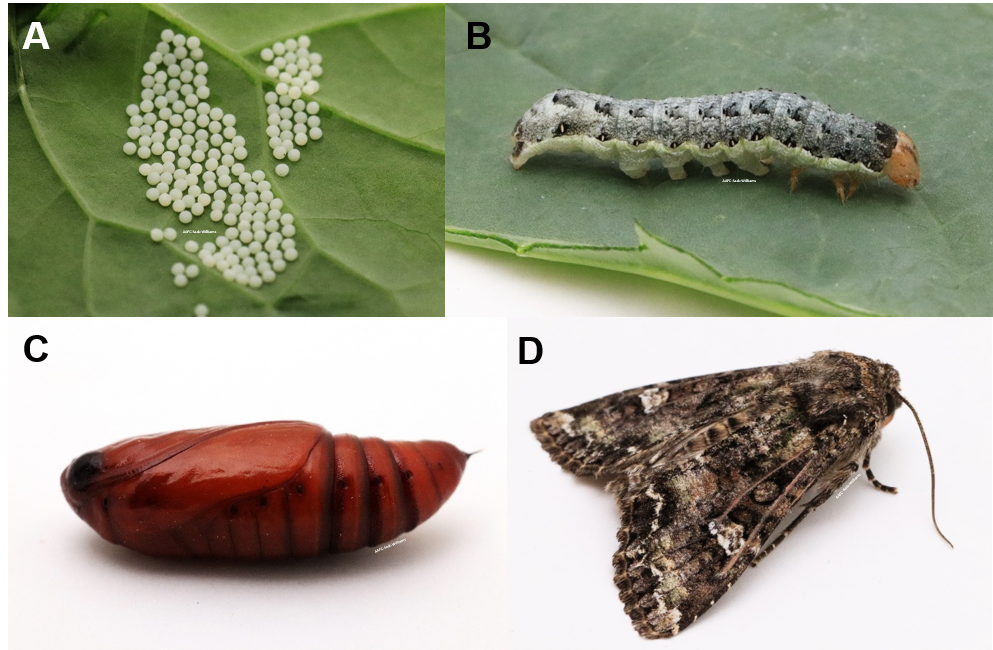
Figure 3. Predicted bertha armyworm (Mamestra configurata) phenology at Brandon MB as of July 5, 2020.Figure 4. Predicted bertha armyworm (Mamestra configurata) phenology at Lethbridge AB as of July 5, 2020.Figure 5. The egg stage (A), larval stage (B), pupal stage (C), and adult stage (D) of bertha armyworm. Photos: Jonathon Williams (AAFC-Saskatoon).
Weekly Pheromone-baited Trapping Results – Early season detection of bertha armyworm is improved through the use of pheromone-baited unitraps traps deployed in fields across the Canadian prairies. Click each province name to access moth reporting numbers observed in Alberta, Saskatchewan and Manitoba(as they become available). Check these sites to assess cumulative counts and relative risk in your geographic region but remember in-field scouting is how the economic threshold is applied to manage this pest.
Refer to the PPMN Bertha armyworm monitoring protocol for help when performing in-field scouting. Use the images above (Fig. 5) to help identify the economically important larvae. Review the 2019 Insect of the Week which featured bertha armyworm and its doppelganger, the clover cutworm!
Biological and monitoring information related to bertha armyworm in field crops is posted by the provinces of Manitoba, Saskatchewan, Alberta and the Prairie Pest Monitoring Network. Also refer to the bertha armyworm pages within the “Field Crop and Forage Pests and their Natural Enemies in Western Canada: Identification and management field guide” which is a free downloadable document as both an English-enhanced or French-enhanced version.
Once diamondback moth is present in the area, it is important to monitor individual canola fields for larvae. Warm growing conditions can quickly translate into multiple generations in a very short period!
Wind Trajectory Updates – Completed for 2020 growing season as of Week 09 (released June 22, 2020).
Weekly Pheromone-baited Trapping Results – Early season detection of diamondback moth is improved through the use of pheromone-baited delta traps deployed in fields across the Canadian prairies. Click each province to access moth reporting numbers observed in Alberta, Saskatchewan and Manitoba as they become available. Check these sites to assess cumulative counts and relative risk in your geographic region.
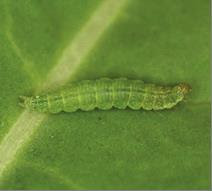
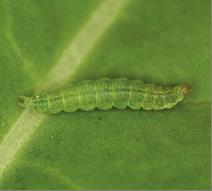
Monitoring:Remove the plants in an area measuring 0.1 m² (about 12″ square), beat them on to a clean surface and count the number of larvae (Fig. 1) dislodged from the plant. Repeat this procedure at least in five locations in the field to get an accurate count.
Figure 1. Diamondback larva measuring ~8 mm long.Note brown head capsule and forked appearance of prolegs on posterior.
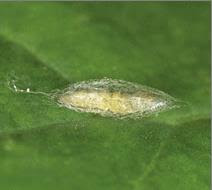
Figure 2. Diamondback moth pupa within silken cocoon.
Economic threshold for diamondback moth in canola at the advanced pod stage is 20 to 30 larvae/ 0.1 m² (approximately 2-3 larvae per plant). Economic thresholds for canola or mustard in the early flowering stage are not available. However, insecticide applications are likely required at larval densities of 10 to 15 larvae/ 0.1 m² (approximately 1-2 larvae per plant).
Models runs predicting spring adult activity, oviposition and larval development for this pest are completed as of Week 9 (June 21, 2020). Use the following information to aid in-field scouting for larvae.
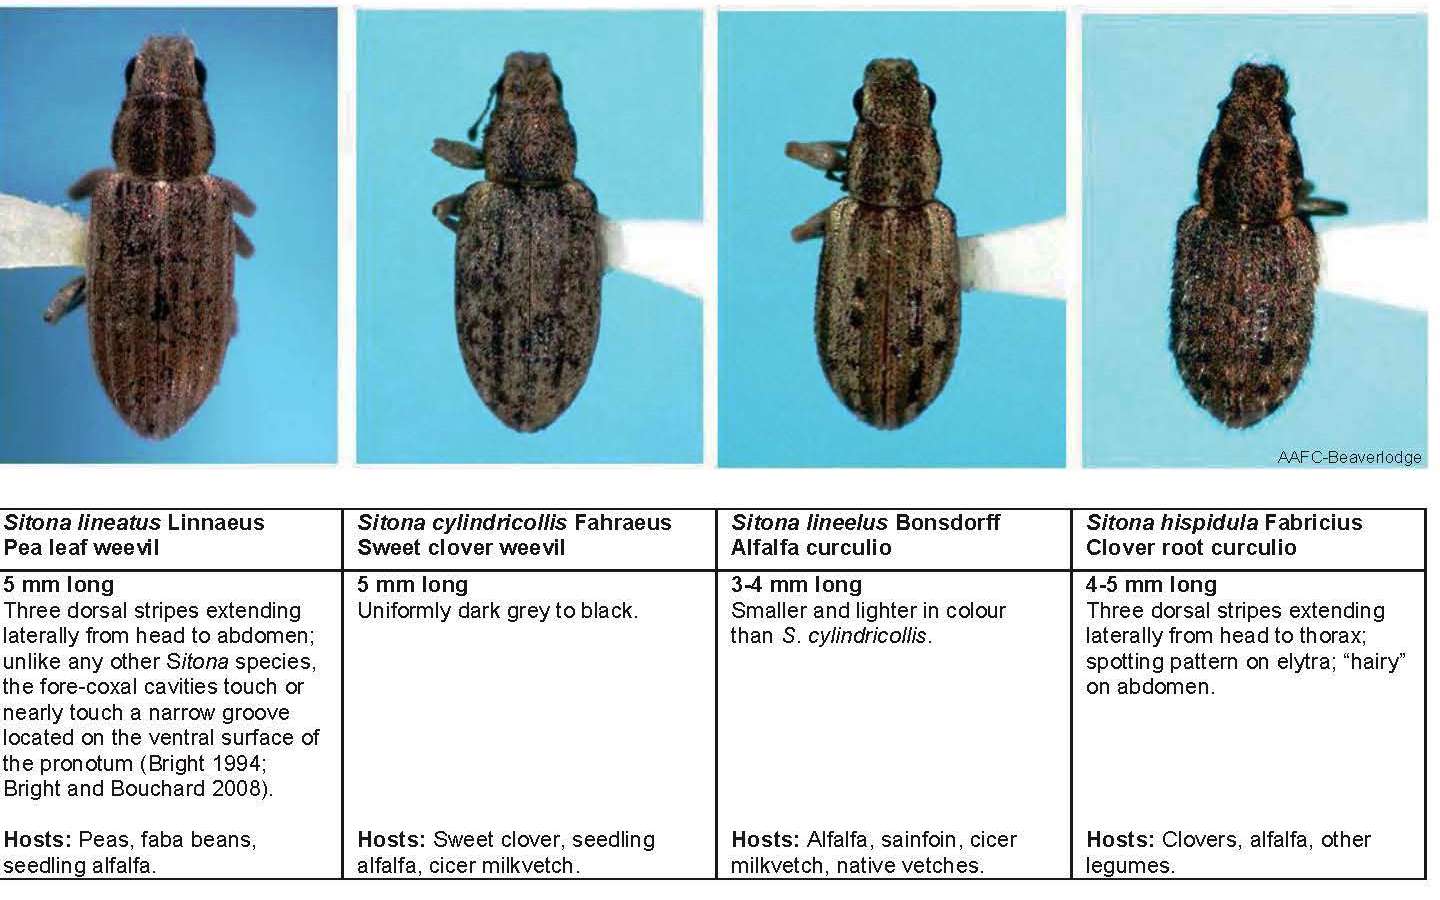
The pea leaf weevil is a slender greyish-brown insect measuring approximately 5 mm in length (Fig. 1, Left image). Pea leaf weevil resembles the sweet clover weevil (Sitona cylindricollis) but the former is distinguished by three light-coloured stripes extending length-wise down thorax and sometimes the abdomen. All species of Sitona, including the pea leaf weevil, have a short snout.
Figure 1. Comparison images and descriptions of four Sitona species adults including pea leaf weevil (Left).
Adults will feed upon the leaf margins and growing points of legume seedlings (alfalfa, clover, dry beans, faba beans, peas) and produce a characteristic, scalloped (notched) edge. Females lay 1000 to 1500 eggs in the soil either near or on developing pea or faba bean plants from May to June.
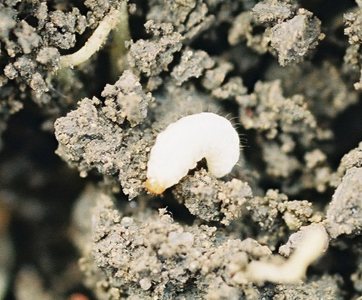
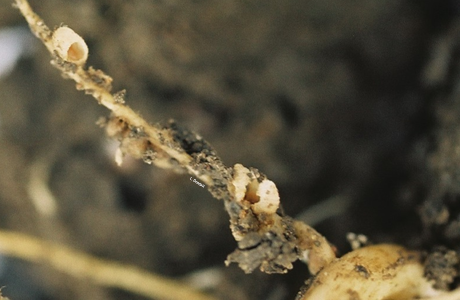
Larvae develop under the soil and are “C” shaped and milky-white with a dark-brown head capsule ranging in length from 3.5-5.5 mm (Figure 2). Larvae develop through five instar stages. After hatching, larvae seek and enter the roots of a pea plant. Larvae will enter and consume the contents of the nodules of the legume host plant. It is the nodules that are responsible for nitrogen-fixation which affect yield plus the plant’s ability to input nitrogen into the soil. Consumption of or damage to the nodules (Figure 3) results in partial or complete inhibition of nitrogen fixation by the plant and results in poor plant growth and low seed yields.
Figure 2. Larva of pea leaf weevil in soil (Photo: L. Dosdall).Figure 3. Damaged pea nodules (Photo: L. Dosdall).
Biological and monitoring information related to pea leaf weevil in field crops is posted by the province of Alberta and in the PPMN monitoring protocol.
Aphids can cause significant damage to fields and increase crop losses but low densities in a grain field sometimes have little economic impact on production. This is especially true if the aphid’s natural enemies (beneficial insects) are present in the field because they can keep the aphids under control.
The Cereal Aphid Manager is an easy-to-use mobile app that helps farmers and crop advisors control aphid populations in wheat, barley, oat or rye. It is based on Dr. Tyler Wist’s (AAFC-Saskatoon) Dynamic Action Threshold model. The model treats the grain field as an ecosystem and takes into account many complex biological interactions including:
the number of aphids observed and how quickly they reproduce
the number of different natural enemies of aphids in the field and how many aphids they eat or parasitize per day
the lifecycles of aphids and their enemies taking into account developmental stages, egg laying behaviour, population growth rate, lifespan, etc.
Frequent in-field scouting, supported by the app’s dynamic threshold, allows growers to weigh the above factors and the app predicts what the aphid population will be in seven days and the best time to apply insecticide based on economic thresholds.
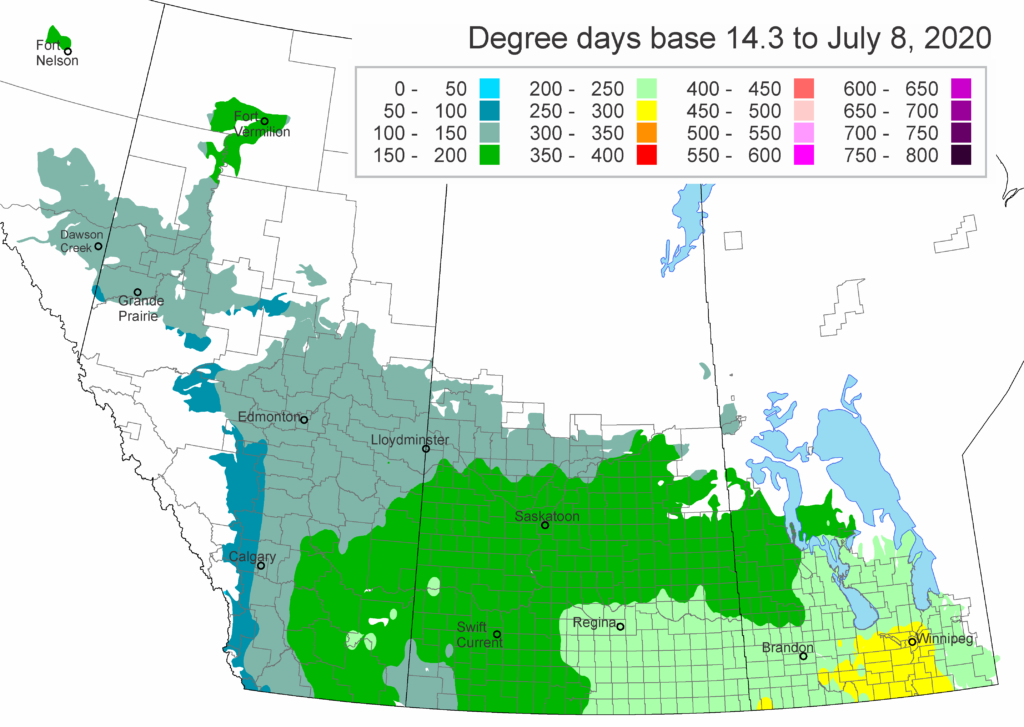
The following is offered to predict when Culex tarsalis, the vector for West Nile Virus, will begin to fly across the Canadian prairies (Fig. 1). This week, regions most advanced in degree-day accumulations for Culex tarsalis are shown in the map below. As of July 8, 2020, areas highlighted yellow are approaching sufficient heat accumulation for mosquitoes to emerge. Plan to protect yourself by wearing DEET!
Figure 1. Predicted development of Culex tarsalis, across the Canadian prairies (as of July 8, 2020).
Reminder – Field scouting is critical – it enables the identification of potential risks to crops. Accurate identification of insect pests PLUS the application of established monitoring methods will enable growers to make informed pest management decisions.
We offer TWO generalized insect pest scouting charts to aid in-field scouting on the Canadian prairies:
Whenever possible, monitor and compare pest densities to established economic or action thresholds to protect and preserve pollinators and beneficial arthropods. Economic thresholds, by definition, help growers avoid crop losses related to outbreaking insect pest species.
The Field Heroes campaign continues to raise awareness of the role of beneficial insects in western Canadian crops. Check the recently updated Field Heroes website for scouting guides, downloadable posters, and videos. Learn about these important organisms at work in your fields!
Real Agriculture went live in 2020 with a Pest and Predators podcast series!
• Access Episode 1 – Do you know your field heroes? Jennifer Otani (Agriculture and Agri-Food Canada-Beaverlodge) and Shaun Haney (RealAg). Published online May 12, 2020.
• Access Episode 3 – How much can one wasp save you? Haley Catton (Agriculture and Agri-Food Canada-Lethbridge) and Shaun Haney (RealAg). Published online June 9, 2020.
Provincial entomologists provide insect pest updates throughout the growing season so link to their information:
• Manitoba‘s Crop Pest Updates for 2020 are available. Access the July 8, 2020 report. The summary indicates that, “Armyworms are being found at high levels in many cereal and forage grass fields in the Eastern, Interlake, Central, and Southwest regions. High levels of grasshoppers continue to be found and controlled in some areas.”
• Alberta Agriculture and Forestry’s Agri-News occasionally includes insect-related information or Twitter users can connect to #ABBugChat Wednesdays at 10:00 am.
Another busy week of in-field monitoring, data collection, and field tour events for all our Staff! A reminder that, from now until mid-July, the Weekly Update may need to be posted in multiple segments (i.e., at any point from Wednesday-Saturday). Please bookmark the Blog or subscribe to receive the latest growing season information!
This week, special thanks to Ross Weiss (AAFC-Saskatoon) – entomologist and the integral modeler who works to generate all the weekly wind trajectory, meteorological, and predictive model updates supporting the Prairie Pest Monitoring Network.
Temperatures this week, June 18-24, 2019, were similar to last week. Over the past seven days temperatures were cooler than normal. The warmest temperatures were observed across MB while temperatures were cooler in western SK and across AB (Fig. 1). The is a complete reversal to last week.
Figure 1. Average temperature (°C) across the Canadian prairies the past seven days (June 16-24 2019).
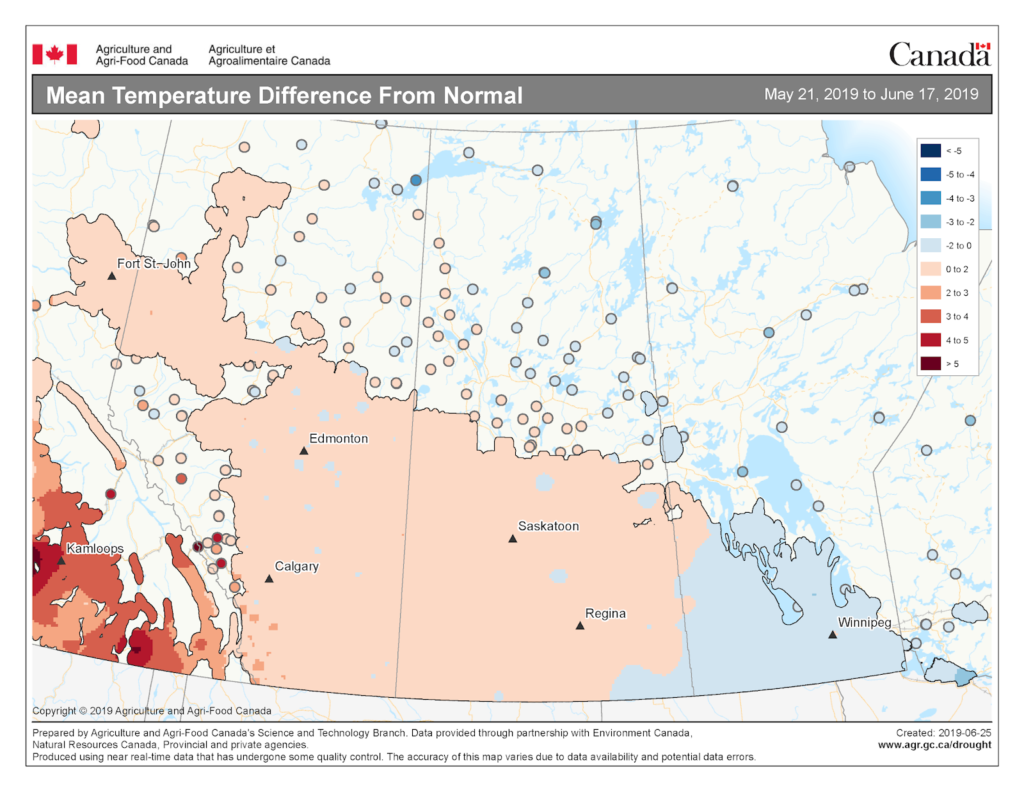
Average 30 day temperatures were warmest across southern MB and SK (Fig. 2). Cooler temperatures were reported across eastern and northern AB. The mean temperature differences from normal (May 21 – June 17, 2019) have been zero to two °C warmer than normal for AB and SK while temperatures in MB have been zero to two °C cooler than normal (Fig. 3).
Figure 2. Average temperature (°C) across the Canadian prairies the past 30 days (May 26-June 24 2019). Figure 3. Mean temperature difference from Normal across the Canadian prairies over the past 30 days (to June 17, 2019). Image has not been reproduced in affiliation with, or with the endorsement of the Government of Canada and was retrieved (25Jun2019). Access the full map at http://www.agr.gc.ca/DW-GS/current-actuelles.jspx?lang=eng&jsEnabled=true
Growing season temperatures (April 1-June 24, 2019) have been warmest across the southern prairies (Fig. 4). The warmest growing season temperatures have been reported for southern AB and an area south of Winnipeg MB. Across the prairies, the average growing season temperature has been 1.2 °C below normal.
Figure 4. Average temperature (°C) across the Canadian prairies for the growing season (April 1-June 24 2019).
This past week significant rainfall amounts were reported for most of SK and across central regions of AB (Fig. 5). Across the prairies, rainfall amounts for the past 30 days (May 26 – June 24, 2019) have been near normal (Fig. 6). The Edmonton region has been the wettest.
Figure 5. Cumulative precipitation observed the past seven days across the Canadian prairies (June 18-24 2019). Figure 6. Cumulative precipitation observed the past 30 days across the Canadian prairies (May 26-June 24, 2019). Figure 7. Cumulative precipitation observed for the growing season (April 1-June 24, 2019) across the Canadian prairies. Figure 8. Modeled soil moisture (%) across the Canadian prairies as of June 24, 2019.
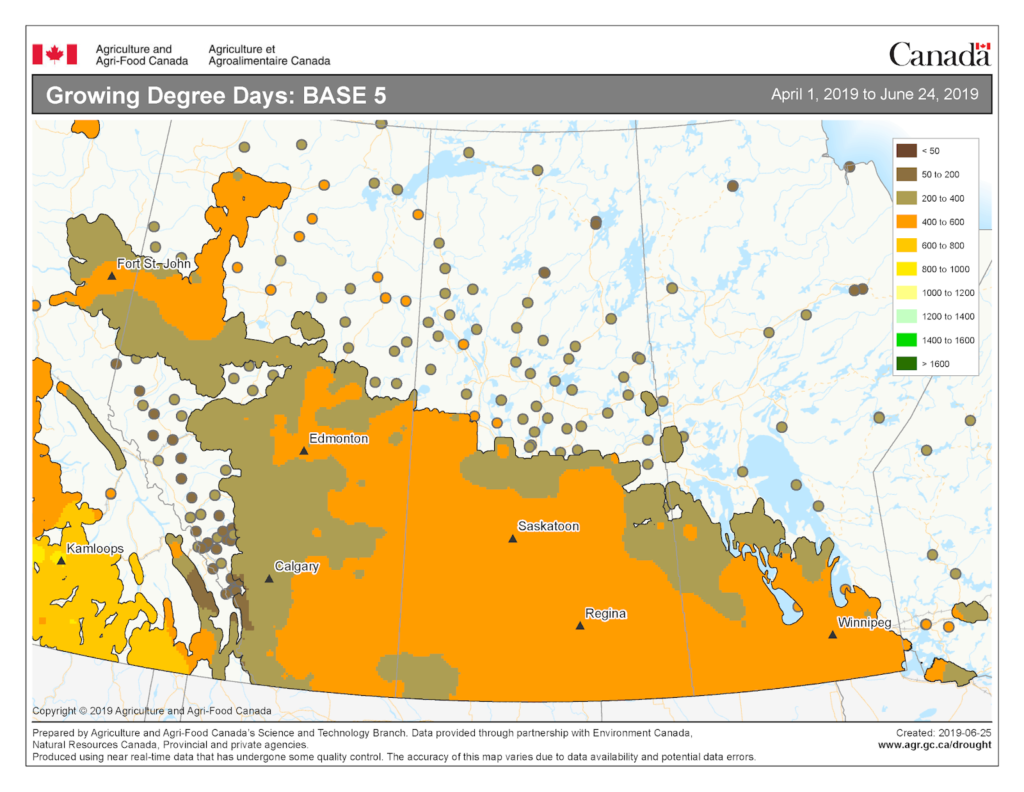
The growing degree day map (GDD) (Base 5 ºC, April 1-June 24, 2019) is below (Fig. 9):
Figure 9. Growing degree day (Base 5 ºC) across the Canadian prairies for the growing season (April 1-June 24 2019). Image has not been reproduced in affiliation with, or with the endorsement of the Government of Canada and was retrieved (25Jun2019). Access the full map at http://www.agr.gc.ca/DW-GS/current-actuelles.jspx?lang=eng&jsEnabled=true
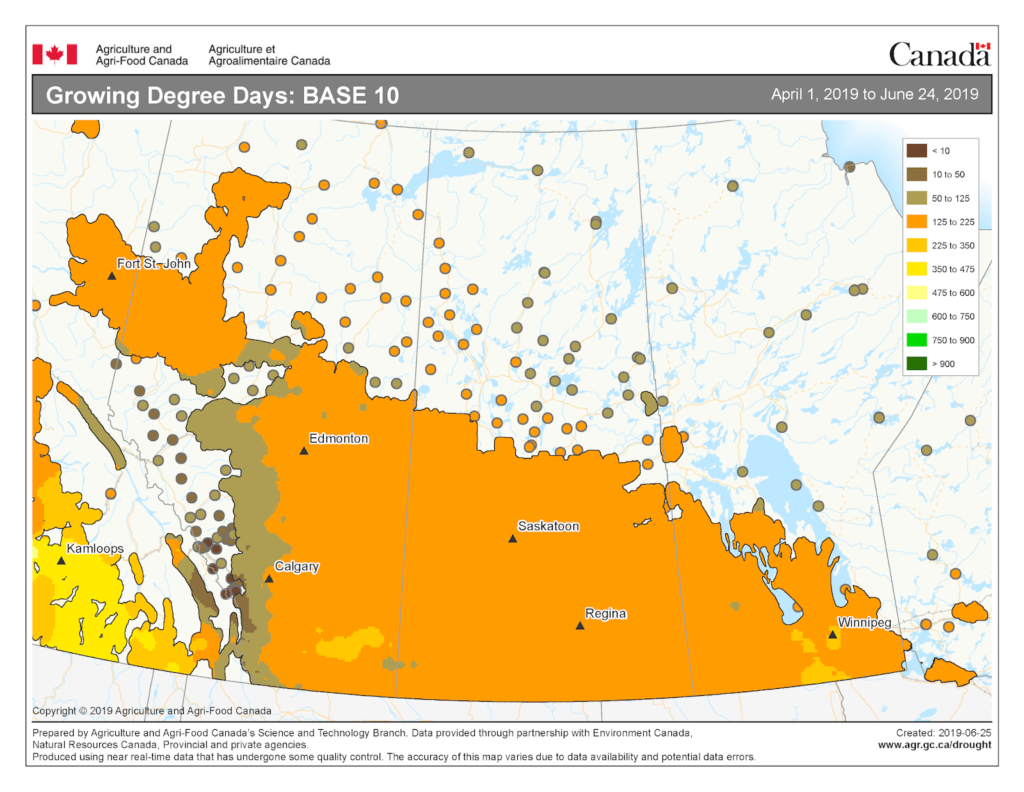
The growing degree day map (GDD) (Base 10 ºC, April 1-June 24, 2019) is below (Fig. 10):
Figure 10. Growing degree day (Base 10 ºC) across the Canadian prairies for the growing season (April 1-June 24, 2019).Image has not been reproduced in affiliation with, or with the endorsement of the Government of Canada and was retrieved (25Jun2019). Access the full map at http://www.agr.gc.ca/DW-GS/current-actuelles.jspx?lang=eng&jsEnabled=true
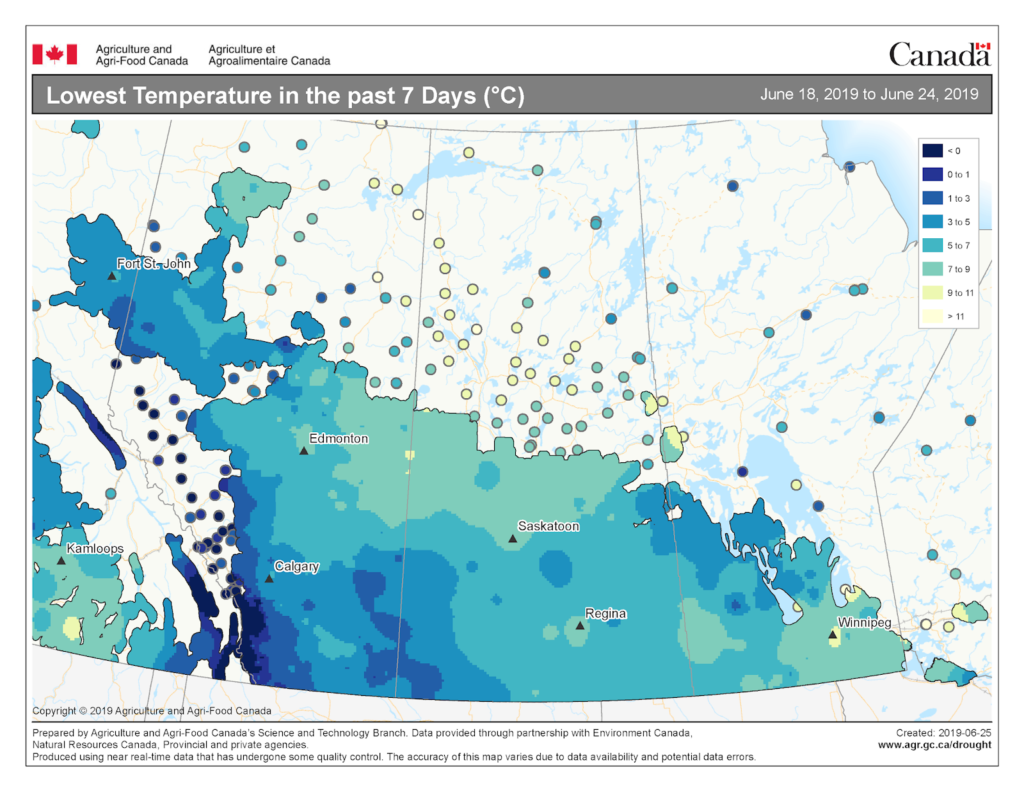
The lowest temperatures (°C) observed the past seven days ranged from about 11 to 0 °C in the map below (Fig. 11).
Figure 11. Lowest temperatures (°C) observed across the Canadian prairies the past seven days (to June 24, 2019). Image has not been reproduced in affiliation with, or with the endorsement of the Government of Canada and was retrieved (25Jun2019). Access the full map at http://www.agr.gc.ca/DW-GS/current-actuelles.jspx?lang=eng&jsEnabled=true
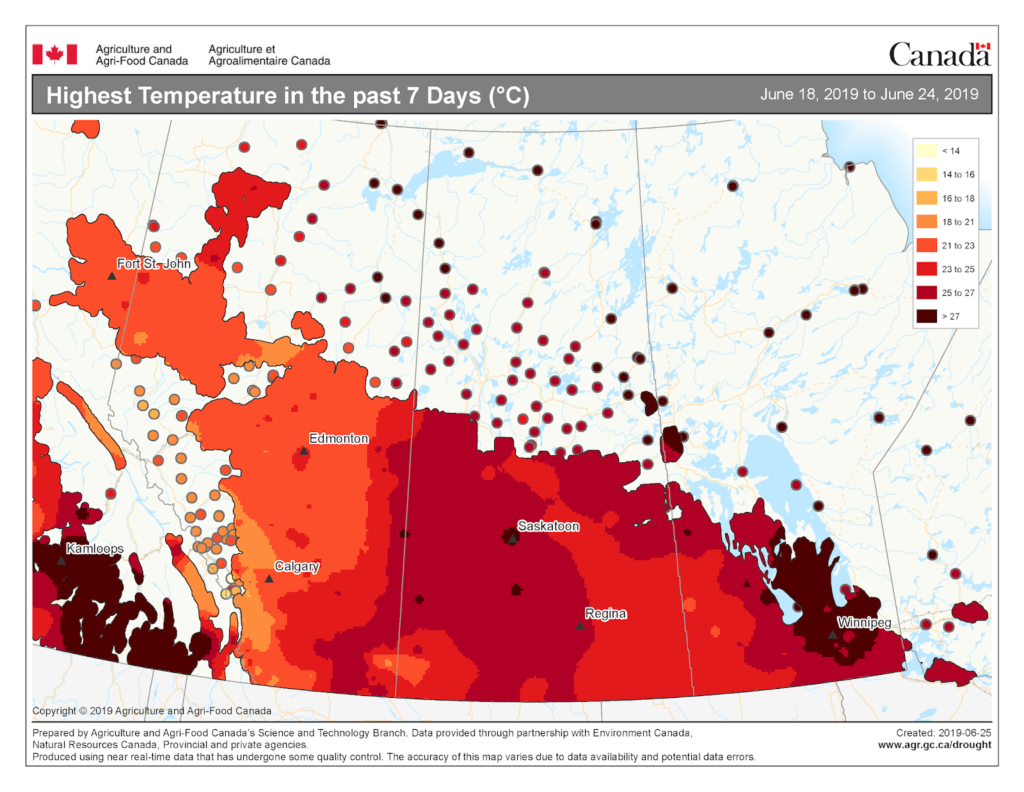
The highest temperatures (°C) observed the past seven days ranged from about 16 to at least 27 °C in the map below (Fig. 12).
Figure 12. Highest temperatures (°C) observed across the Canadian prairies the past seven days (to June 24, 2019). Image has not been reproduced in affiliation with, or with the endorsement of the Government of Canada and was retrieved (24Jun2019). Access the full map at http://www.agr.gc.ca/DW-GS/current-actuelles.jspx?lang=eng&jsEnabled=true
The maps above are all produced by Agriculture and Agri-Food Canada. Growers can bookmark the AAFC Drought Watch Maps for the growing season.


