Week 14 and it’s been another hot week for most of the prairies! This week review the weather synopsis and the historic above-average values for temperature. Once again, notice both the number of days various areas of the prairies have experienced >25 °C or >30 °C but ALSO the number of consecutive daysof >25 °C or >30 °C!
Be sure to catch the Insect of the Week – it’s the migratory grasshopper!
Stay safe and good scouting to you!
Questions or problems accessing the contents of this Weekly Update? Please contact us so we can connect you to our information. Past “Weekly Updates” can be accessed on our Weekly Update page.
Ross Weiss, Tamara Rounce, David Giffen, Owen Olfert, Jennifer Otani and Meghan Vankosky
Categories
Week 14
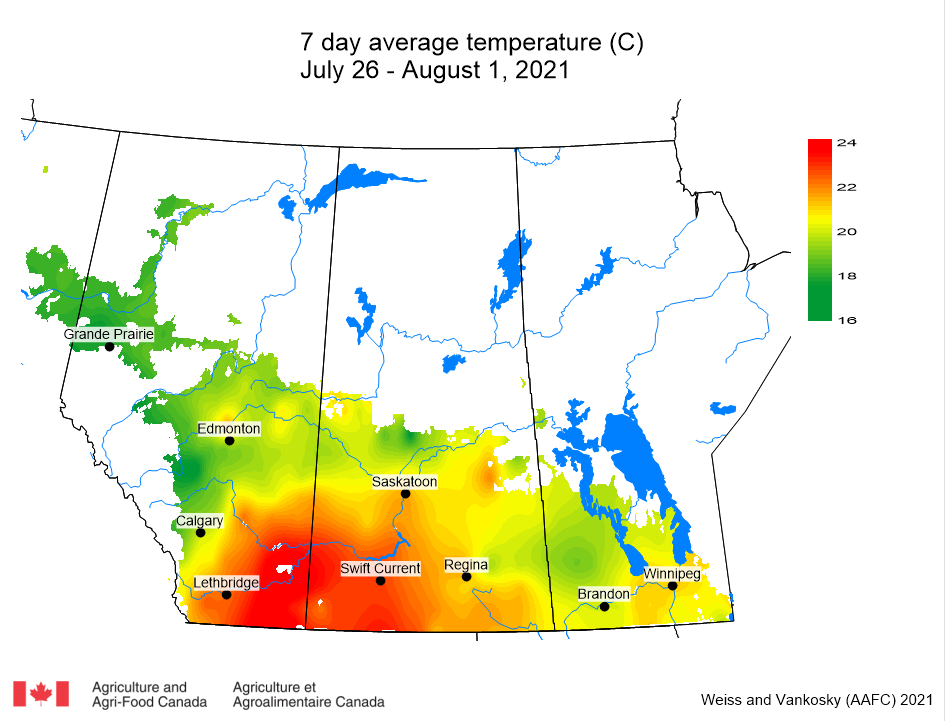
TEMPERATURE: This past week (July 26 – August 1, 2021) the prairies continued to experience above-average temperatures and extremely dry conditions. The warmest temperatures were observed across the southern and central regions of Alberta and Saskatchewan (Fig. 1).
Figure 1. 7-day average temperature (°C) observed across the Canadian prairies for the period of July 26 – August 1, 2021.
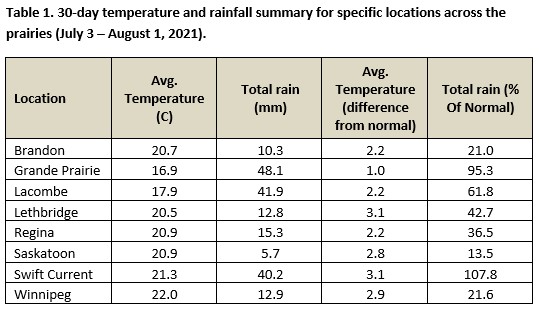
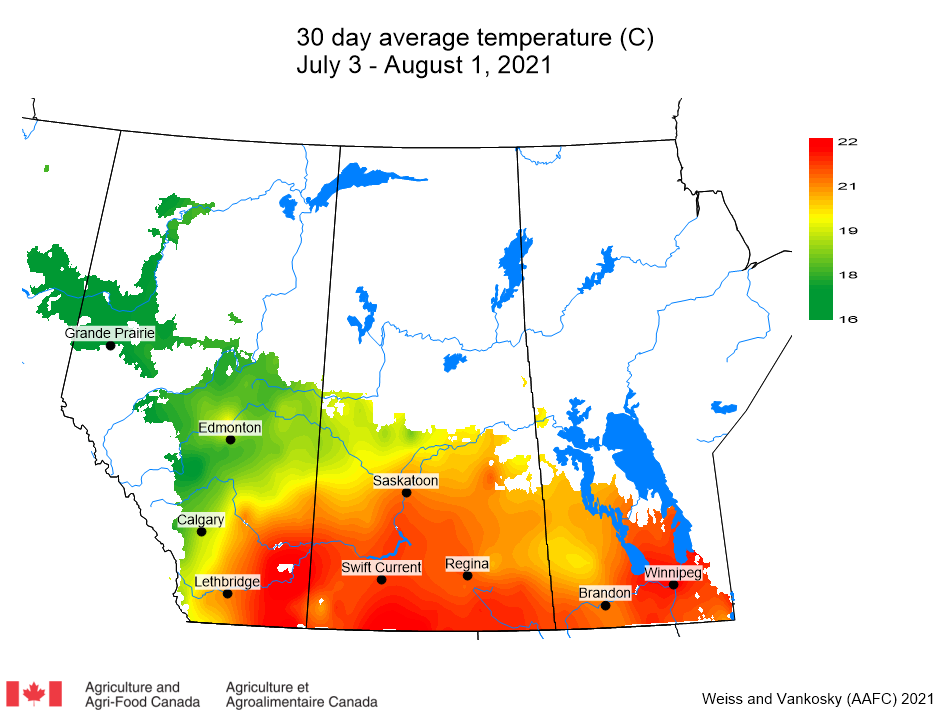
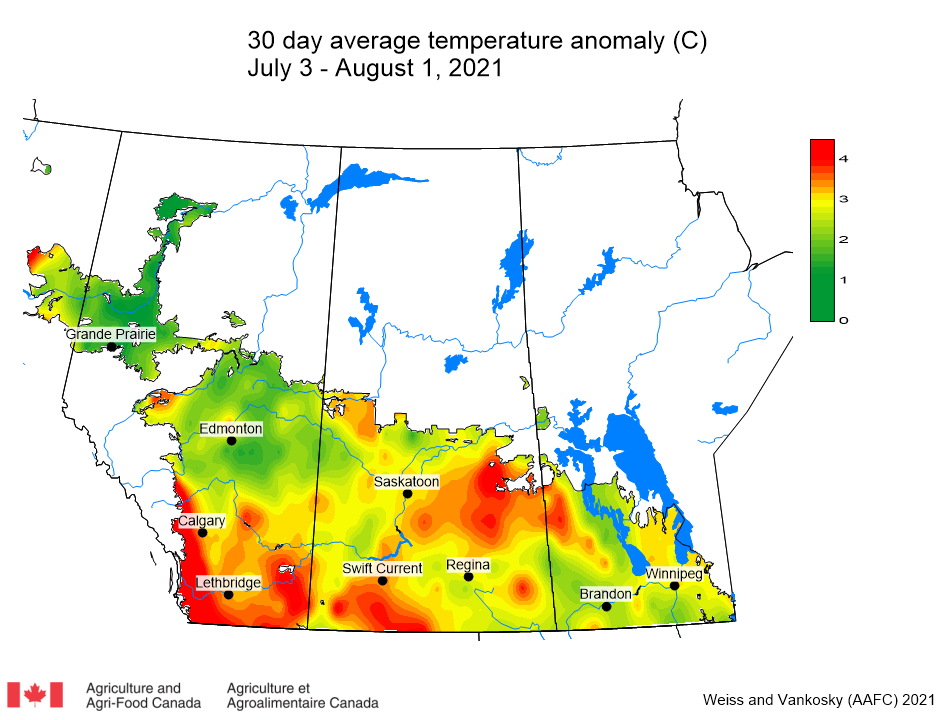
Across the prairies, the average 30-day (July 3 – August 1, 2021) temperature was 2.5 °C warmer than climate-normal values. The warmest temperatures were observed across the southern prairies (Table 1; Fig. 2). Temperature anomalies for July indicated that the entire Canadian prairies were warmer than normal (Fig. 3). The Peace River region, Edmonton area, and southern Manitoba experienced average temperatures most similar to climate-normal values. July average temperatures for southern Alberta and Saskatchewan (southwest and northeast) were 3-4 °C warmer than normal. Lethbridge and Swift Current average temperatures were 3.1 °C warmer than climate-normals.
Figure 2. 30-day average temperature (°C) observed across the Canadian prairies for the period of July 3 – August 1, 2021.Figure 3. Temperature anomalies (difference from climate-normal values) for average temperature (°C) observed across the Canadian prairies for the period of July 3 – August 1, 2021.
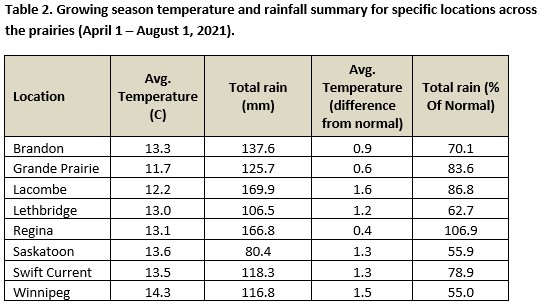
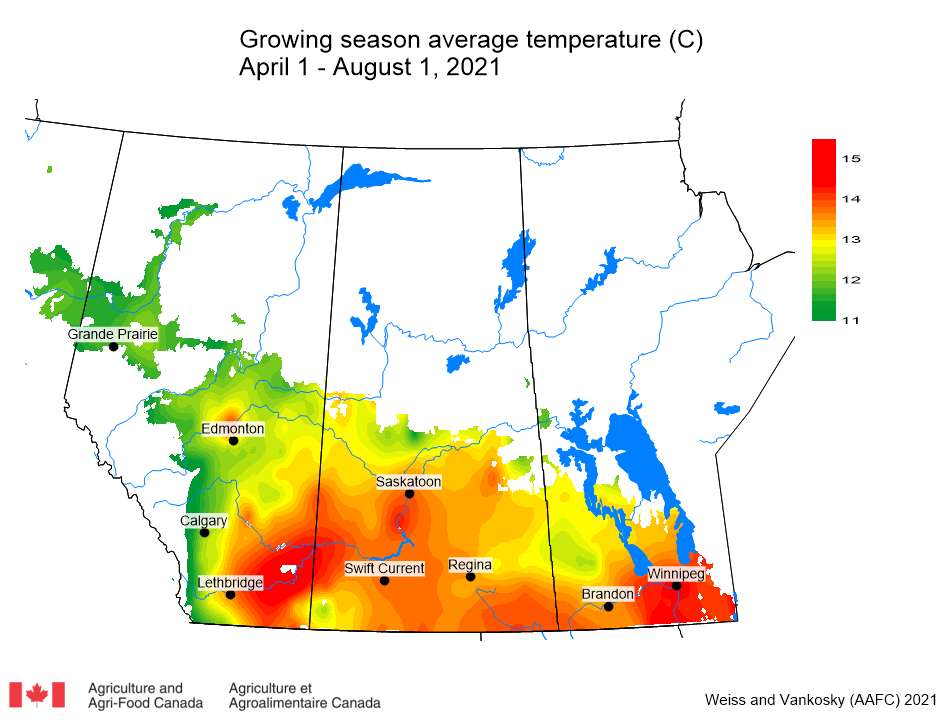
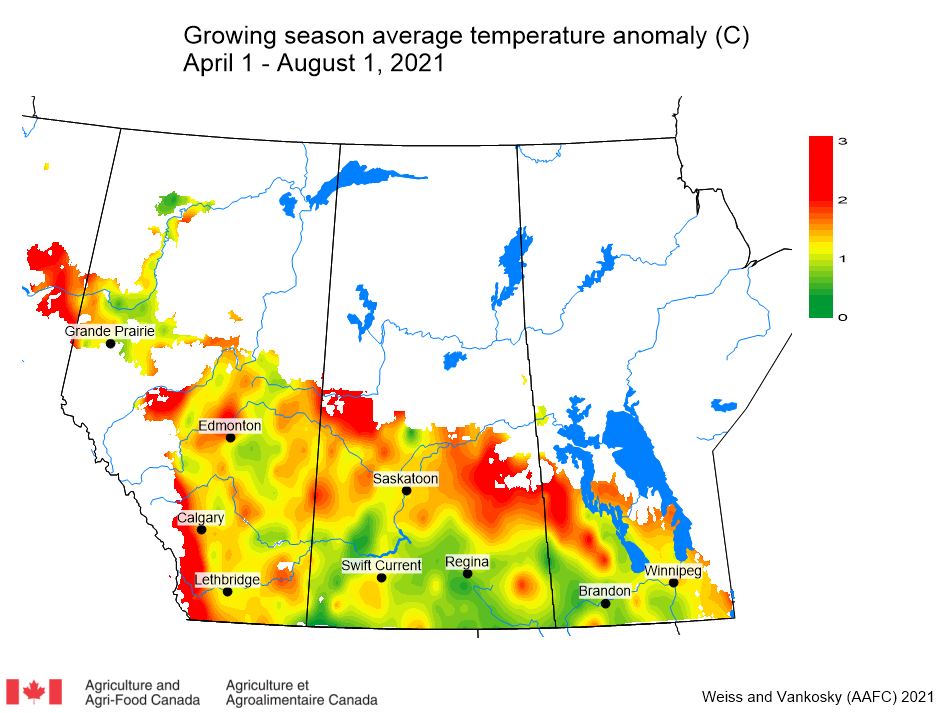
The 2021 growing season (April 1 – August 1, 2021) has been 1.5 °C warmer than average (Table 2; Fig. 4). Growing season temperature anomalies indicate that Parkland and Peace River regions have been 2-3 °C warmer than climate-normals (Fig. 5).
Figure 4. Growing season average temperature (°C) observed across the Canadian prairies for the period of April 1 – August 1, 2021.Figure 5. Temperature anomalies (difference from climate-normal values) for average temperature (°C) observed across the Canadian prairies for the period of April 1 – August 1, 2021.
Growing degree day (GDD) maps for Base 5 ºC and Base 10 ºC (April 1-July 26, 2021) can be viewed by clicking the hyperlinks. Over the past 7 days (July 26-August 1, 2021), the lowest temperatures recorded across the Canadian prairies ranged from < 0 to >13 °C while the highest temperatures observed ranged from <25 to >37 °C. With the incredible heat experienced so far, check the number of days of >25 °C or >30 °C across the Canadian prairies (April 1-August 1, 2021). At this point in the growing season, review the astonishing consecutive number of days of >25 °C or >30 °C across the Canadian prairies (April 1-August 1, 2021). Access these maps and more using the AAFC Drought Watch webpage interface.
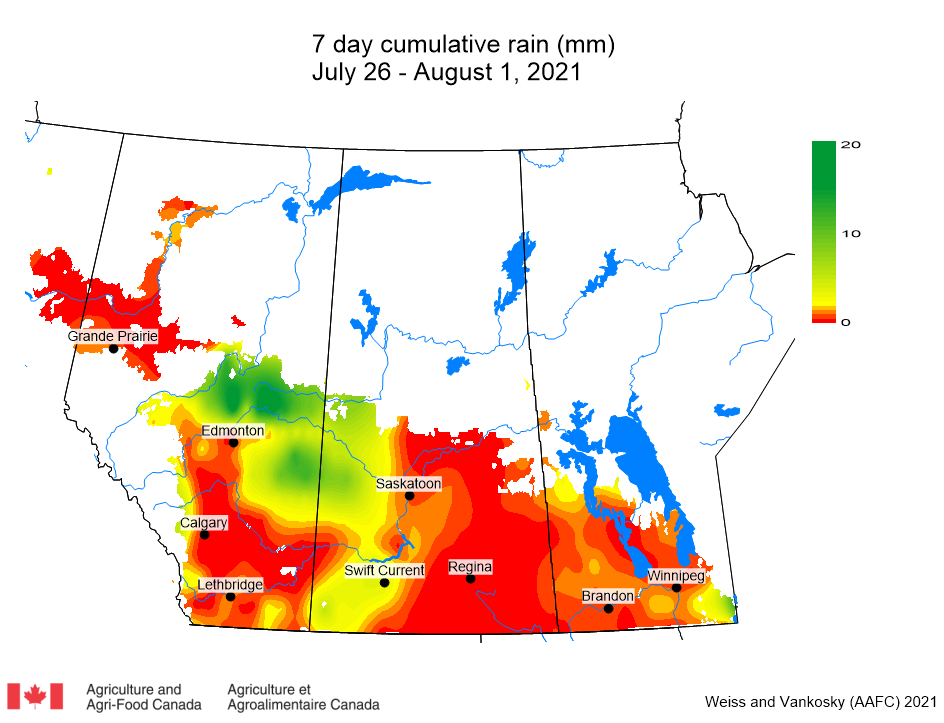
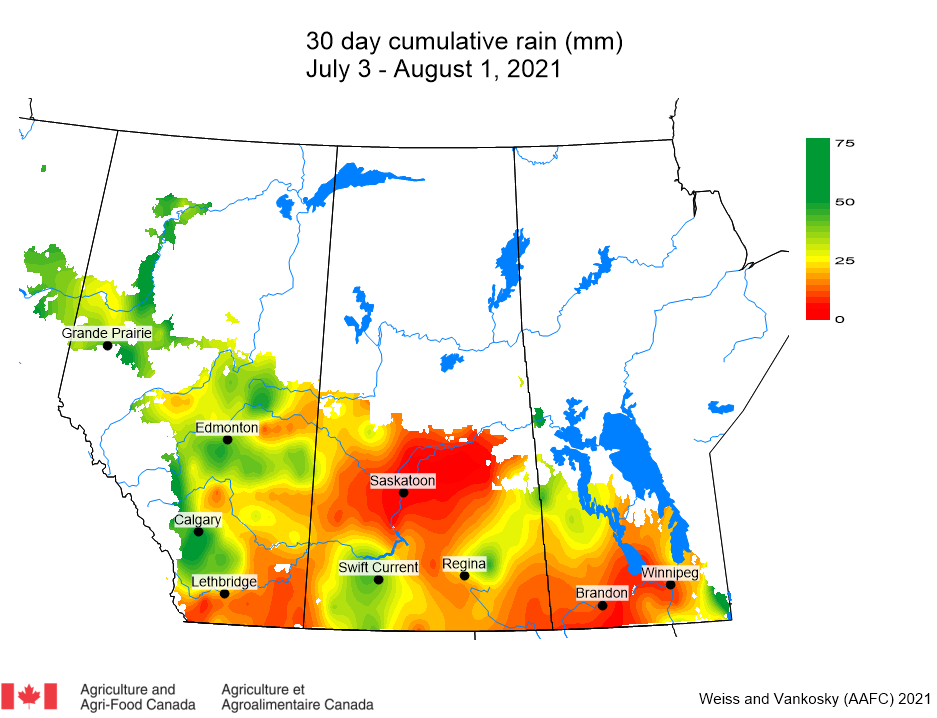
PRECIPITATION: Weekly (July 26 – August 1, 2021) rainfall amounts were generally less than 5 mm (Fig. 6). Rainfall amounts for the period of July 3 – August 1 (30-day accumulation) have been well below average with most of the prairies receiving less than 40 % of the average amount for this time period (Fig. 7). Accumulated rainfall varied significantly. Grande Prairie and Swift Current reported near-normal rainfall while Saskatoon (13.5 % of normal) and Winnipeg (21.6 % of normal) received minimal rainfall during July (Table 1).
Figure 6. 7-day cumulative rainfall (mm) observed across the Canadian prairies for the period of July 26 – August 1, 2021.Figure 7. 30-day cumulative rainfall (mm) observed across the Canadian prairies for the period of July 3 – August 1, 2021.
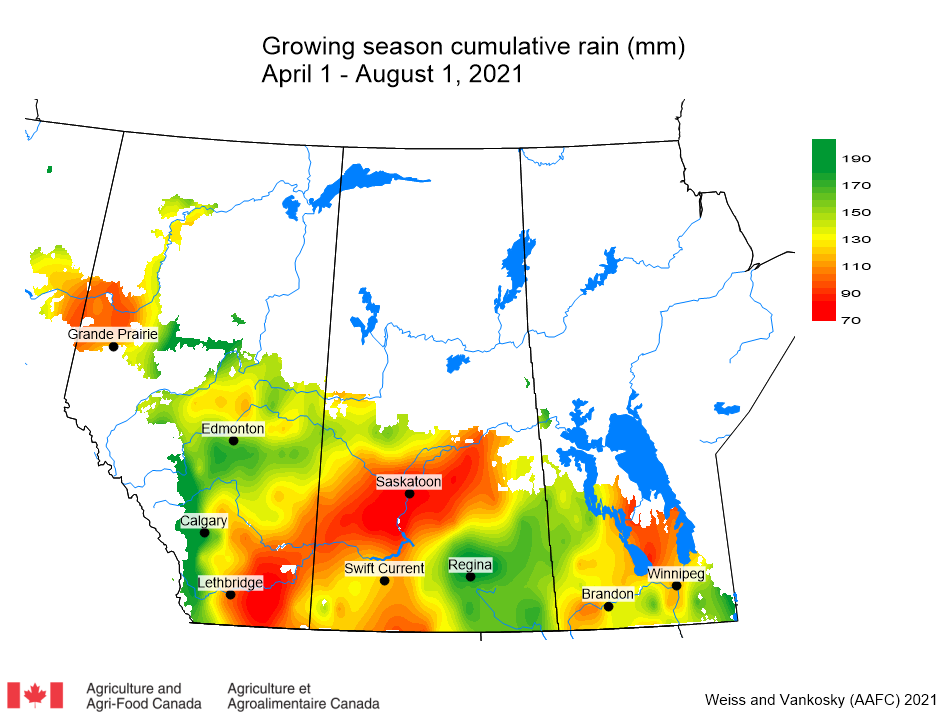
Growing season precipitation has been below average across most of the prairies. A region extending from Regina to the USA border is the only region that has reported near-normal rainfall for the period of April 1 – August 1, 2021, whereas a region extending from Lethbridge to northeastern Saskatchewan has received less than 100 mm of rain (Table 2; Fig. 8).
Figure 8. Growing season cumulative rainfall (mm) observed across the Canadian prairies for the period of April 1 – August 1, 2021.
Ross Weiss, Tamara Rounce, David Giffen, Jennifer Otani and Meghan Vankosky
Categories
Week 14
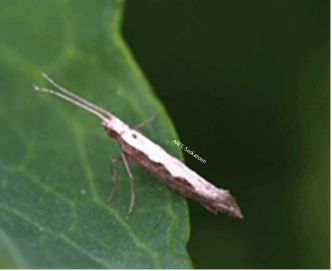
Diamondback moths (DBM; Plutella xylostella) are a migratory invasive species. Each spring adult populations migrate northward to the Canadian prairies on wind currents from infested regions in the southern or western U.S.A. Upon arrival to the prairies, migrant diamondback moths begin to reproduce and this results in subsequent non-migrant populations that may have three or four generations during the growing season.
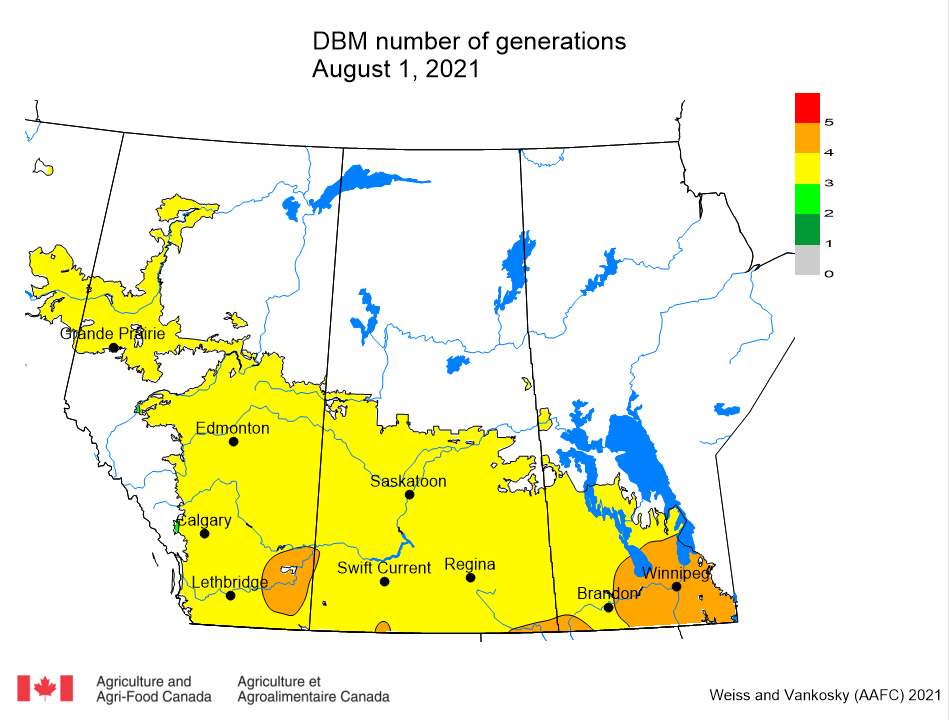
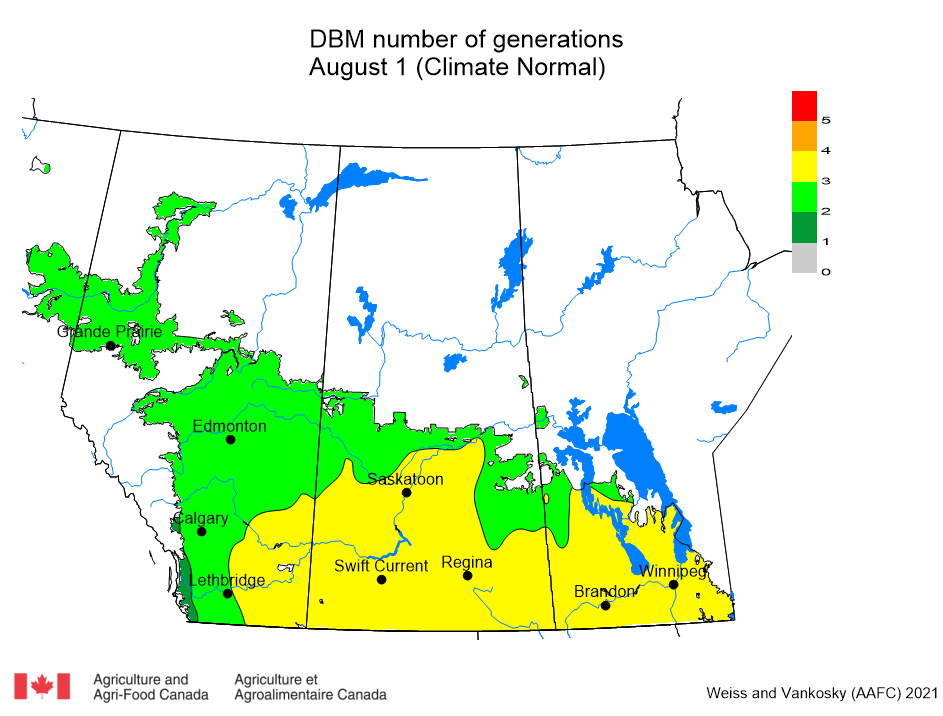
Model simulations to August 1, 2021, indicate that the third and fourth generation of non-migrant adults are currently emerging across the Canadian prairies (Fig. 1). Compared to long-term average data (climate normal) sufficient heat units have accumulated to produce a predicted an additional generation for the current growing season (Fig. 2).
Figure 1. Predicted number of non-migrant generations of diamondback moth (Plutella xylostella) expected to occur across the Canadian prairies as of August 1, 2021.Figure 2. Long-term average predicted number of non-migrant generations of diamondback moth (Plutella xylostella) expected to occur across the Canadian prairies as of August 1 (based on climate normals data).
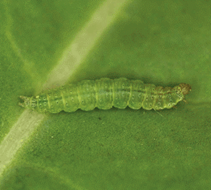
Monitoring:Remove plants in an area measuring 0.1 m² (about 12″ square), beat them onto a clean surface and count the number of larvae (Fig. 3) dislodged from the plant. Repeat this procedure at least in five locations in the field to get an accurate count.
Figure 3. Diamondback larva measuring ~8mm long. Note brown head capsule and forked appearance of prolegs on posterior.
The economic threshold for diamondback moth in canola at the advanced pod stage is 20 to 30 larvae/ 0.1 m² (approximately 2-3 larvae per plant). Economic thresholds for canola or mustard in the early flowering stage are not available. However, insecticide applications are likely required at larval densities of 10 to 15 larvae/ 0.1 m² (approximately 1-2 larvae per plant).
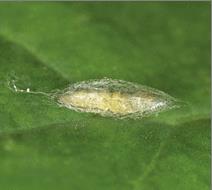
Figure 4. Diamondback moth pupa within silken cocoon.
Ross Weiss, Tamara Rounce, David Giffen, Owen Olfert, Jennifer Otani and Meghan Vankosky
Categories
Week 14
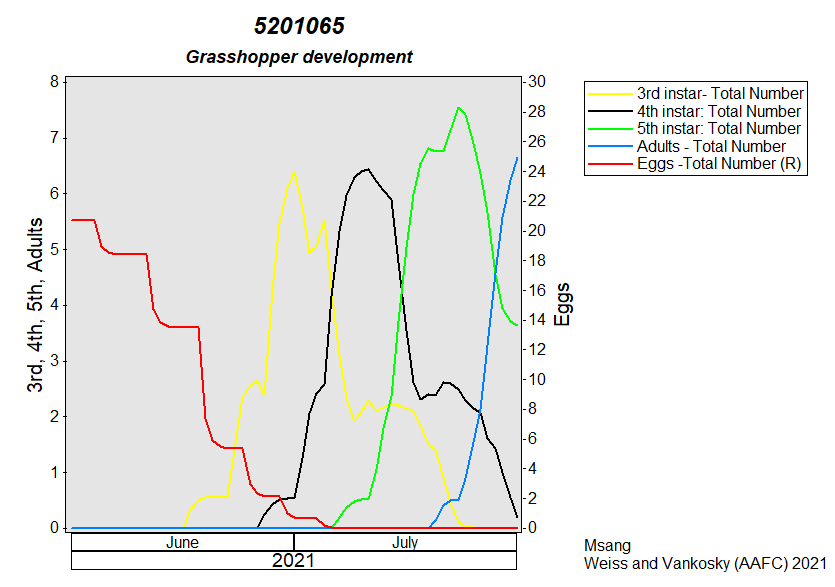
Model simulations were used to estimate grasshopper (Melanoplus sanguinipes) development as of August 1, 2021. Compared to average growing season temperatures, above-average temperatures during June and July continue to result in a noticeable increase in the rate of grasshopper development. Based on climate-normals, grasshopper populations near Saskatoon should have been in the fifth instar and adult stages on July 31 (Fig. 1).
Figure 1. Predicted development of Melanoplus sanguinipes populations near Saskatoon, Saskatchewan, as of August 1, 2021, based on climate normals data).
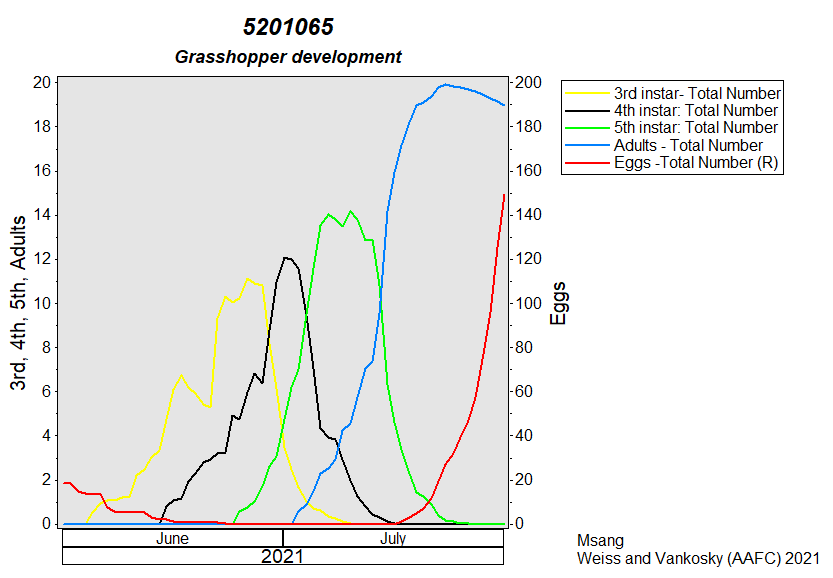
Oviposition generally begins in early August. This year, the average July temperature at Saskatoon was 2.8 °C warmer than normal, resulting in advanced development of grasshopper populations. Based on a survey conducted across central, southern, and western regions of Saskatchewan, adults were observed during the first week of July. Model simulations for 2021 predicted that oviposition was expected to begin in mid-July (Fig. 2).
Figure 2. Predicted development of Melanoplus sanguinipes populations near Saskatoon, Saskatchewan, as of August 1, 2021.
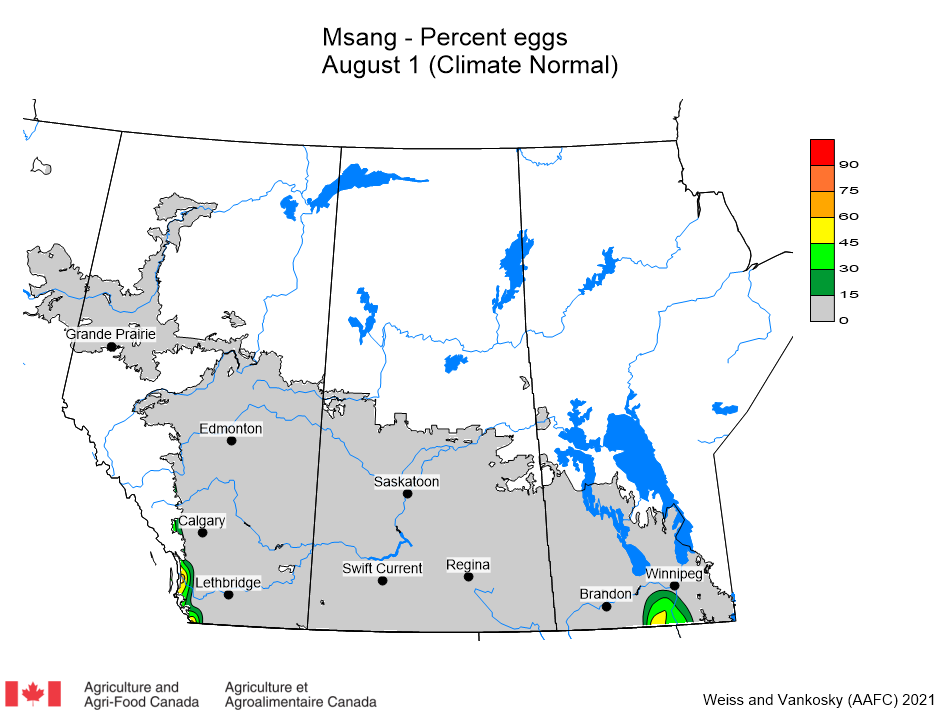
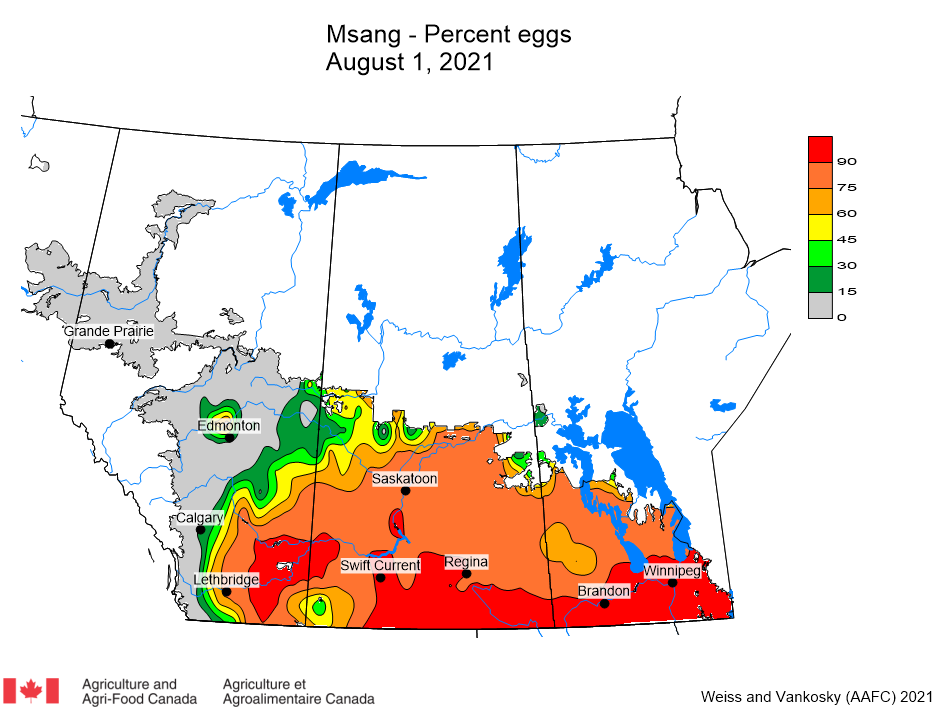
The onset of oviposition earlier in a growing season can result in above-average production of eggs leading to higher risk of grasshopper issues the following growing season (e.g., 2022). Climate data suggests that, as of August 1, oviposition would be expected to occur in localized areas across the prairies (Fig. 3). Model runs for the 2021 growing season (April 1 – August 1) predicted, as a result of above-normal temperatures, that oviposition should now be occurring across most of the prairies (Fig. 4)
Figure 3. Percent of grasshopper (Melanoplus sanguinipes) population in the egg stage across the Canadian prairies as of August 1, 2021 (based on climate normals data).Figure 4. Percent of grasshopper (Melanoplus sanguinipes) population in the egg stage across the Canadian prairies as of August 1, 2021.
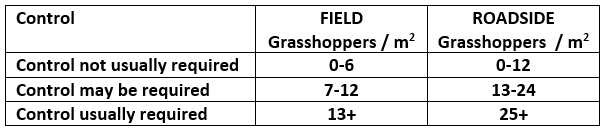
Grasshopper Scouting Steps: ● Review grasshopper diversity and scouting information including photos of nymphs, adults, and non-grasshopper species to aid in-field scouting and accurately apply thresholds for grasshoppers. ● Measure off a distance of 50 m on the level road surface and mark both starting and finishing points using markers or specific posts on the field margin. ● Start at one end in either the field or the roadside and walk toward the other end of the 50 m, making some disturbance with your feet to encourage any grasshoppers to jump. ● Grasshoppers that jump/fly through the field of view within a one-meter width in front of the observer are counted. ● A meter stick can be carried as a visual tool to give perspective for a one-meter width. However, after a few stops, one can often visualize the necessary width and a meter stick may not be required. Also, a hand-held counter can be useful in counting while the observer counts off the required distance. ● At the endpoint, the total number of grasshoppers is divided by 50 to give an average per meter. For 100 m, repeat this procedure. ● Compare counts to the following damage levels associated with pest species of grasshoppers: 0-2 per m² – None to very light damage 2-4 per m² – Very light damage 4-8 per m² – Light damage 8-12 per m² – Action threshold in cereals and canola 12-24 per m² – Severe damage 24 per m² – Very severe damage For lentils at flowering and pod stages, >2 per m² will cause yield loss. For flax at boll stages, >2 per m² will cause yield loss. ● More practically, the following thresholds are offered but, in the event of additional crop stress (e.g., drought), the use of “may be required” versus “control usually required” requires careful consideration:
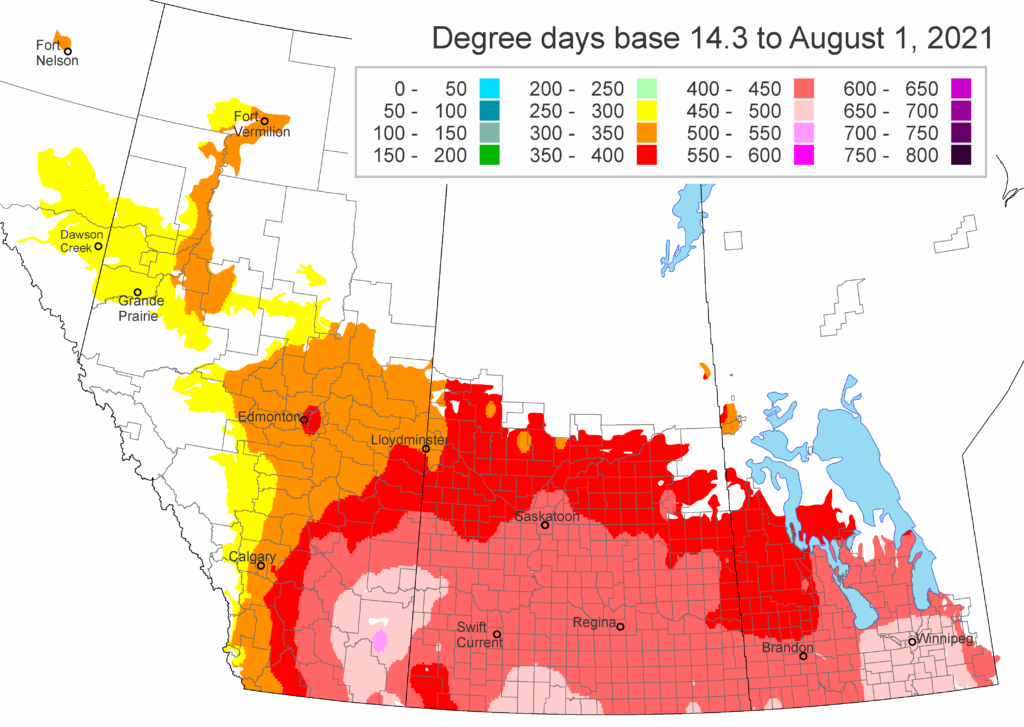
The following is offered to help predict when Culex tarsalis, the vector for West Nile Virus, will begin to fly across the Canadian prairies. This week, regions most advanced in degree-day accumulations for Culex tarsalis are shown in Figure 1 but the unusual heat across the prairies greatly accelerated mosquito development!
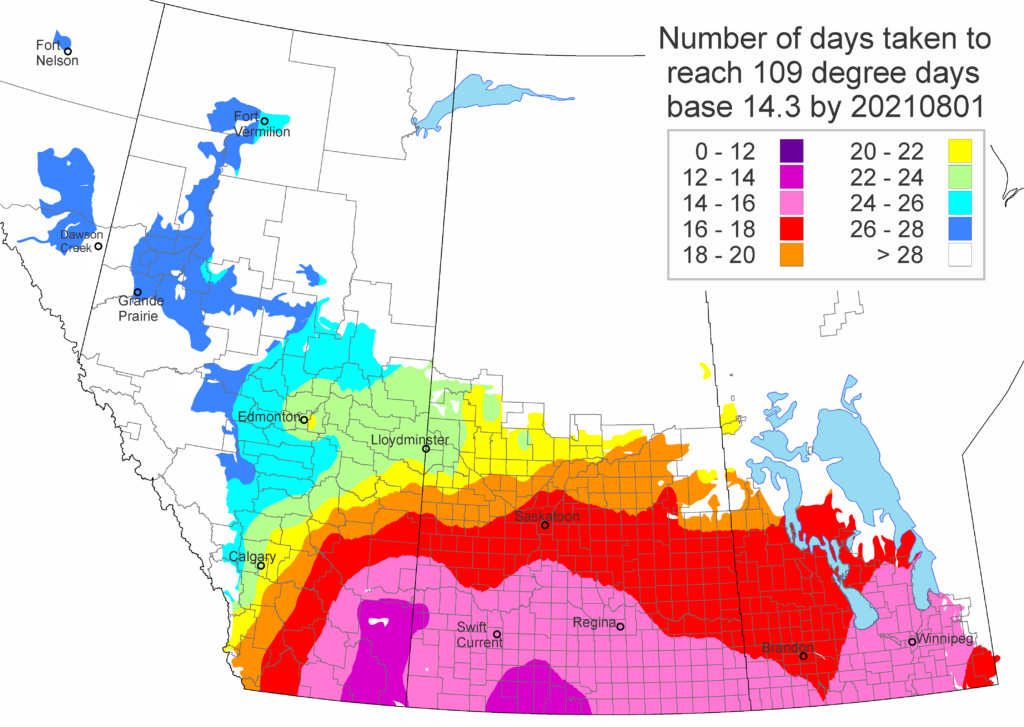
As of August 1, 2021 (Fig. 1), C. tarsalis development has now reached the point that adults are predicted to be flying across the south of the prairies from Manitoba to Alberta. Outdoor enthusiasts falling within areas highlighted red (i.e., areas that have accumulated sufficient heat accumulation for C. tarsalis to emerge) should wear DEET to protect against WNV! Because of the continued high temperatures, areas highlighted yellow or orange in the map below (as of August 1) should also start to use DEET this week! IF C. tarsalis is present in an area where WNV is active, it may take as little as 14 days for adults to become fully infective with the current warm weather (Fig. 2).
Figure 1. Predicted development of Culex tarsalis across the Canadian prairies (as of August 1, 2021).Figure 2. Predicted days for virulence of West Nile Virus to develop within Culex tarsalis, if present within a region (as of August 1, 2021).
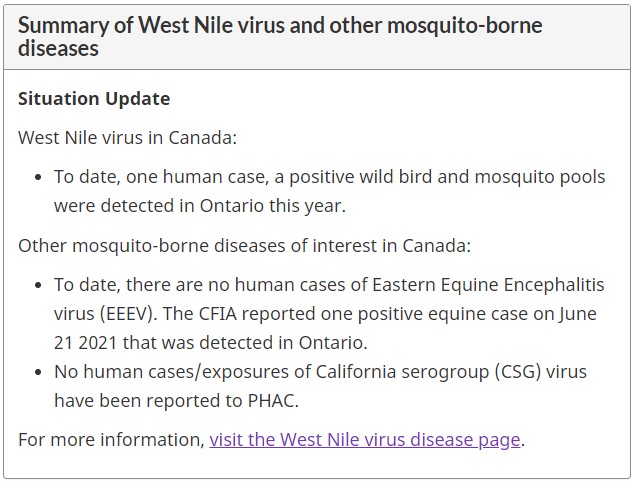
The Public Health Agency of Canada posts information related to West Nile Virus in Canada and also tracks West Nile Virus through human, mosquito, bird and horse surveillance. Link here to access their most current weekly update (reporting date June 21, 2021; retrieved August 4, 2021). The screenshot below (retrieved 04Aug2021) serves as a reference and reports one human case of WNV, a positive wild bird, and positive mosquito pools in Ontario.
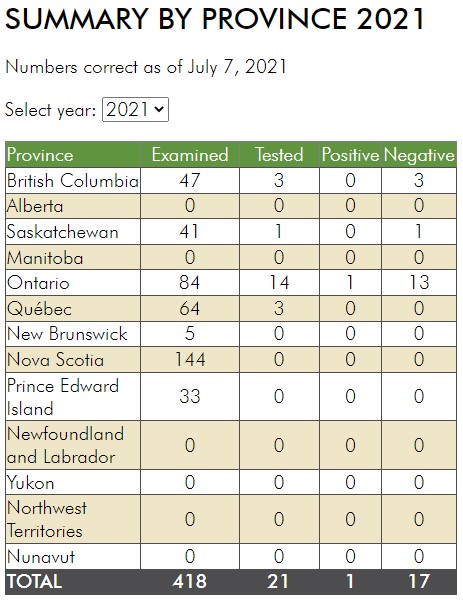
Bird surveillance continues to be an important way to detect and monitor West Nile Virus. The Canadian Wildlife Health Cooperative (CWHC) works with governmental agencies (i.e., provincial laboratories and the National Microbiology Laboratory) and other organizations to report the occurrence of WNV. Dead birds retrieved from areas of higher risk of West Nile Virus are tested for the virus. A screenshot of the latest reporting results posted by Canadian Wildlife Health Cooperative is below (retrieved 04Aug2021).
Anyone keen to identify mosquitoes will enjoy this pictorial key for both larvae and adults which is posted on the Centre for Disease Control (CDC) website but sadly lacks a formal citation other than “MOSQUITOES: CHARACTERISTICS OF ANOPHELINES AND CULICINES prepared by Kent S. Littig and Chester J. Stojanovich” and includes Pages 134-150. The proper citation may be Stojanovich, Chester J. & Louisiana Mosquito Control Association. (1982). Mosquito control training manual. pp 152.
Before the harvest rush begins, start to consider pre-harvest intervals. The PHI refers to the minimum number of days between a pesticide application and swathing or straight combining of a crop. The PHI recommends sufficient time for a pesticide to break down. PHI values are both crop- and pesticide-specific. Adhering to the PHI is important for a number of health-related reasons but also because Canada’s export customers strictly regulate and test for the presence of trace residues of pesticides.
Here are a few resources to help: • Information about PHI and Maximum Residue Limits (MRL) is available on the Keeping It Clean website. • The Pest Management Regulatory Agency has a fact sheet, “Understanding Preharvest Intervals for Pesticides” or download a free PDF copy. • Use Keeping It Clean’s “Spray to Swath Interval Calculator” to accurately estimate: ◦ PHI for canola, chickpeas, lentils, faba beans, dry beans, or peas. ◦ How long to wait, if the crop’s already been sprayed. ◦ To find a pesticide to suit your timeline. • Provincial crop protection guides include the PHI for every pesticide x crop combination; Alberta, Saskatchewan, or Manitoba guides are downloadable as free, searchable PDF format.
Provincial entomologists provide insect pest updates throughout the growing season so link to their information:
MANITOBA’SCrop Pest Updates for 2021 are now available – access the August 4, 2021 report here. Be sure to bookmark their Crop Pest Update Index to readily access these reports! Bookmark their insect pest homepage to access fact sheets and more! • Bertha armyworm pheromone trap monitoring update for MB – Cumulative counts arising from weekly data is available here. Cumulative counts are categorized as “low risk” so far (i.e., 0-300 moths). • Diamondback moth pheromone trap monitoring update for MB – Trapping has drawn to a close for 2021. Access the summary here. Only 65 traps intercepted moths and the highest cumulative count was 171 moths near Selkirk. Access the summary (as of June 30, 2021). At this point, in-field scouting for larvae remains important.
SASKATCHEWAN’SCrop Production News is available. Access Issue #4 online which includes a crop protection lab update, and describes thrips in cereals. Be sure to bookmark their insect pest homepage to access important information! • Bertha armyworm pheromone trap monitoring update for SK – Cumulative counts arising from weekly data is available here. • Diamondback moth pheromone trap monitoring update for SK – Monitoring has drawn to a close for 2021. Review the final DBM counts. Extremely low numbers have been intercepted. Province-wide, <65 moths have been intercepted (2021Jun28 Carter, pers. comm.). At this point, in-field scouting for larvae remains important.
ALBERTA’SInsect Pest Monitoring Network webpage links to insect survey maps, live feed maps, and insect trap set-up videos and more. There is also a Major Crops Insect webpage. The new webpage does not replace the Insect Pest Monitoring Network page. Remember, AAF’s Agri-News occasionally includes insect-related information or Twitter users can connect to #ABBugChat Wednesdays at 10:00 am. • Wheat midge pheromone trap monitoring update for AB – Cumulative counts arising from weekly data are available so refer to the Live Map. • Cabbage seedpod weevil sweep-net monitoring update for AB – In-field counts can be entered here to populate the Live Map. Some sites in southern Alberta are reporting densities at or above the economic threshold in canola (22Jul2021). • Bertha armyworm pheromone trap monitoring update for AB – Cumulative counts arising from weekly data have begun so refer to the Live Map. Cumulative counts throughout the province report “low risk” numbers of moths so far (22Jul2021). • Diamondback moth pheromone trap monitoring update for AB – Trapping has drawn to a close for 2021. Refer to the Live Map which reports extremely low numbers of moths intercepted so far (<50 province-wide as of 01Jul2021). At this point, in-field scouting for larvae remains important. • Cutworm reporting tool – Refer to the Live Map which now reports seven sites with cutworms (as of 01Jul2021).
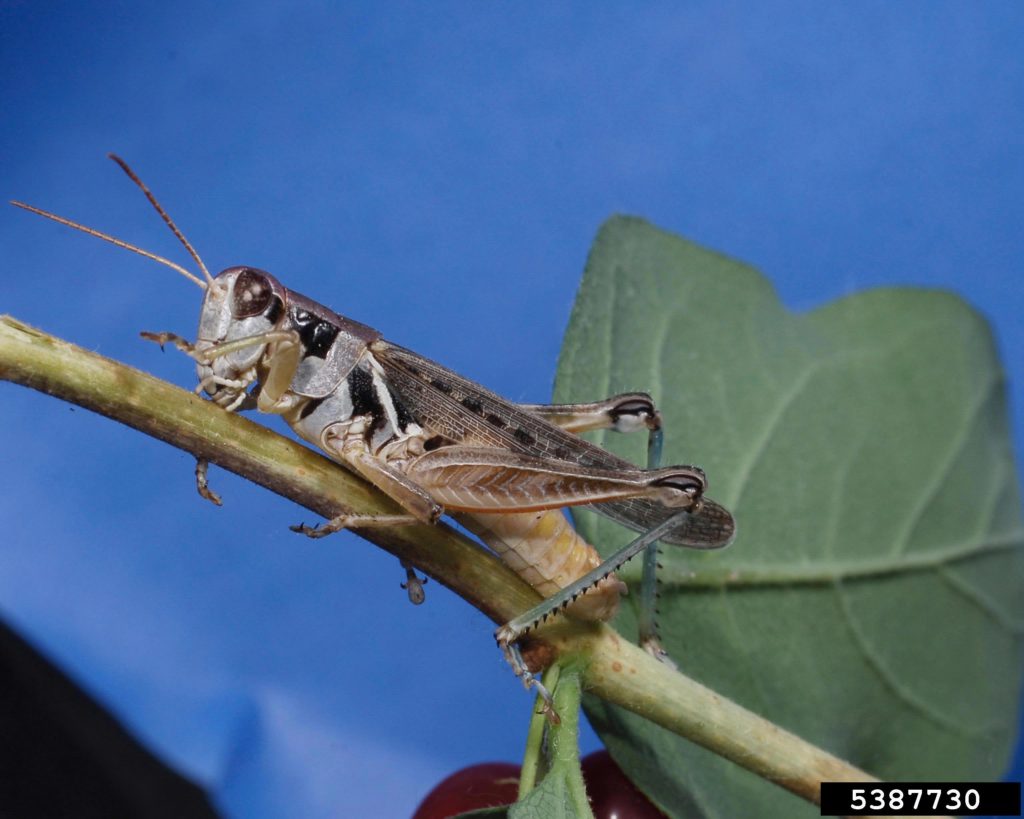
Adapted to all ecoregions in the Canadian grasslands, the migratory grasshopper is a versatile insect demonstrating variable colouration and a range of adult sizes. While a common pest in the Prairie region, the migratory grasshopper has a range that extends southward into Florida. These insects will consume almost all crops, including (but not limited to) forage legumes and grasses, pulses, oilseeds, cereals, and vegetables. Despite their name, migratory grasshoppers overwinter in the Prairie region.
As a mixed feeder, the migratory grasshopper thrives in many agricultural environments, including grain fields, cultivated pastures and rangeland. Feeding damage includes leaf notching and stripping. More extensive damage is caused when stems are severed below the heads of mature and maturing crops. The migratory grasshopper will also feed on dried plant material when accessible. The migratory grasshopper is one of a few species of grasshopper that can cause economic yield loss to prairie crops.
Migratory grasshopper adults grow up to 23-28 mm long, with bodies that range from brown to gray. A small black stripe runs across the head, while the hind legs are marked with a series of black bands. Nymphs are a mottled gray and like the adults, have a black stripe running across the head.
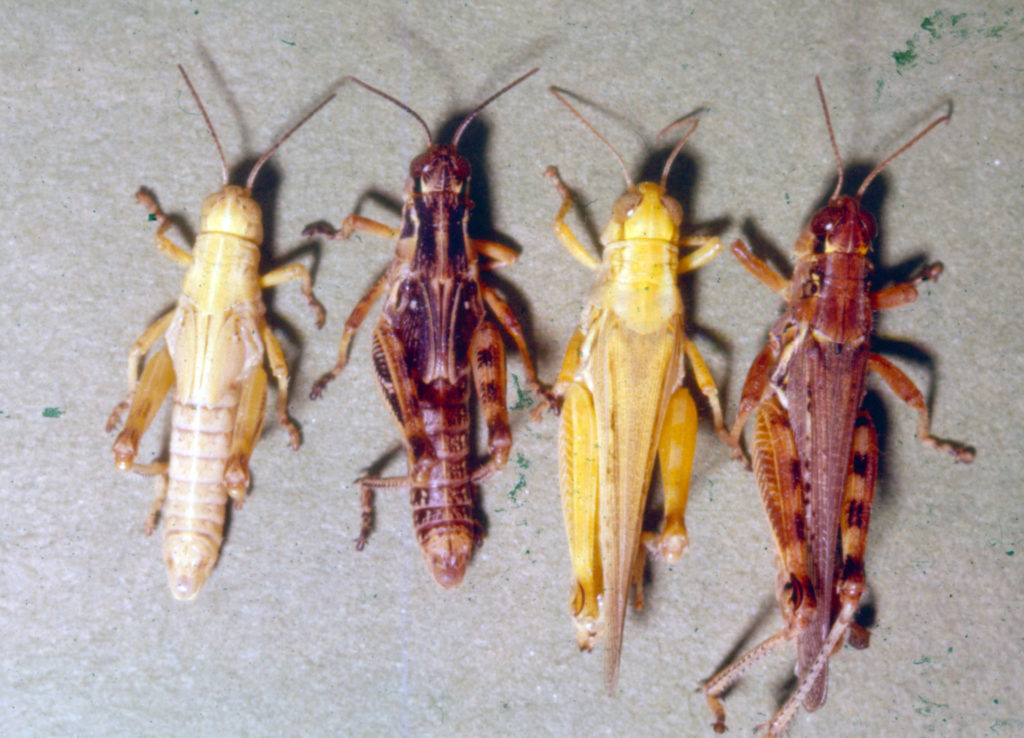
Migratory grasshopper nymphs and adults, albino and normal (AAFC)