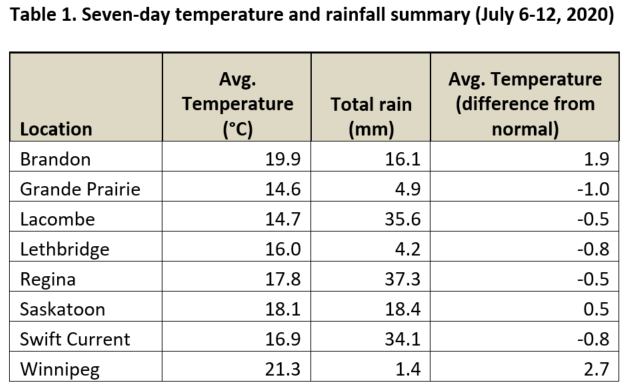
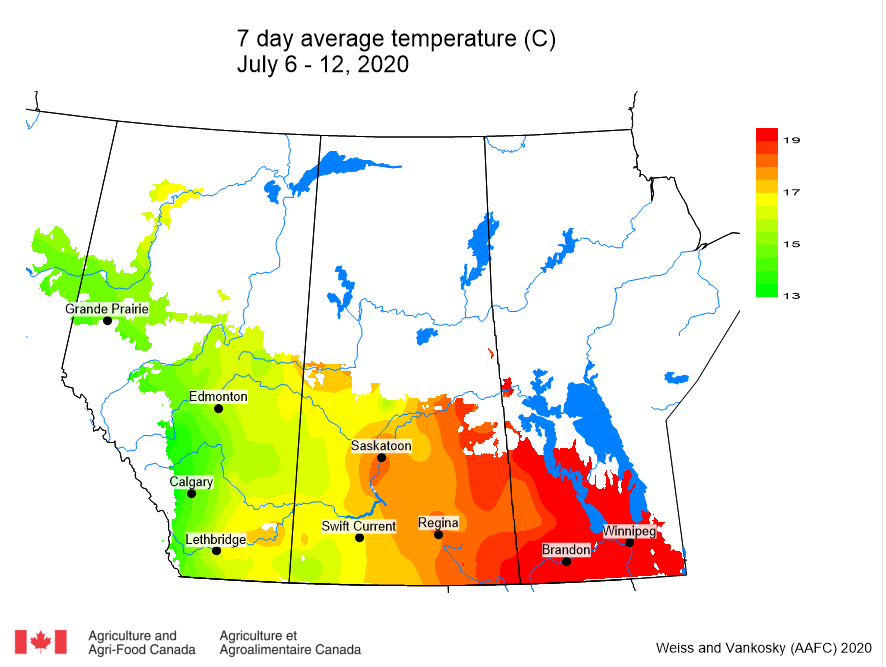
The 2020 growing season, April 1 – July 12, 2020, has been cooler and wetter than normal across many locations in Alberta and Saskatchewan. Conditions in Manitoba have been warmer and dryer than normal. This past week (July 6-12, 2020) prairie temperatures were warmest in Manitoba and eastern Saskatchewan (Table 1; Fig. 1). Average 7-day temperatures continue to be warmest across Manitoba and eastern Saskatchewan and coolest across most of Alberta (Table 1; Fig. 1).
Average 30-day (June 13-July 12, 2020) temperatures continue to be cooler in Alberta than in southern Saskatchewan and Manitoba (Table 2; Fig. 2). The average 30-day temperature at Winnipeg and Brandon continued to be greater than locations in Alberta and Saskatchewan (Fig. 2). Temperature anomalies indicate that temperatures have been below normal across most of Alberta and Saskatchewan and were 0 to 2 °C warmer than average across eastern Saskatchewan and southern Manitoba (Table 2; Fig. 3). Based on growing season temperatures (April 1 – July 12, 2020), conditions have been warmest for southern locations (Table 3).
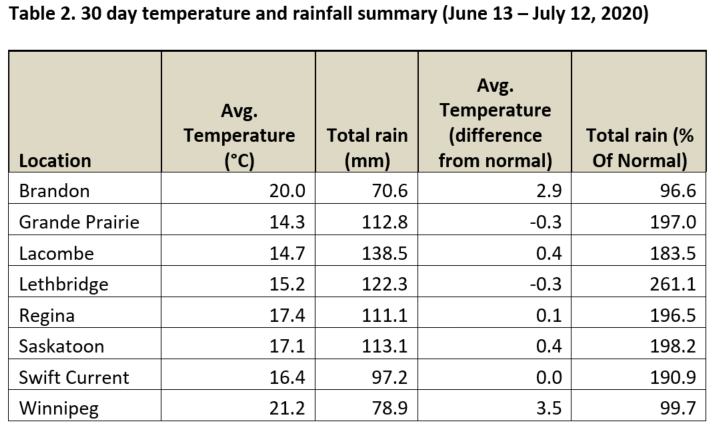
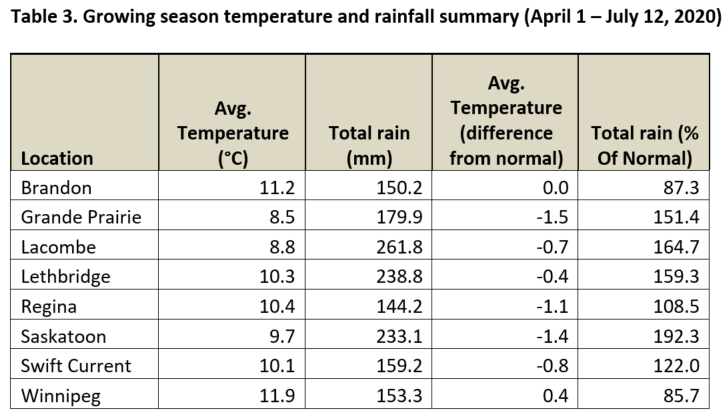
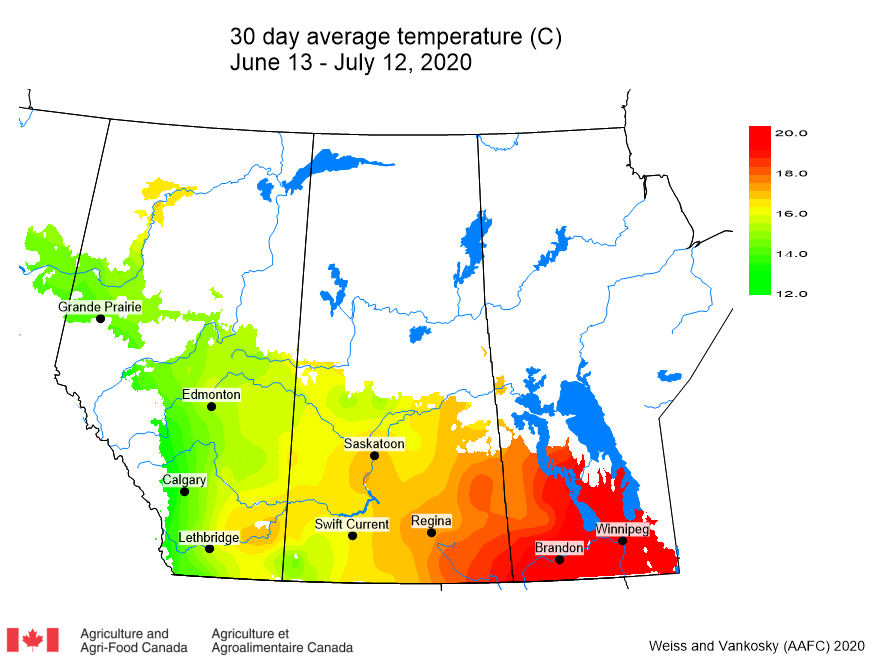
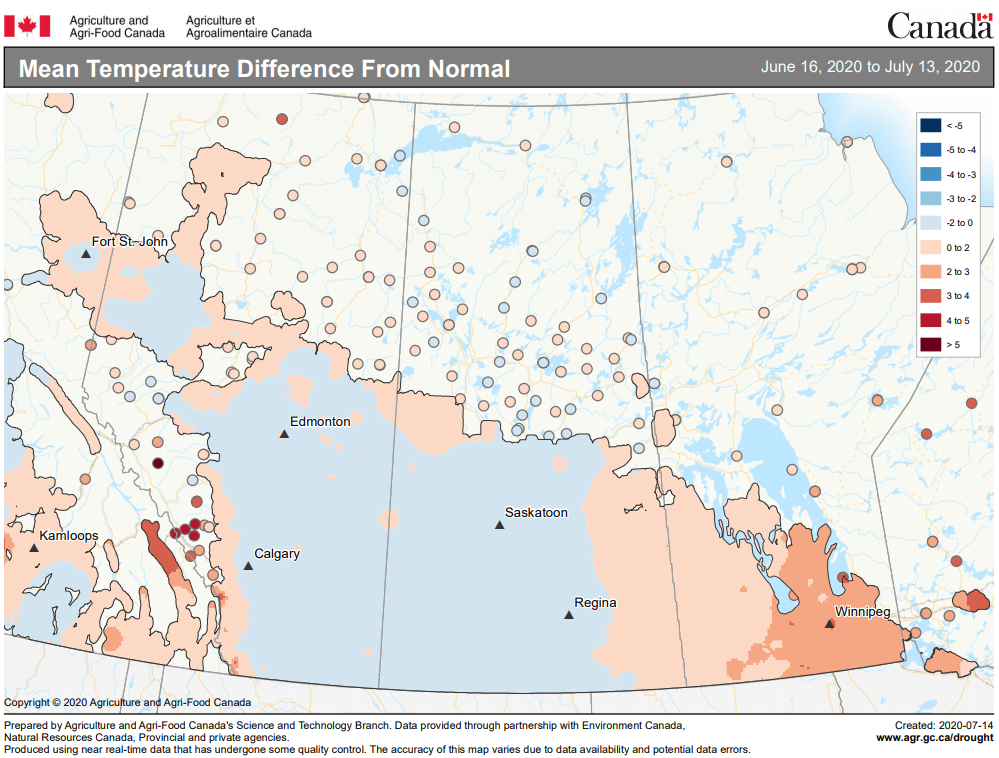
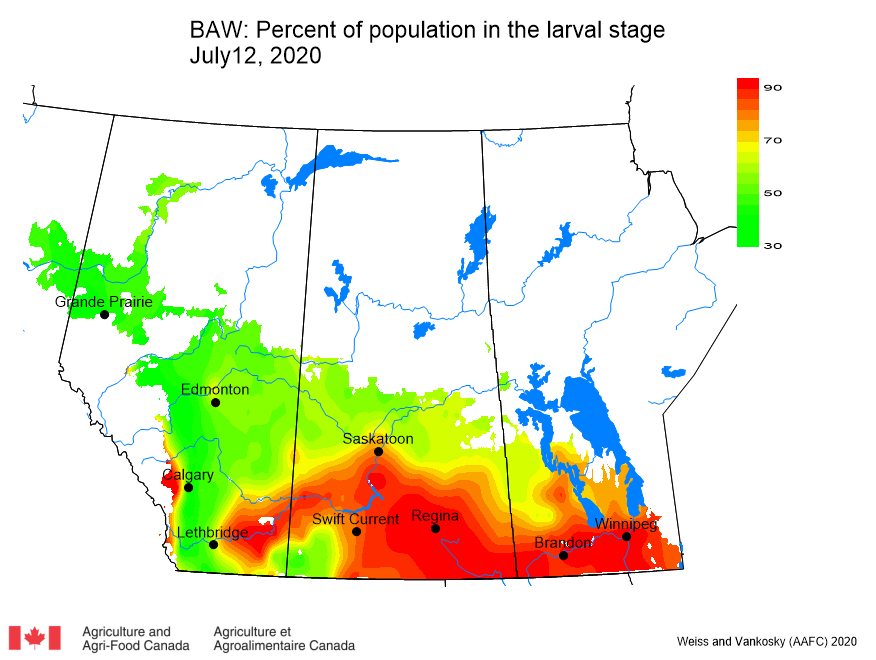
Image has not been reproduced in affiliation with, or with the endorsement of the Government of Canada and was retrieved (13Jul2020). Access the full map at http://www.agr.gc.ca/DW-GS/current-actuelles.jspx?lang=eng&jsEnabled=true&reset=1588297059209
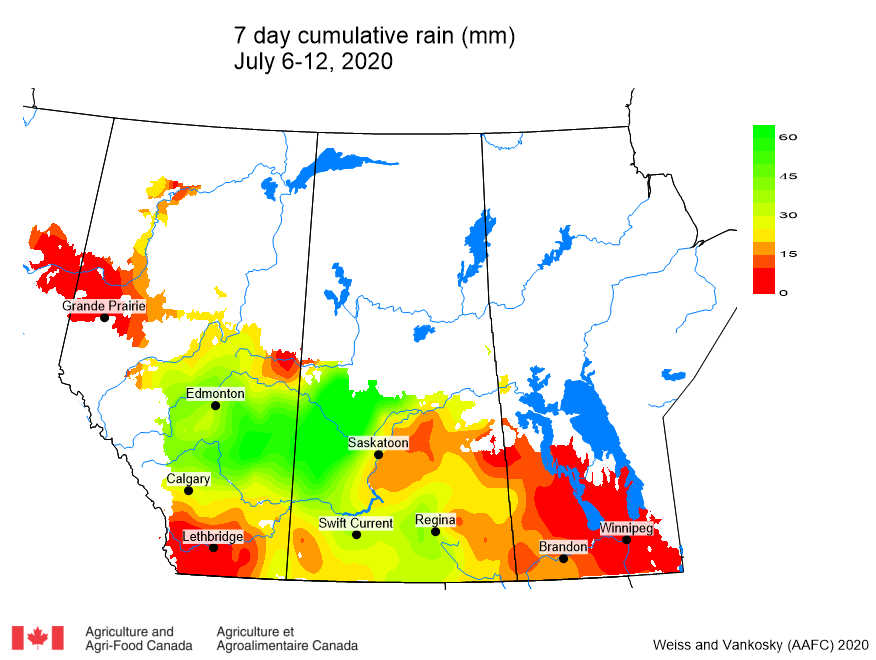
Cumulative rainfall for the past 7 days was lowest across southern regions of Alberta and across most of Manitoba (Table 1 Fig. 4). Lethbridge reported 4.2 mm and Winnipeg reported 1.4 mm (Table 1). Cumulative 30 day rainfall continued to be greatest across central regions of Alberta (Table 2; Fig. 5). Rainfall amounts were lowest across southern regions of the prairies (Table 2; Fig. 5).
Total 30-day rainfall at Brandon, Winnipeg and Swift Current was less than 100 mm (Table 2; Fig. 5). Lethbridge has reported 122.3 mm (261% of normal) in the past 30 days (Table 2). Growing season rainfall (percent of average) is below normal across eastern Saskatchewan and localized areas of Manitoba.
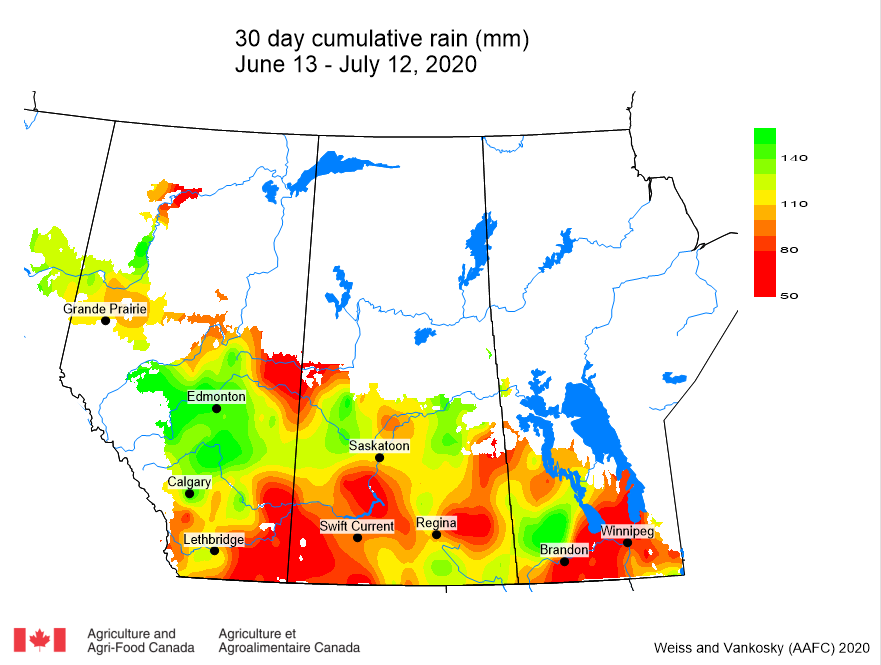
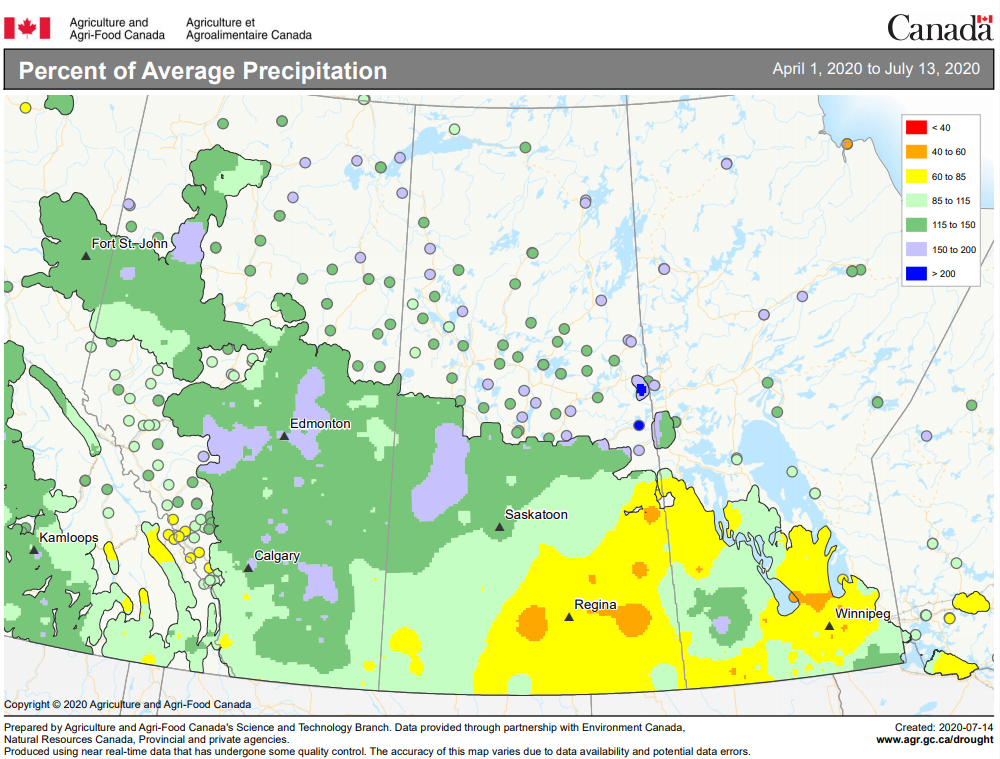
Image has not been reproduced in affiliation with, or with the endorsement of the Government of Canada and was retrieved (14Jul2020). Access the full map at http://www.agr.gc.ca/DW-GS/current-actuelles.jspx?lang=eng&jsEnabled=true&reset=1588297059209
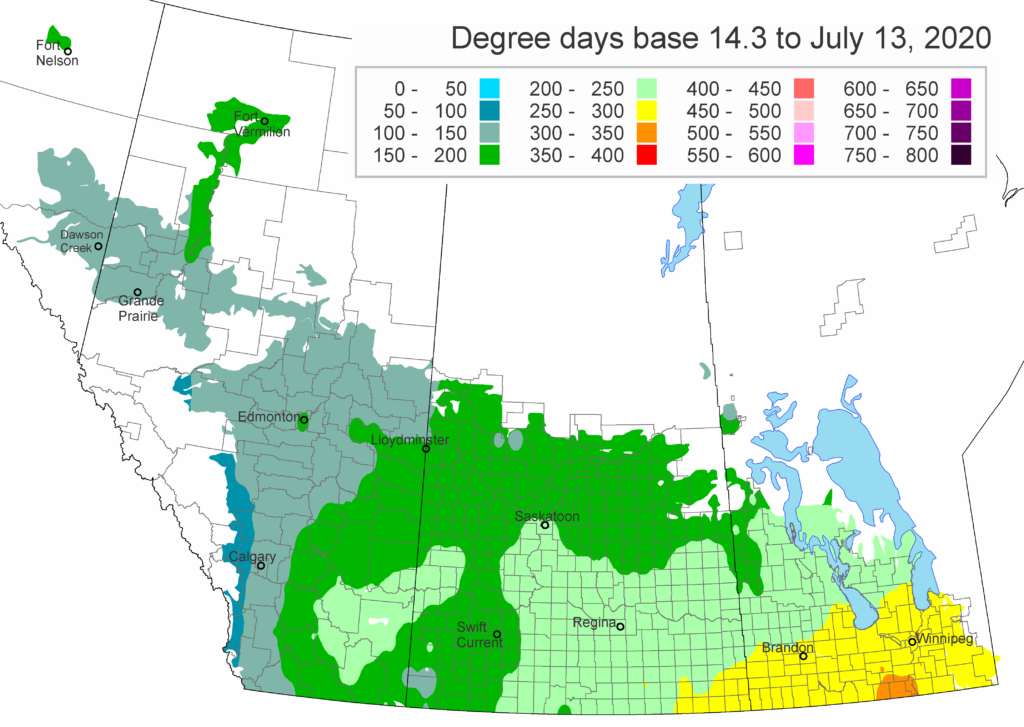
The growing degree day map (GDD) (Base 5 ºC, April 1-July 13, 2020) is below (Fig. 7):
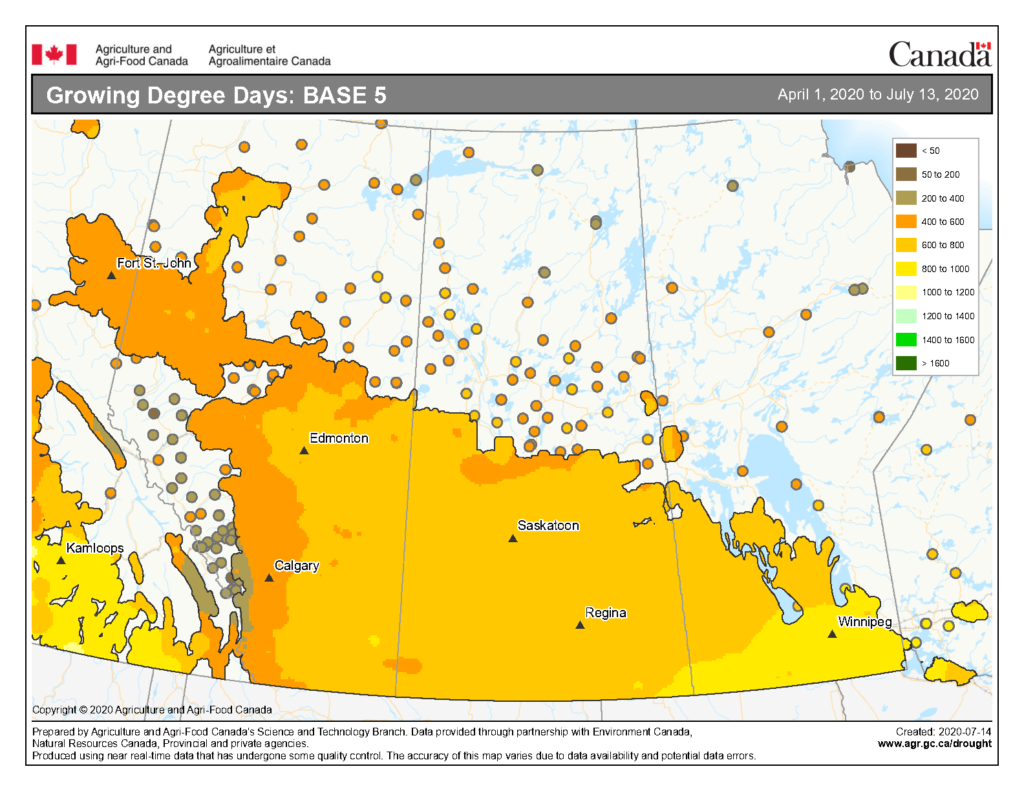
Image has not been reproduced in affiliation with, or with the endorsement of the Government of Canada and was retrieved (16Jul2020). Access the full map at http://www.agr.gc.ca/DW-GS/current-actuelles.jspx?lang=eng&jsEnabled=true&reset=1588297059209
The growing degree day map (GDD) (Base 10 ºC, April 1-July 13, 2020) is below (Fig. 8):
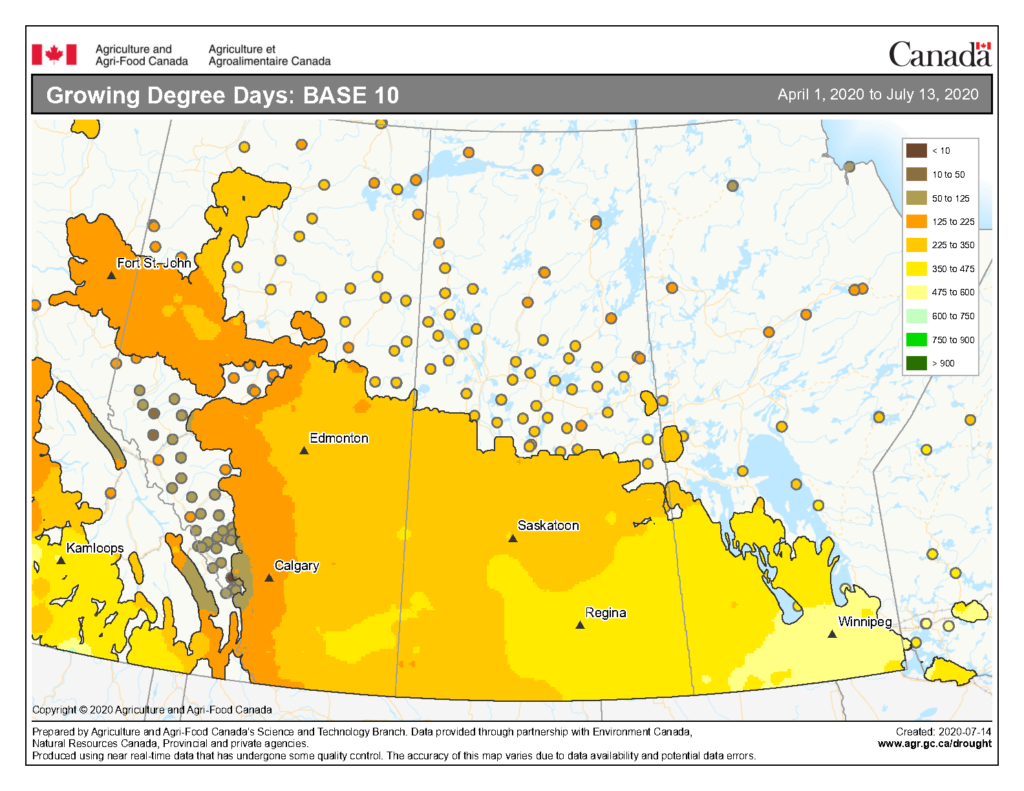
Image has not been reproduced in affiliation with, or with the endorsement of the Government of Canada and was retrieved (16Jul2020). Access the full map at http://www.agr.gc.ca/DW-GS/current-actuelles.jspx?lang=eng&jsEnabled=true&reset=1588297059209
The highest temperatures (°C) observed the past seven days ranged from <15 to >33 °C in the map below (Fig. 9).
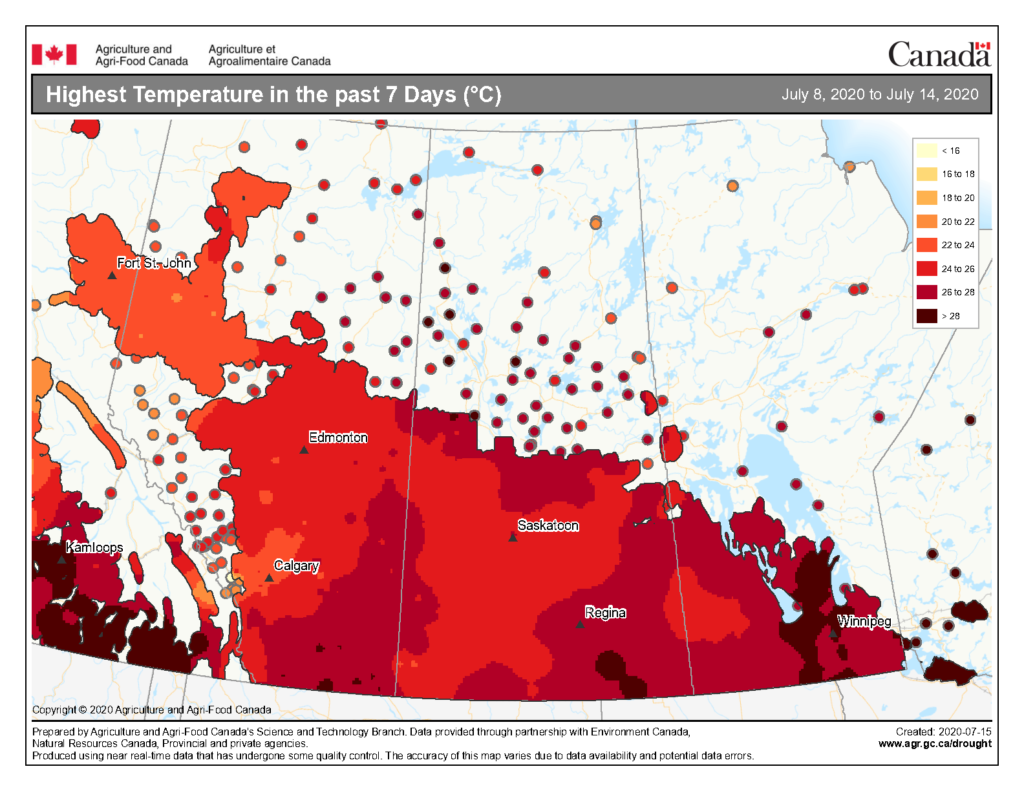
Image has not been reproduced in affiliation with, or with the endorsement of the Government of Canada and was retrieved (16Jul2020). Access the full map at http://www.agr.gc.ca/DW-GS/current-actuelles.jspx?lang=eng&jsEnabled=true&reset=1588297059209
The maps above are all produced by Agriculture and Agri-Food Canada. Growers can bookmark the AAFC Current Conditions Drought Watch Maps for the growing season. Historical weather data can be access at the AAFC Drought Watch website, Environment Canada’s Historical Data website, or your provincial weather network.