This is Week 17 and the last Weekly Update for 2020! It’s been an exceptional field season – responding to COVID-19 and a new website for the Prairie Pest Monitoring Network! Watch for special releases during the fall and winter. Your best option is to please subscribe to the new website to stay informed.
We thank the many people who have been monitoring, collecting, compiling and generating data throughout this growing season – your exceptional efforts are appreciated and critical! We also sincerely thank the many researchers, talented technical support staff, and the many students who have contributed to agricultural field crop protection, arthropod biodiversity, and insect pest management this season!
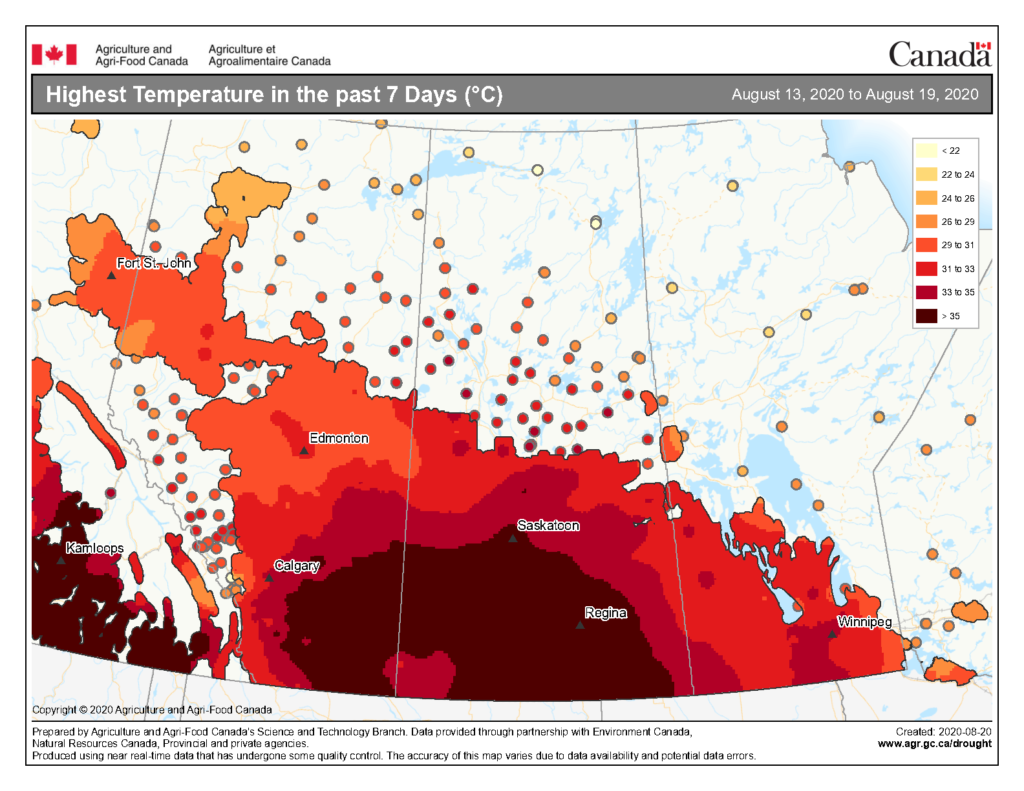
An abbreviated synopsis is provided for the final Weekly Update of the 2020 growing season. It was a warm week for most of the prairies! The highest temperatures the past seven days across the prairies are represented in Figure 1 and ranged from <22 to >35 °C.
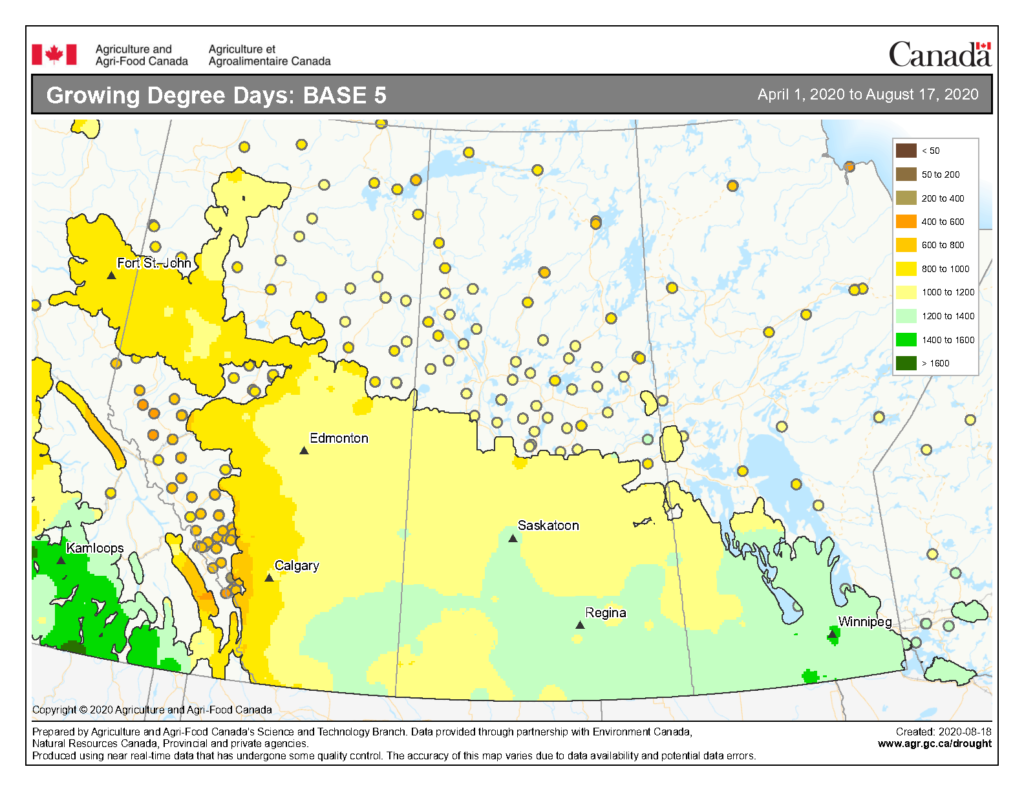
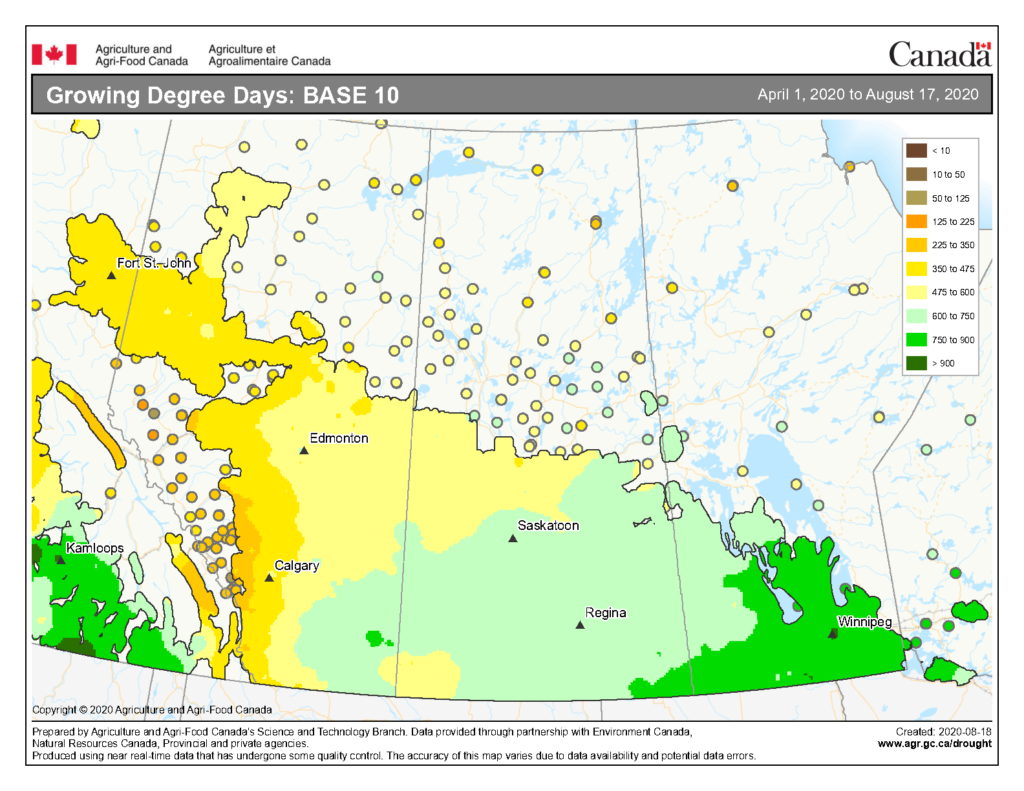
All those high temperatures advanced the accumulation of heat units across the prairies. The growing degree day map (GDD) (Base 5 ºC, April 1-August 17, 2020) is below (Fig. 2) while the growing degree day map (GDD) (Base 10 ºC, April 1-August 17, 2020) is shown in Figure 3.
Figure 2. Growing degree day map (Base 5 °C) observed across the Canadian prairies for the growing season (April 1-August 17, 2020). Image has not been reproduced in affiliation with, or with the endorsement of the Government of Canada and was retrieved (20Aug2020). Access the full map at http://www.agr.gc.ca/DW-GS/current-actuelles.jspx?lang=eng&jsEnabled=true&reset=1588297059209Figure 3. Growing degree day map (Base 10 °C) observed across the Canadian prairies for the growing season (April 1-August 17, 2020). Image has not been reproduced in affiliation with, or with the endorsement of the Government of Canada and was retrieved (20Aug2020). Access the full map at http://www.agr.gc.ca/DW-GS/current-actuelles.jspx?lang=eng&jsEnabled=true&reset=1588297059209
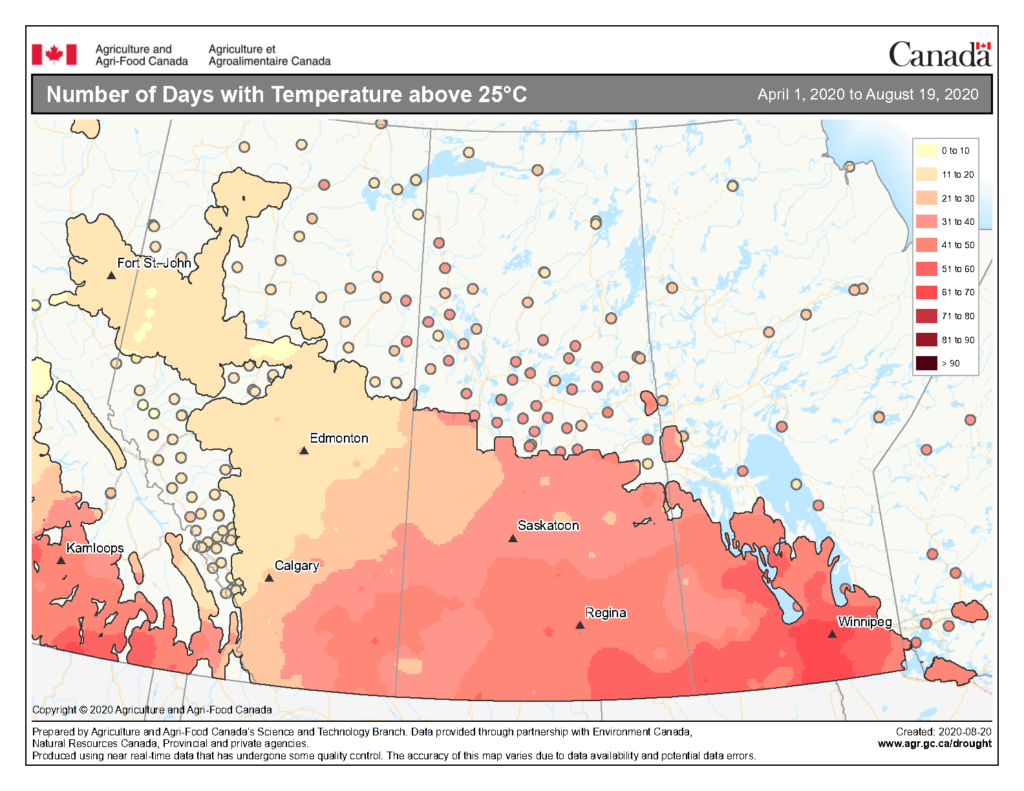
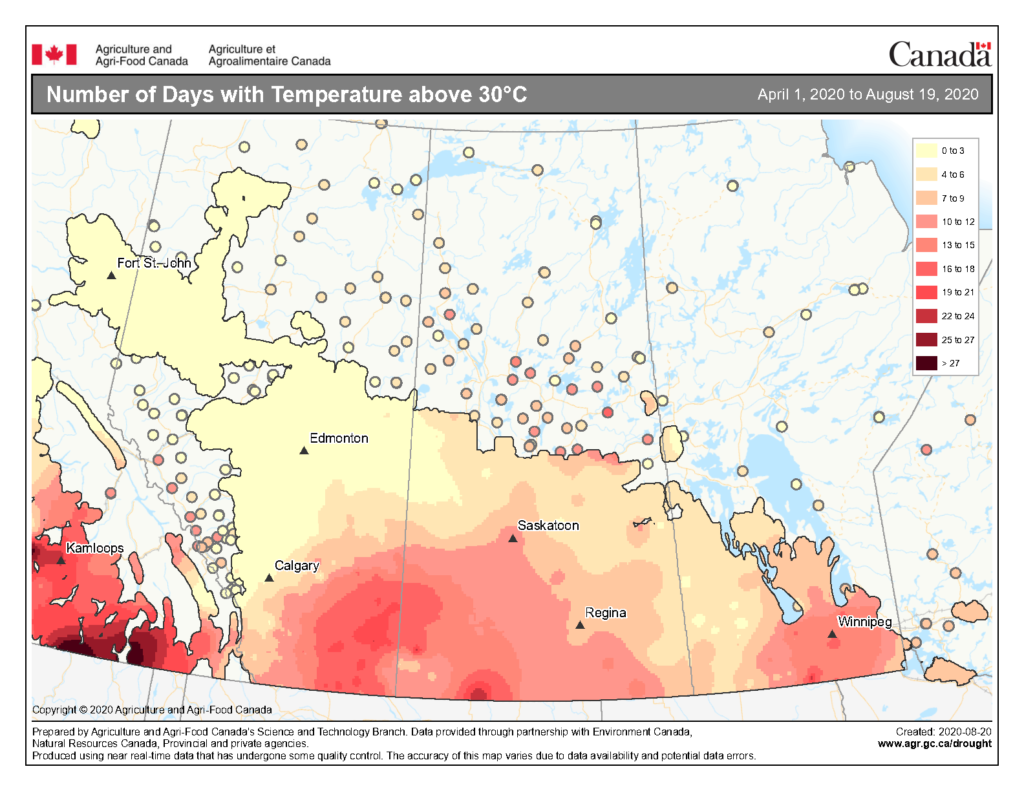
So far this growing season, the number of days above 25 °C ranges from 0-10 days in the northwest of the prairies then increases up to 61-70 days in southern Manitoba (Fig. 4). In comparison, the number of days above 30 °C ranges up to 25-27 days in southern Saskatchewan and southern Manitoba (Fig. 5)
Figure 4. Number of days above 25 °C observed across the Canadian prairies this growing season (April 1-August 19, 2020). Image has not been reproduced in affiliation with, or with the endorsement of the Government of Canada and was retrieved (20Aug2020). Access the full map at http://www.agr.gc.ca/DW-GS/current-actuelles.jspx?lang=eng&jsEnabled=true&reset=1588297059209Figure 5. Number of days above 30 °C observed across the Canadian prairies this growing season (April 1-August 19, 2020). Image has not been reproduced in affiliation with, or with the endorsement of the Government of Canada and was retrieved (20Aug2020). Access the full map at http://www.agr.gc.ca/DW-GS/current-actuelles.jspx?lang=eng&jsEnabled=true&reset=1588297059209
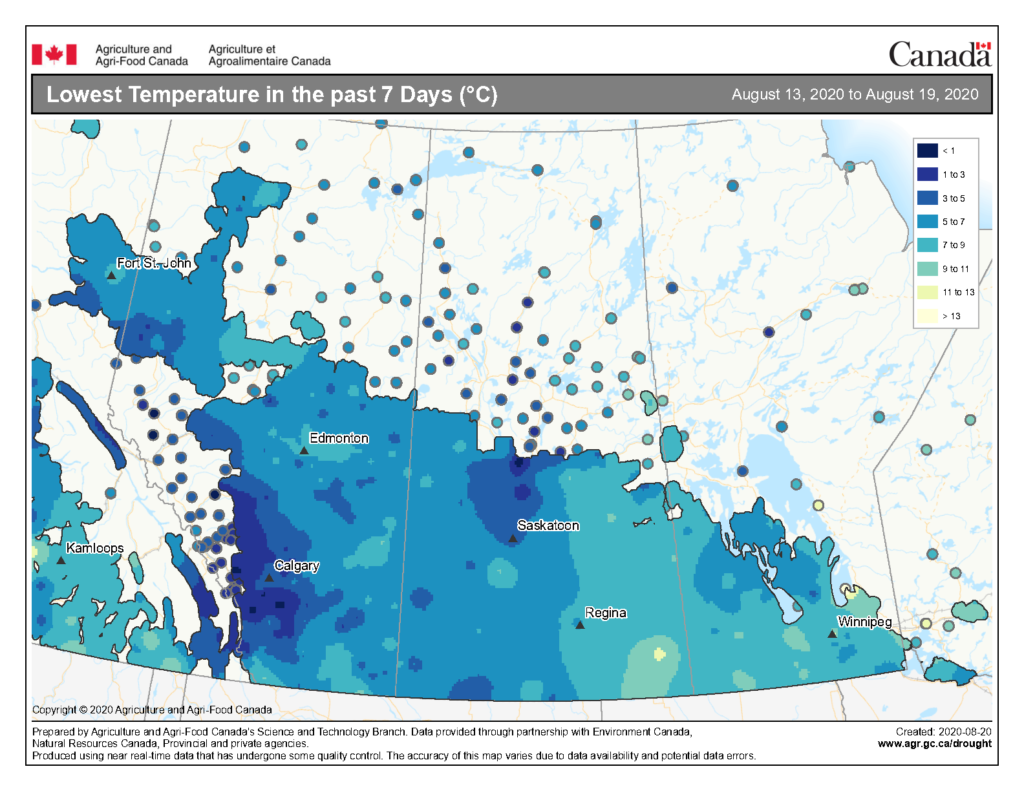
As fields continue to mature in late August and in to September, growers will be watching for cool evenings. The lowest temperatures the past seven days across the prairies are represented in Figure 6 and ranged from <1 to >13 °C.
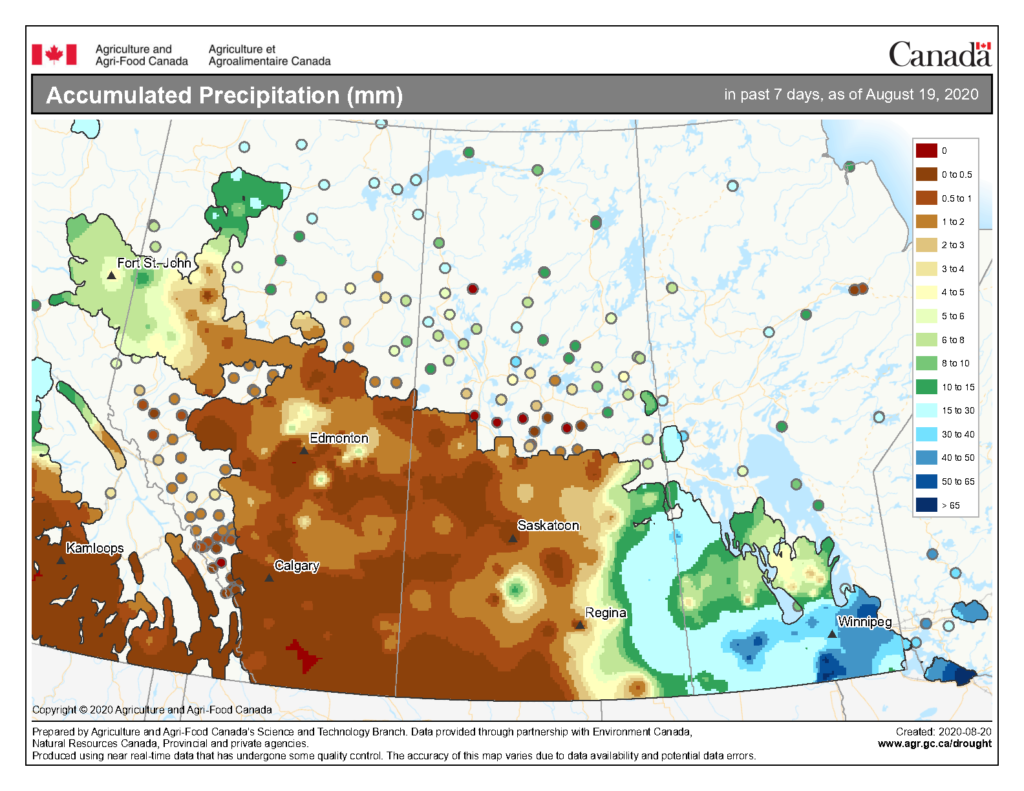
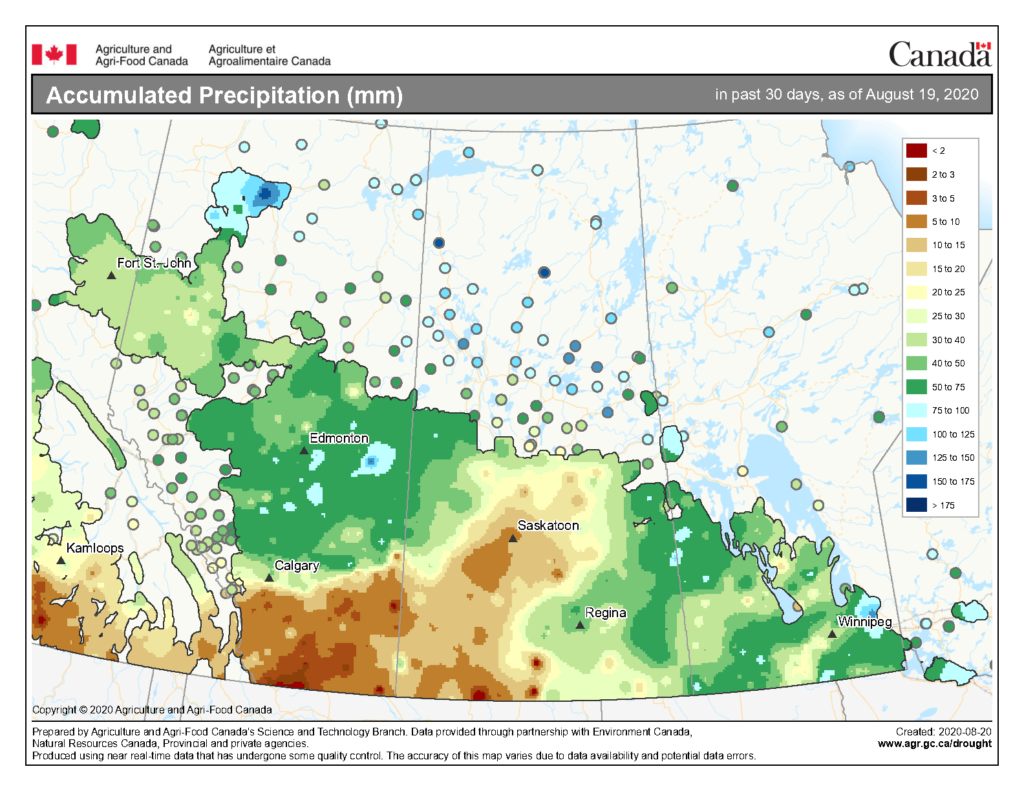
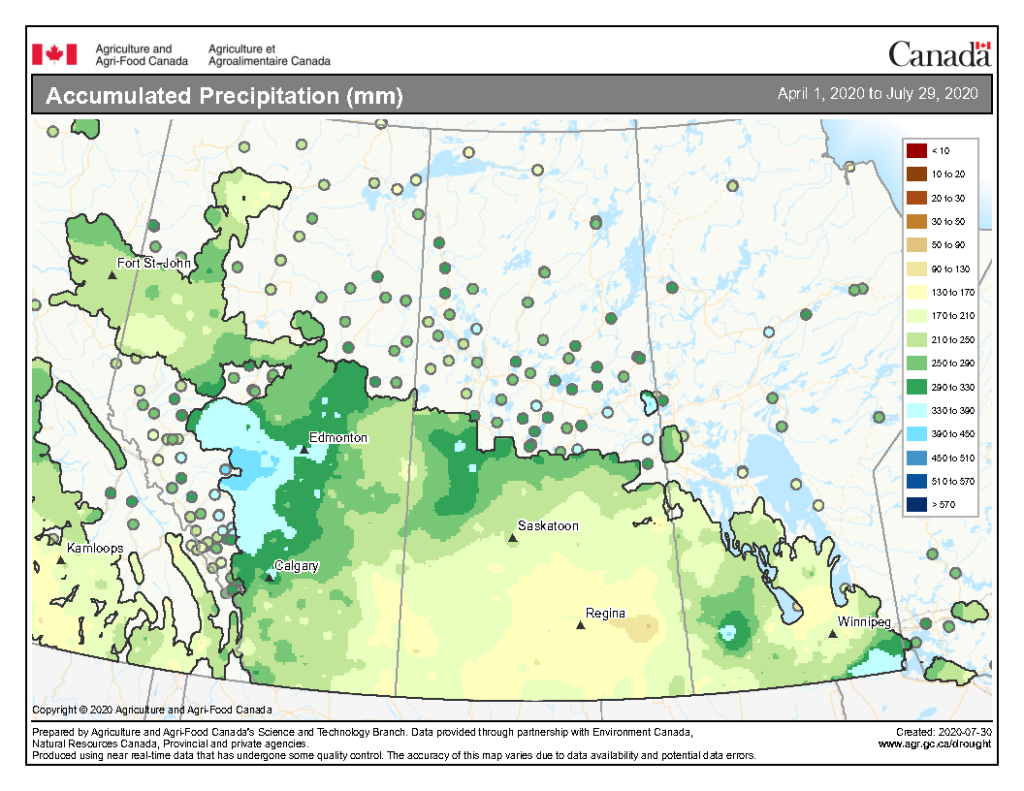
Cumulative rainfall for the past 7 days was lowest across central and southern regions of Alberta and Saskatchewan while western and northern areas of the Peace River region AND eastern Saskatchewan plus much of Manitoba received more moisture (Fig. 7). Cumulative 30-day (Fig. 8) and rainfall for the growing season (April 1-August 19, 2020; Fig. 9) are below.
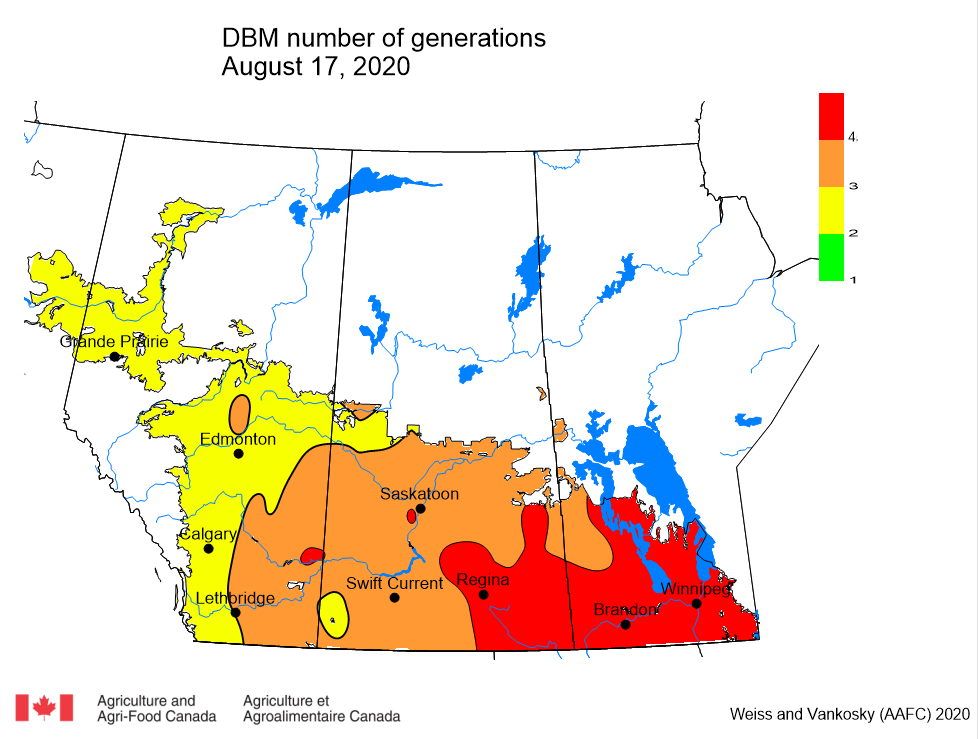
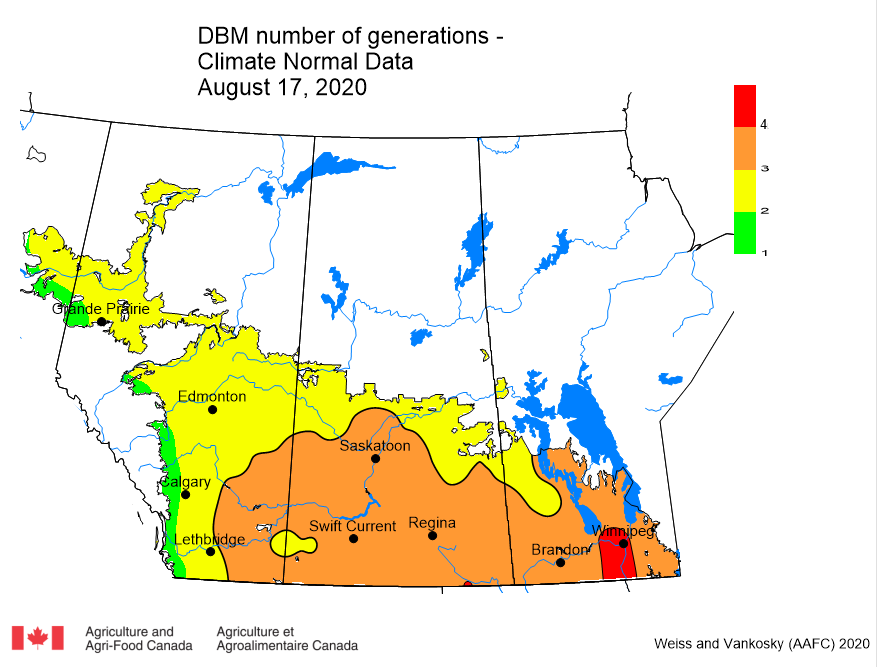
The Diamondback moth (DBM) model was run with a biofix of May 15, 2020. DBM densities generally increase with increasing numbers of generations. Figure 1 represents the model output for the 2020 growing season (as of August 17, 2020). The number of generations varies from two in western Alberta to four in southeastern Saskatchewan and most of Manitoba (Fig. 1). Next, the model was run with climate normal data to compare the 2020 growing season with an ‘average’ growing season (Fig. 2). The second map (climate normal) indicates that an average growing season results in two to three generations, with a fourth generation predicted to occur near Winnipeg (Fig. 2). These results indicate that there was an elevated DBM risk in 2020.
Figure 1. Using a biofix date of May 15, 2020, the projected number of diamondback moth (Plutella xylostella) generations across the Canadian prairies as of August 17, 2020.Figure 2. Using a biofix date of May 15, 2020, the projected number of diamondback moth (Plutella xylostella) generations across the Canadian prairies as of August 17, 2020, using climate normal data.
The economic threshold for diamondback moth in canola at the advanced pod stage is 20 to 30 larvae/ 0.1 m² (approximately 2-3 larvae per plant). Economic thresholds for canola or mustard in the early flowering stage are not available. However, insecticide applications are likely required at larval densities of 10 to 15 larvae/ 0.1 m² (approximately 1-2 larvae per plant).
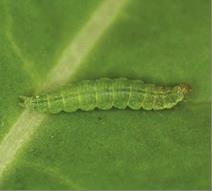
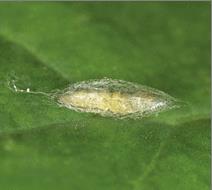
Monitoring to apply the economic threshold: Remove the plants in an area measuring 0.1 m² (about 12″ square). Beat them on to a clean surface and count the number of larvae (Fig. 3) dislodged from the plant. Repeat this procedure at least in five locations in the field to get an accurate count.
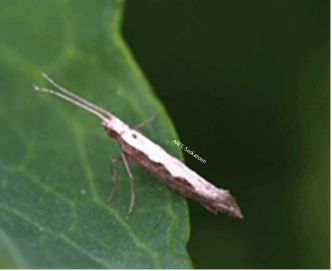
Figure 3. Diamondback larva measuring ~8mm long. Note brown head capsule and forked appearance of prolegs on posterior.Figure 4. Diamondback moth pupa within silken cocoon.Figure 5. Diamondback moth.
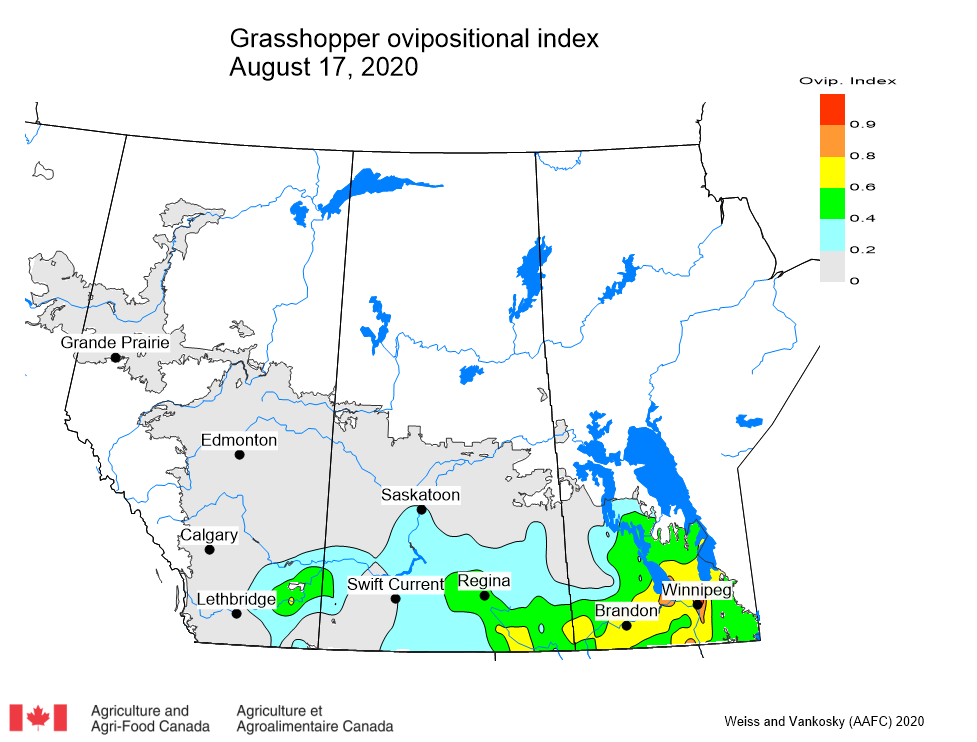
The oviposition index provides a snapshot of how growing season conditions impact grasshopper development and subsequent oviposition. Advanced development of the current generation will result in greater potential egg production by females at the end of this growing season. Figure 1 represents model output for the 2020 growing season (as of August 17, 2020). In Alberta, cooler, wetter conditions in May and June were not conducive for grasshopper development. This has resulted in a prediction for lower oviposition potential for most of Alberta. Warmer, dryer conditions in Manitoba and southeastern Saskatchewan resulted in higher oviposition indices.
Figure 1. Predicted oviposition for (Melanoplus sanguinipes) populations across the Canadian prairies (as of August 17, 2020).
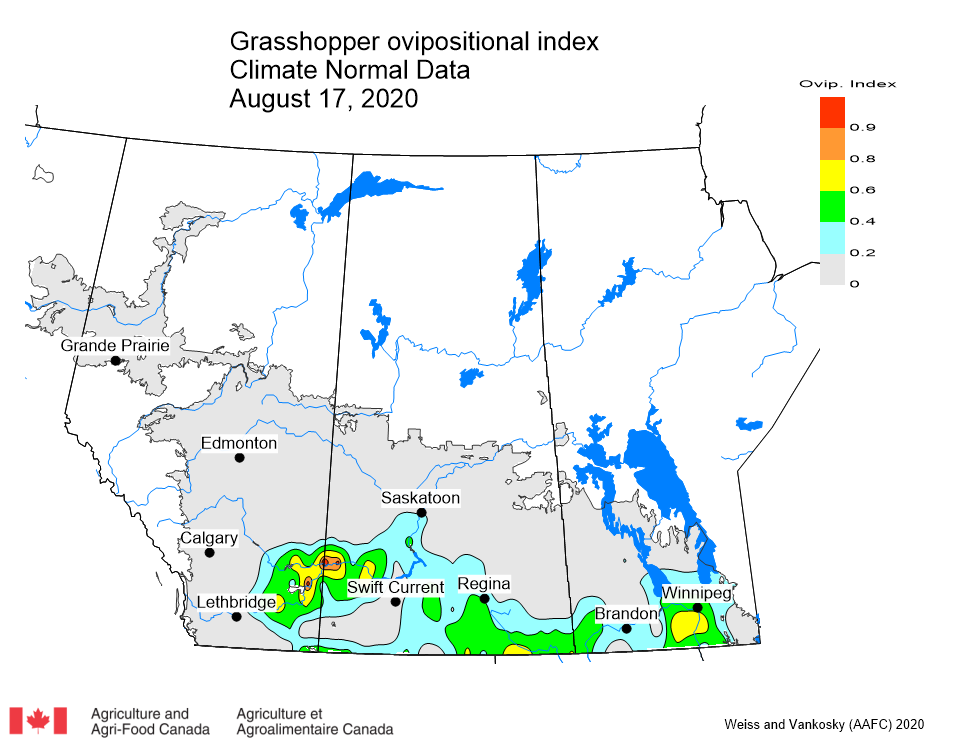
The model was run with climate normal data to compare the 2020 growing season with 30 year climate normals. The second map (climate normal) indicates that, in an average growing season, the greatest oviposition index values are observed for southeast Alberta and southwest Saskatchewan (Figure 2). Results suggest that the 2020 growing season was more favourable for grasshopper populations in Manitoba and southeastern Saskatchewan than for western Saskatchewan and most of Alberta.
Figure 2. Predicted oviposition for (Melanoplus sanguinipes) populations across the Canadian prairies (as of August 17, 2020) using climate normal data.
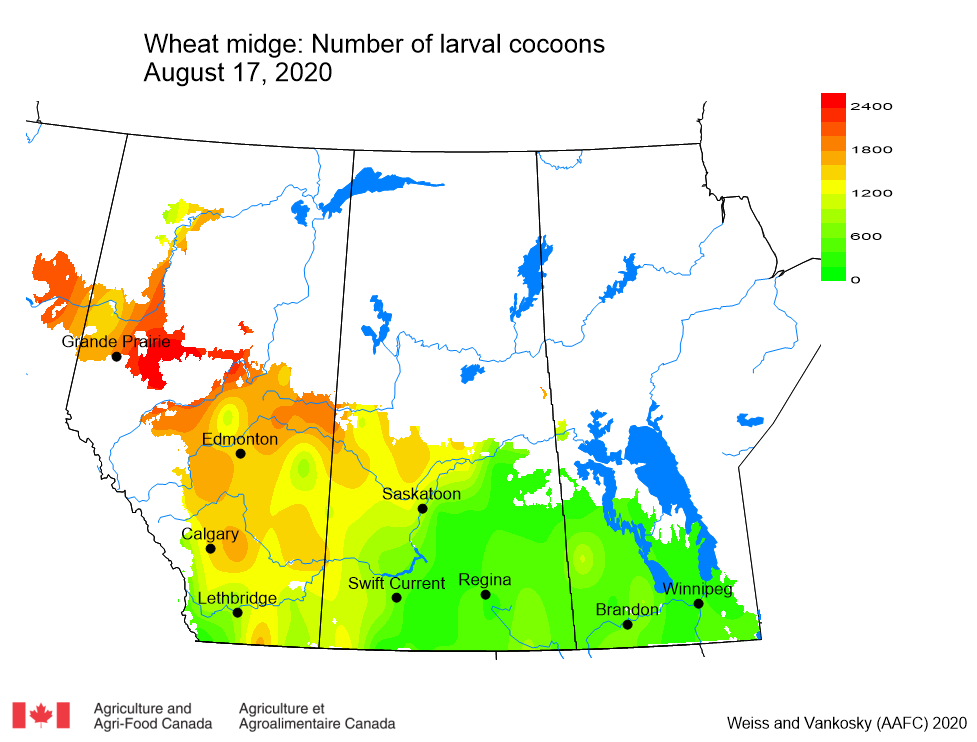
Cool, wetter growing seasons generally favour wheat midge development. Wheat midge larvae overwinter in the soil in larval cocoons. Adequate soil moisture (May-June) is required to terminate diapause, resulting in movement of larvae to the soil surface. The wheat midge model was run to determine potential numbers of overwintering wheat midge larvae.
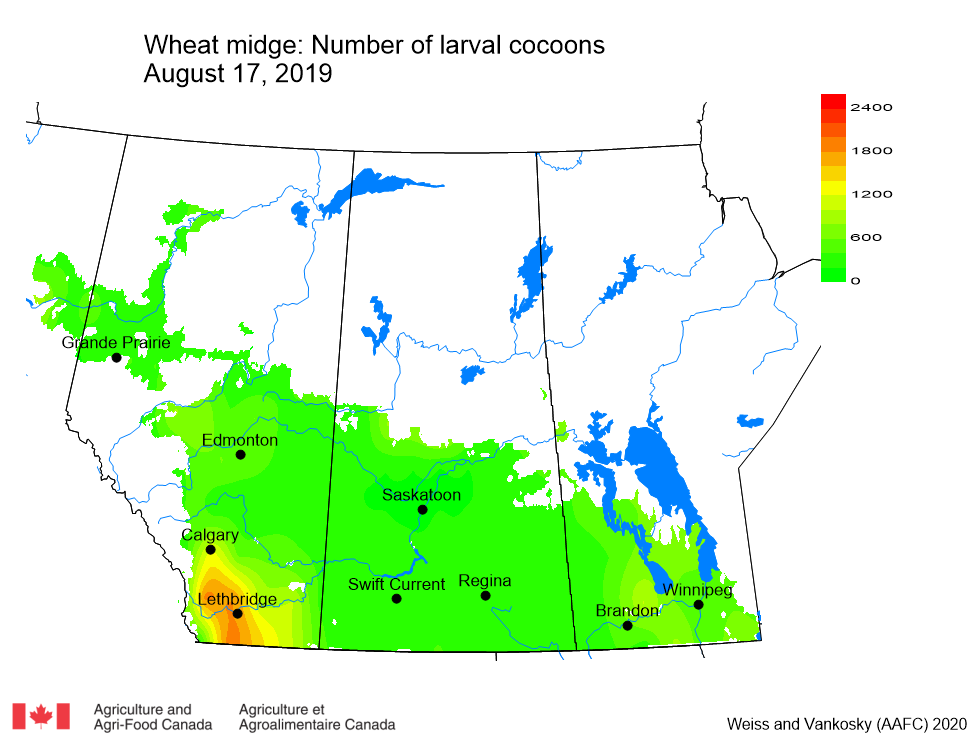
During May and June weather conditions were cooler and wetter than normal across most of Alberta. These model runs indicated that weather conditions that would promote diapause termination and movement of larvae to the soil surface were favourable, and may have resulted in higher than average adult populations in early July. Conversely, warm, dry conditions occurred across most of Manitoba and were not suitable for larval development during May and June. Figure 1 represents the potential number of larval cocoons (as of August 17, 2020). Densities of wheat midge larval cocoons were predicted to be greater across Alberta than Saskatchewan and Manitoba (Fig. 1). Figure 2 provides a comparison of densities for the same time period in 2019. Low densities in 2019 were attributed to well below normal precipitation during the period of April to June (Fig. 2).
Figure 1. Predicted number of larval cocoons of wheat midge (Sitodiplosis mosellana) across the Canadian prairies as of August 17, 2020.Figure 2. Predicted number of larval cocoons of wheat midge (Sitodiplosis mosellana) across the Canadian prairies as of August 17, 2019.
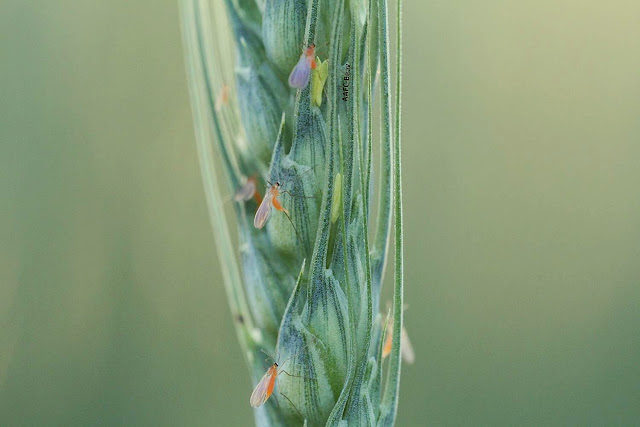
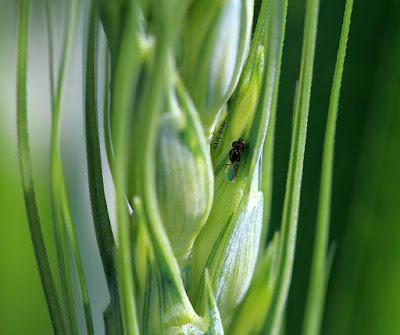
Review information supporting in-field monitoring for wheat midge (Fig. 3) and its parasitoid, Macroglenes penetrans (Fig. 4), posted back on Week 14 of the 2020 growing season.
Figure 3. Wheat midge (Sitodiplosis mosellana) laying their eggs on the wheat heads (Photo: AAFC-Beaverlodge-S. Dufton & A. Jorgensen).Figure 4. Macroglenes penetrans, a parasitoid wasp that attacks wheat midge, measures only ~2 mm long. (Photo: AAFC-Beaverlodge-S. Dufton).
More information about Wheat midge can be found by accessing the pages from the new “Field Crop and Forage Pests and their Natural Enemies in Western Canada: Identification and Field Guide”. View ONLY the Wheat midge pages but remember the guide is available as a free downloadable document as both an English-enhanced or French-enhanced version.
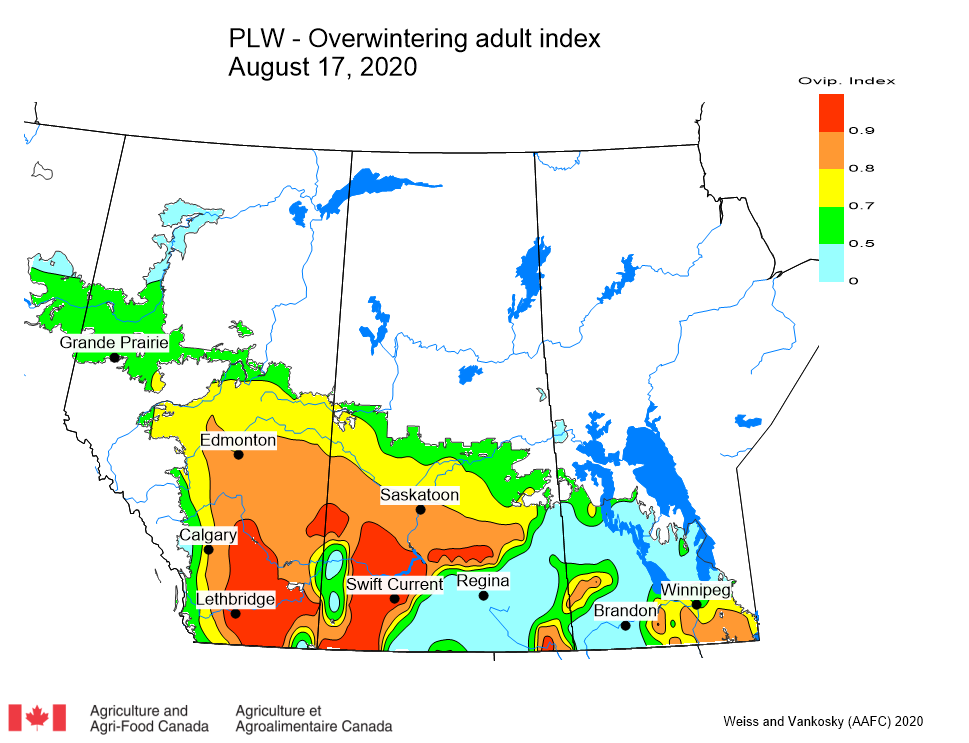
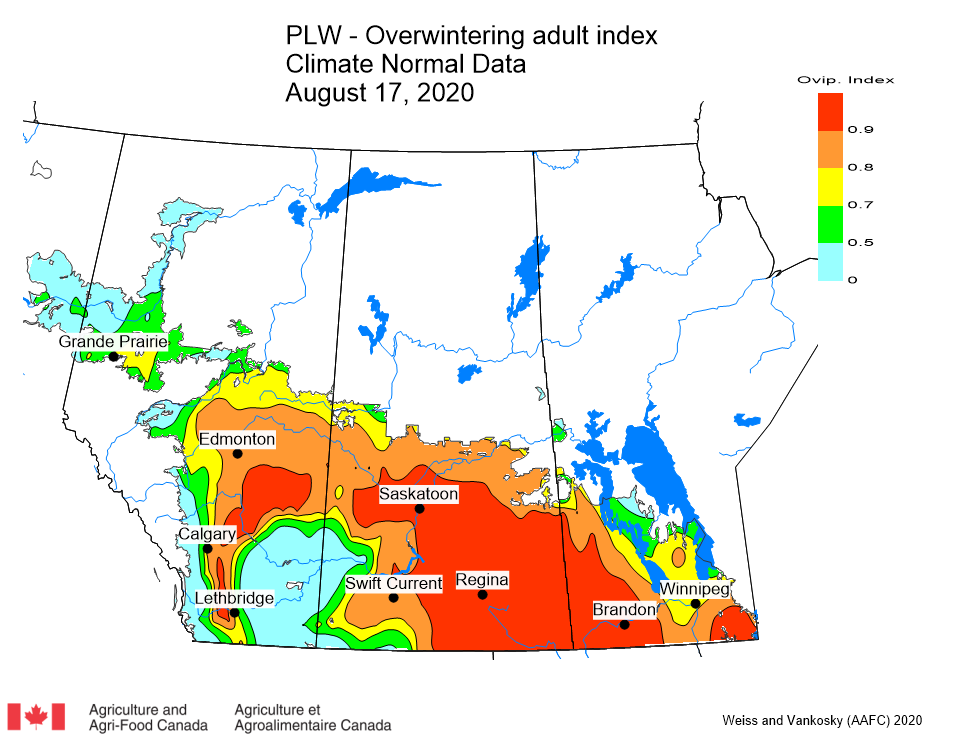
As of August 17, 2020, the Pea leaf weevil (PLW) model indicates that pupation is complete and adults are beginning to emerge from pea fields. The PLW model predicts that warm, dry conditions in June and early July may reduce larval survival. Wetter conditions during June and July were more favourable for PLW population development in Alberta than in eastern Saskatchewan and Manitoba. These factors resulted in lower overwintering adult index values for the eastern prairie region than for western regions (Fig. 1). Figure 2 represents the expected overwintering index values for PLW using climate normal data. Note that, to our knowledge, populations of pea leaf weevil remain low in Manitoba and are confined to the Swan River Valley region at this time.
Figure 1. The predicted overwintering adult index of pea leaf weevil (Sitona lineatus) across the Canadian prairies as of August 17, 2020.Figure 2. The predicted overwintering adult index of pea leaf weevil (Sitona lineatus) across the Canadian prairies as of August 17, 2020, using climate normal data.
The pea leaf weevil is a slender greyish-brown insect measuring approximately 5 mm in length (Fig. 3, Left image). Pea leaf weevil resembles the sweet clover weevil (Sitona cylindricollis) but the former is distinguished by three light-coloured stripes extending length-wise down thorax and sometimes the abdomen. All species of Sitona, including the pea leaf weevil, have a short snout.
Figure 3. Comparison images and descriptions of four Sitona species adults including pea leaf weevil (Left).
Review a more complete description of this insect posted back on Week 11 of the 2020 growing season. Biological and monitoring information related to pea leaf weevil in field crops is posted by the province of Alberta and in the PPMN monitoring protocol.
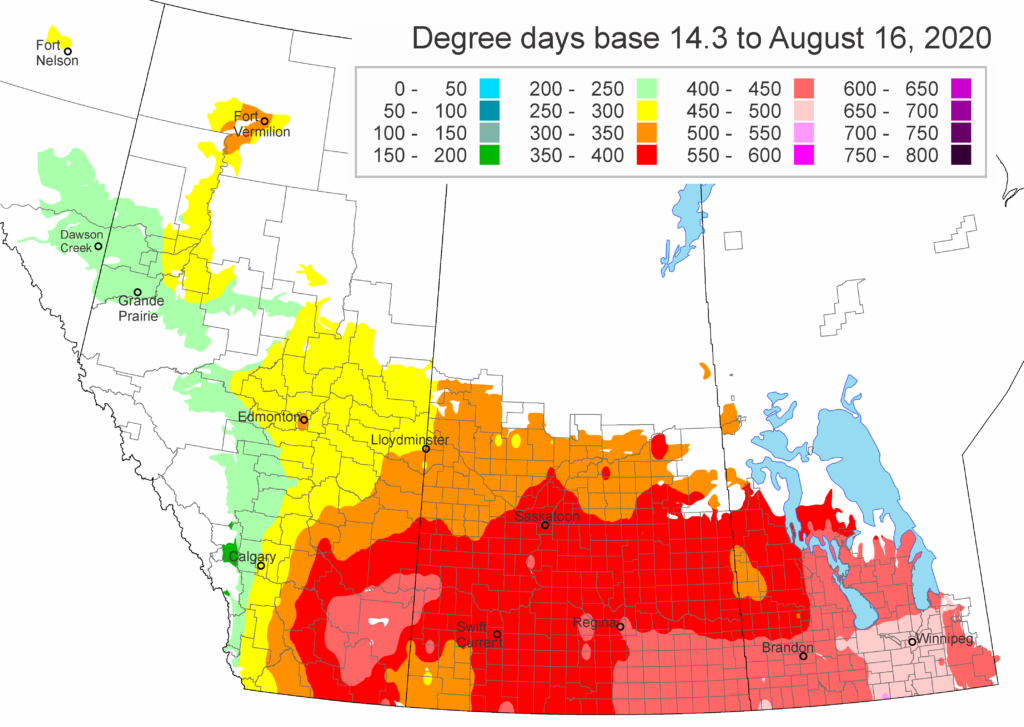
The following is offered to predict when Culex tarsalis, the vector for West Nile Virus, will begin to fly across the Canadian prairies (Fig. 1). This week, regions most advanced in degree-day accumulations for Culex tarsalis are shown in Figure 1. As of August 16, 2020 (Fig. 1), areas highlighted yellow and more imminently orange are approaching sufficient heat accumulation for mosquitoes to emerge. Areas highlighted red NOW HAVE Culex tarsalis flying (Fig. 1) – protect yourself by wearing DEET!
Figure 1. Predicted development of Culex tarsalis across the Canadian prairies (as of August 16, 2020).
Reminder – The Canadian Grain Commission is ready to grade grain samples harvested in 2020. Samples are accepted up to November 30 but growers normally send samples as soon as harvest is complete.
This is a FREE opportunity for growers to gain unofficial insight into the quality of grain and to obtain valuable dockage information and details associated with damage or quality issues. The data collected also helps Canada market its grain to the world!
More information on the Harvest Sample Program is available at the Canadian Grain Commission’s website where growers can register online to receive a kit to submit their grain.
In exchange for your samples, the CGC assesses and provides the following unofficial results FOR FREE:
unofficial grade
dockage assessment on canola
protein content on barley, beans, chick peas, lentils, oats, peas and wheat
oil, protein and chlorophyll content for canola
oil and protein content and iodine value for flaxseed
oil and protein for mustard seed and soybean
Falling Number for wheat
Vomitoxin (deoxynivalenol or DON) for wheat and corn.
It can be helpful to have grade and quality information on samples before delivering their grain. Read brochures produced by the Canadian Grain Commission describing the Harvest Sample Program and details specific to the Western version of the program.
Reminder – Entomologists with Agriculture and Agri-Food Canada in Winnipeg are doing a survey in September of insects in farm grain bins. They are looking for 10 farms not far from Winnipeg where they can access grain bins to sample insects. No grain will be removed, just insects. If interested, please contact John Gavloski (John.Gavloski@gov.mb.ca) as soon as possible.
Provincial entomologists provide insect pest updates throughout the growing season so link to their information:
• Manitoba‘s Crop Pest Updates for 2020 are available. Access the August 18 2020 report. The summary indicates that, “Grasshoppers continue to be the insect of greatest concern. Some have also commented on the high levels of flea beetles being observed in canola currently.”
• Alberta Agriculture and Forestry’s Agri-News occasionally includes insect-related information or Twitter users can connect to #ABBugChat Wednesdays at 10:00 am.