This past week (Aug 4-10, 2020) conditions were generally warm and dry. Weekly prairie temperatures were warmest across Manitoba and Saskatchewan (Fig. 1). Lower temperatures were observed across western and northwestern Alberta (Fig. 1). Though average 30-day (July 12 – August 10, 2020) temperatures continue to be cooler in Alberta than eastern Saskatchewan and Manitoba (Fig. 2), temperature anomalies (mean temperature difference from average; July 14-August 10, 2020) indicate that conditions have generally been warmer than average across most of Alberta as well as Parkland regions of Saskatchewan and Manitoba (Fig. 3).
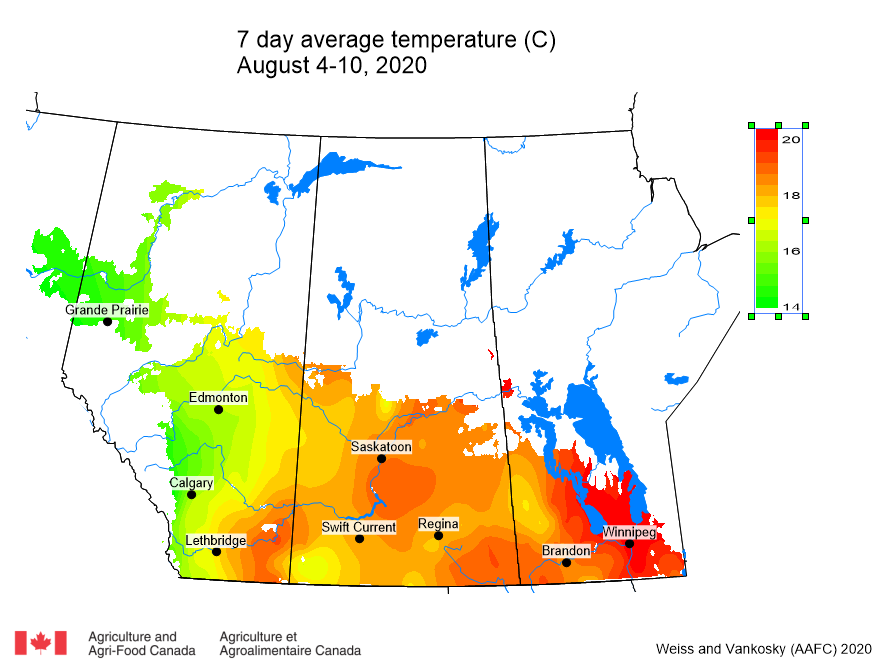
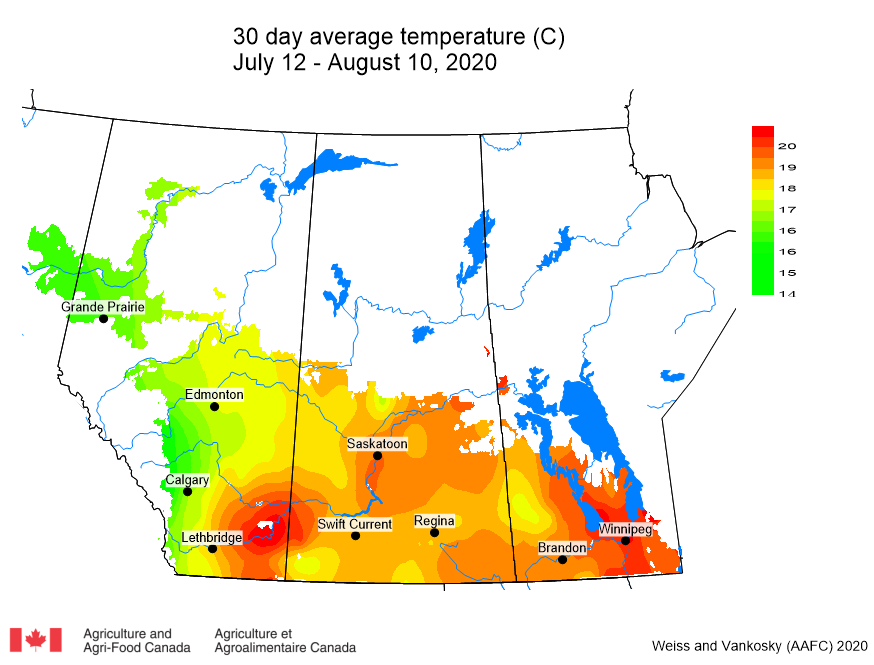
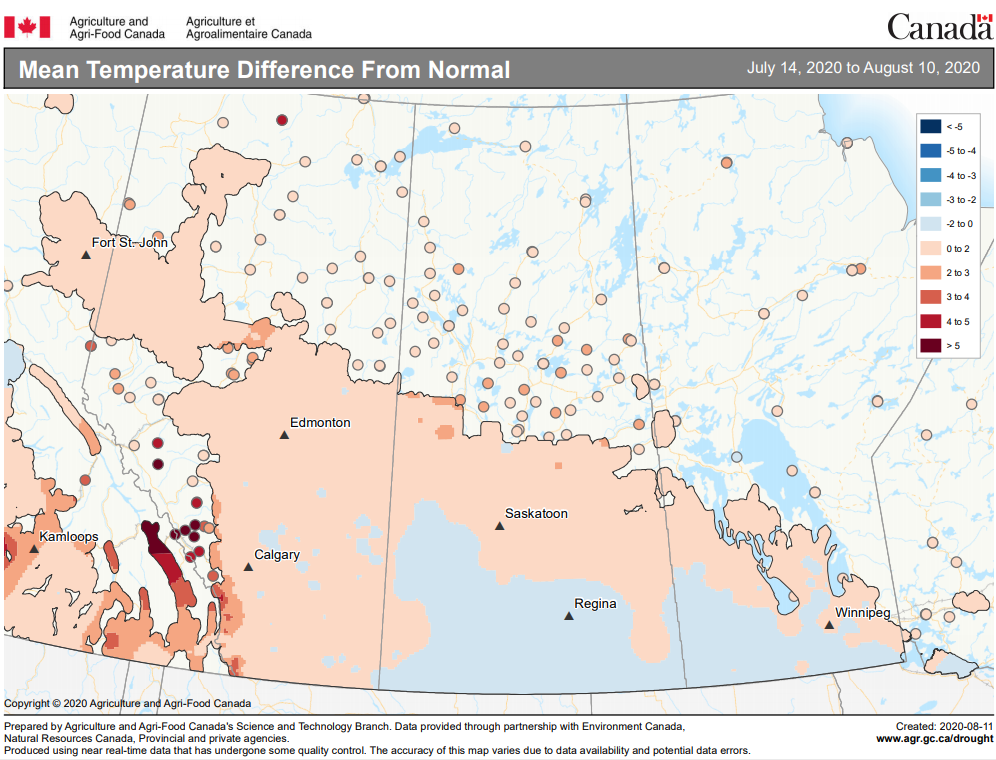
Image has not been reproduced in affiliation with, or with the endorsement of the Government of Canada and was retrieved (12Aug2020). Access the full map at http://www.agr.gc.ca/DW-GS/current-actuelles.jspx?lang=eng&jsEnabled=true&reset=1588297059209
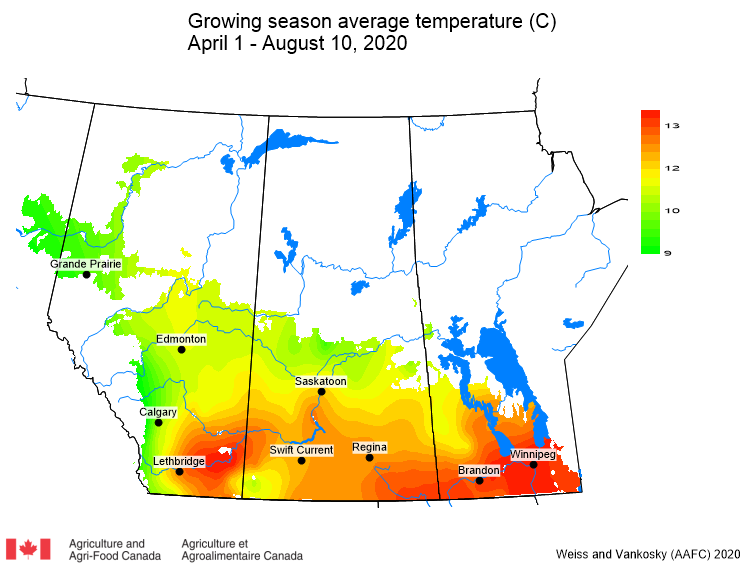
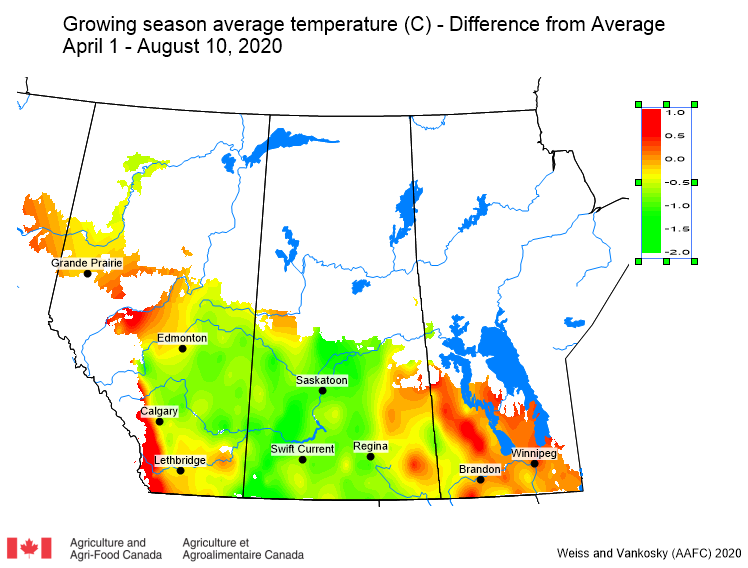
Regions in southeastern central and southern Saskatchewan and across southern Manitoba have reported temperatures that have been up to 2 °C cooler than average. Based on growing season temperatures (April 1-August 10, 2020) temperatures were warmest across the southern prairies (Fig. 4). Based on growing season temperature deviations (observed temperatures compared with climate normal temperatures), below average temperatures have been observed across central and western regions of Saskatchewan and central regions of Alberta (Fig. 5). Across southern Alberta and most of Manitoba, temperatures have generally been above average. (Fig. 5)
Most areas reported 7-day cumulative rainfall amounts that were less than 10 mm (Fig. 6). Cumulative 30-day rainfall was lowest across a large area ranging across southern Alberta as well as central and western regions of Saskatchewan (Fig. 7). Growing season rainfall (percent of average) is highly variable across the prairies (Fig. 8). Rainfall has been below normal across most of Saskatchewan as well as southern Alberta, and the Peace River region (Fig. 8).
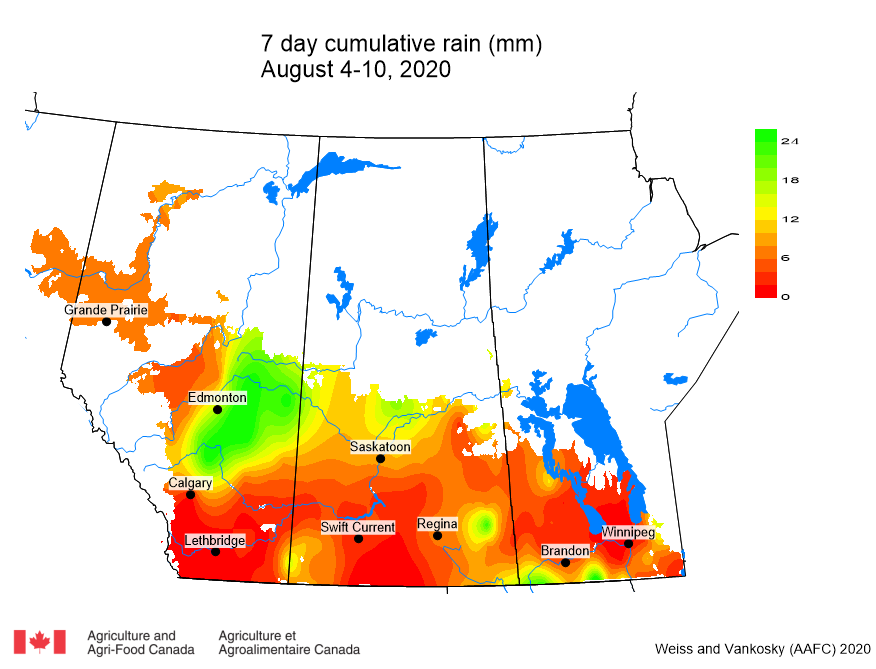
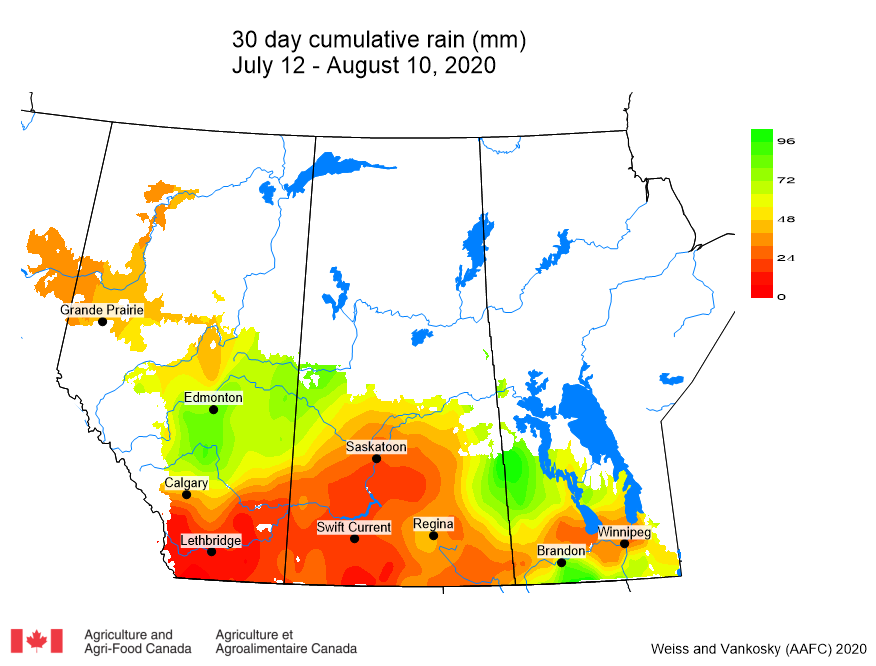
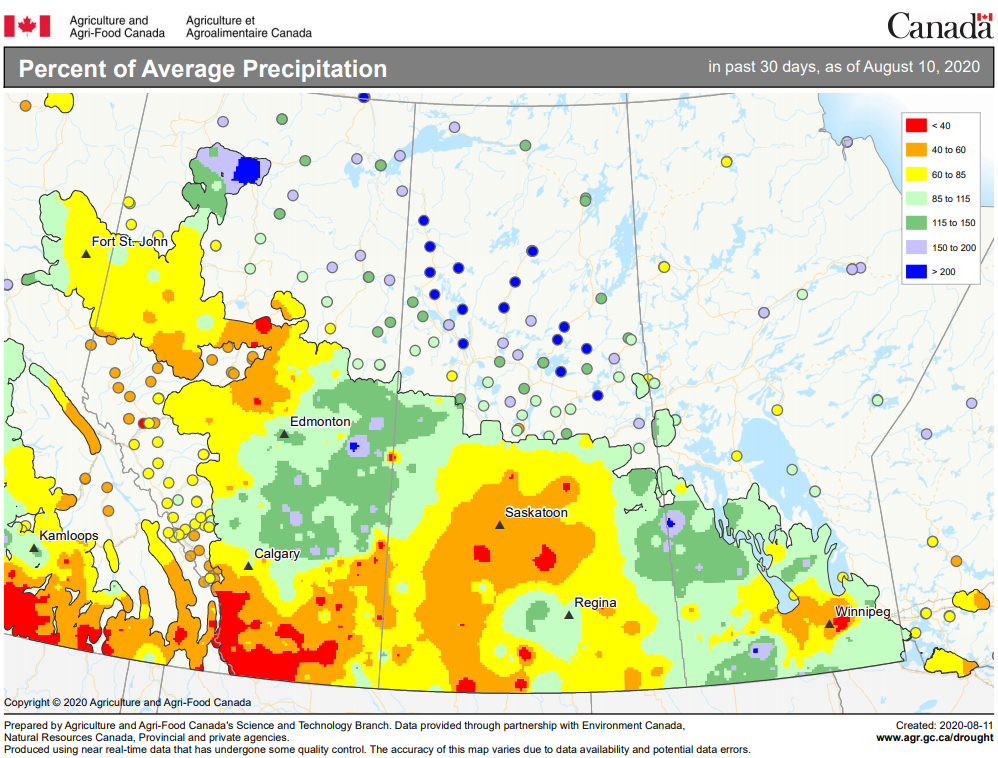
Image has not been reproduced in affiliation with, or with the endorsement of the Government of Canada and was retrieved (12Aug2020). Access the full map at http://www.agr.gc.ca/DW-GS/current-actuelles.jspx?lang=eng&jsEnabled=true&reset=1588297059209
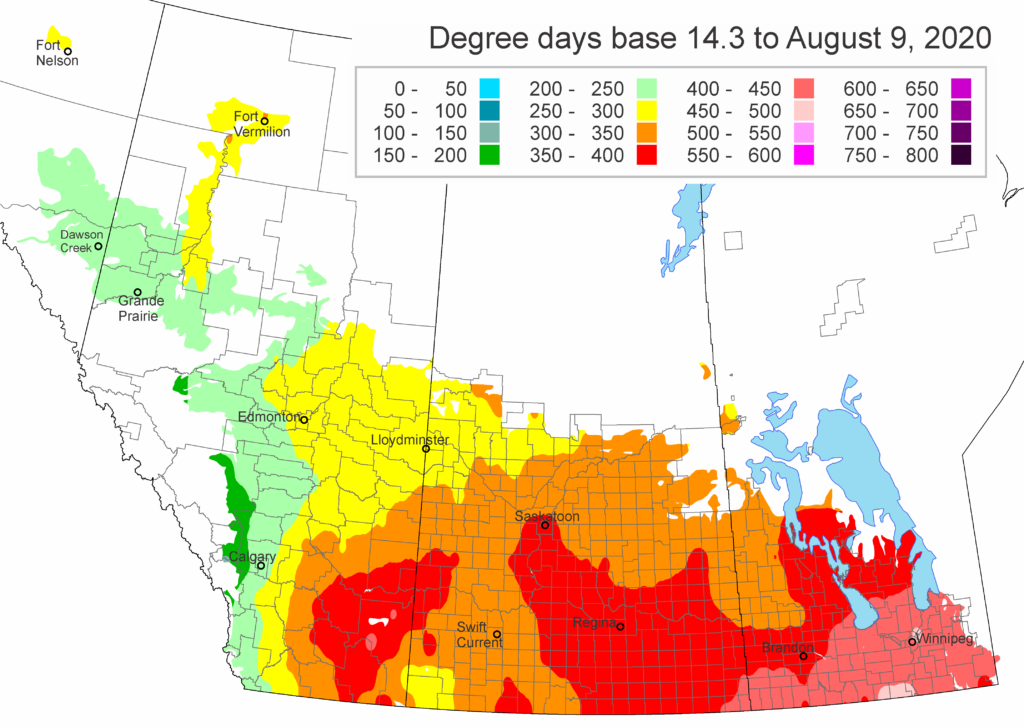
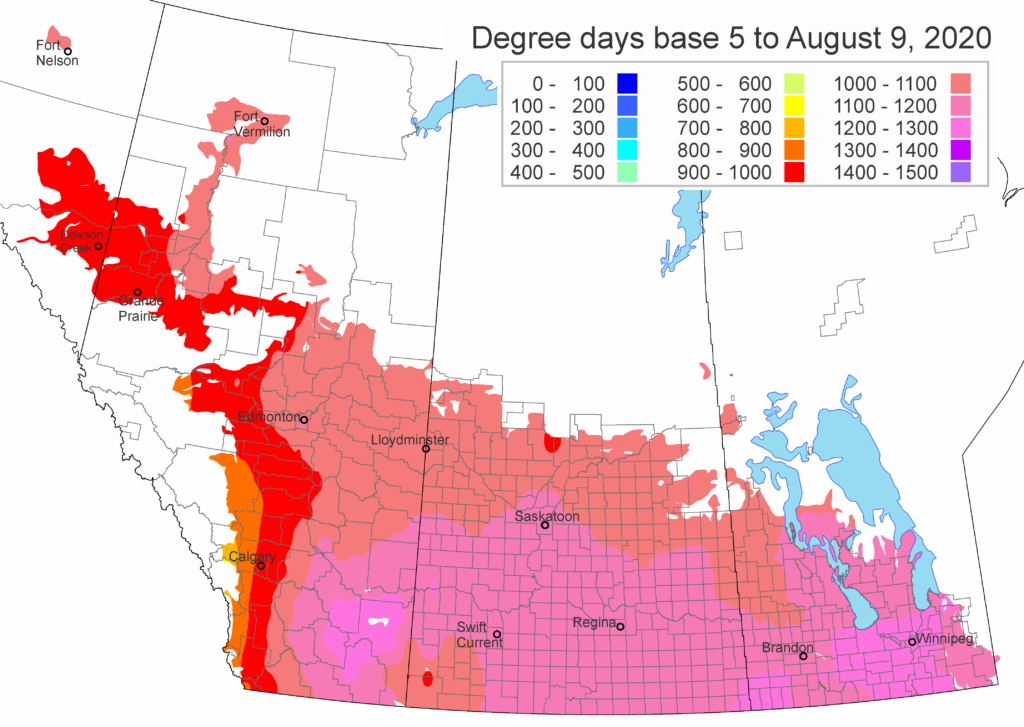
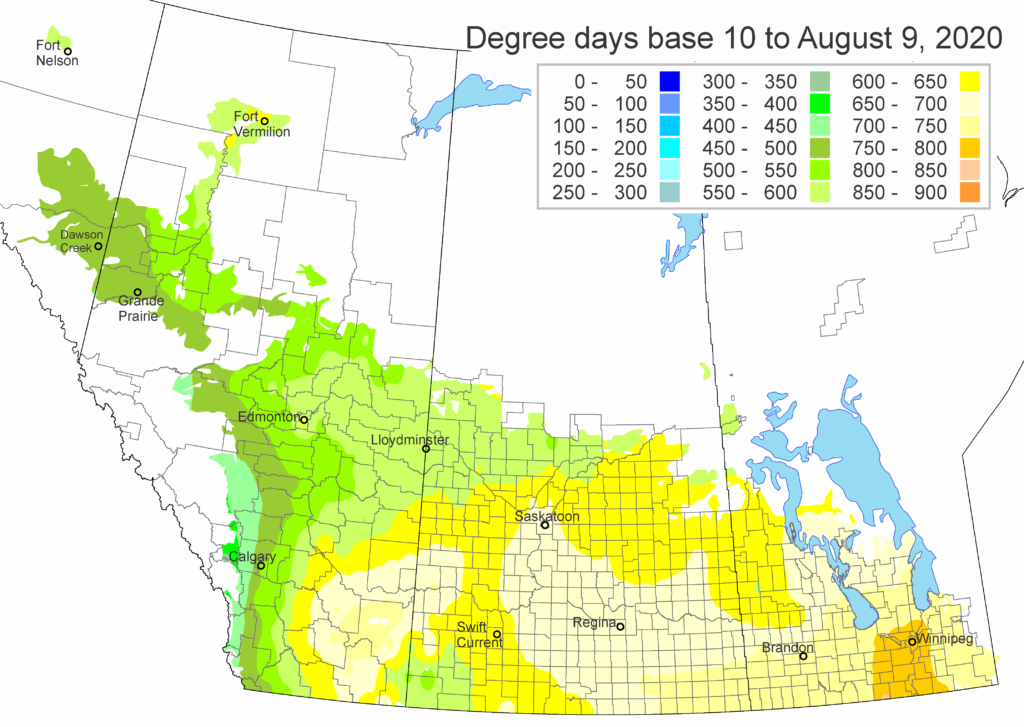
The growing degree day map (GDD) (Base 5 ºC, April 1-August 9, 2020) is below (Fig. 9) while the growing degree day map (GDD) (Base 10 ºC, April 1-August 9, 2020) is shown in Figure 10.
The highest temperatures (°C) observed across the Canadian prairies the past seven days ranged from <17 to >34 °C (Fig. 11) while the lowest temperatures ranged from <-1 to >13 °C (Fig. 12). So far this growing season (as of August 12, 2020), the number of days above 25 °C ranges from 0-10 days in the west (to west of Calgary, west and north of central Alberta and extending into the south and west of the Peace River region) but extends up to 51-60 days in southern Manitoba (Fig. 13).
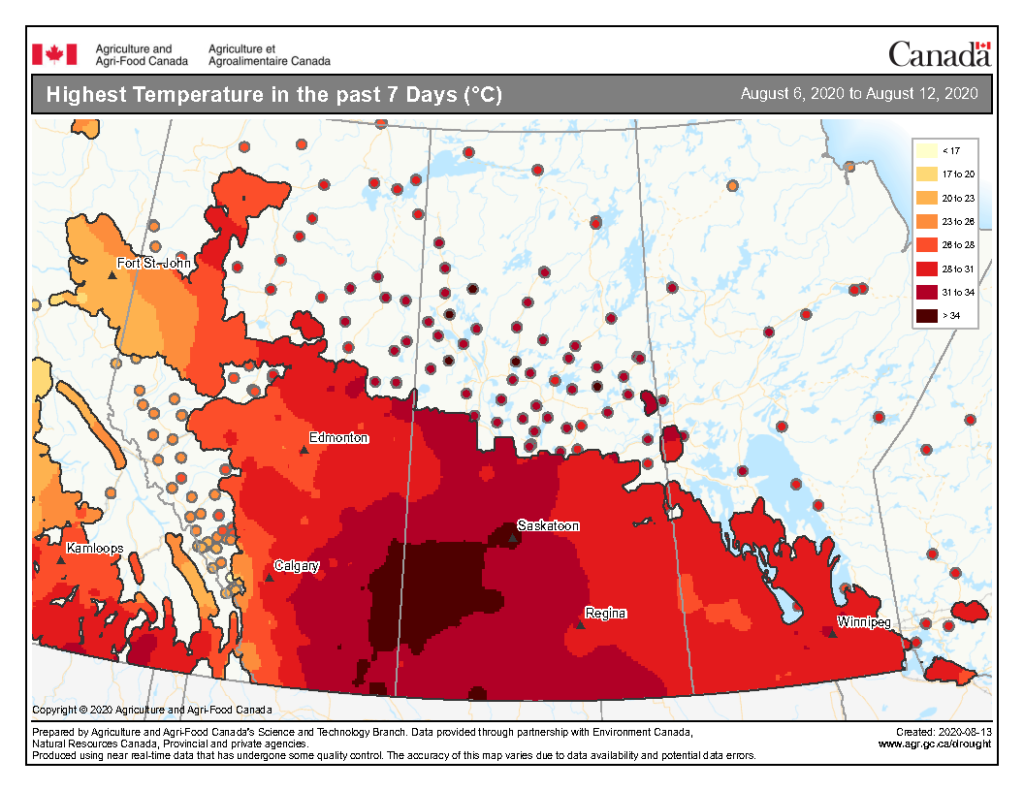
Image has not been reproduced in affiliation with, or with the endorsement of the Government of Canada and was retrieved (13Aug2020). Access the full map at http://www.agr.gc.ca/DW-GS/current-actuelles.jspx?lang=eng&jsEnabled=true&reset=1588297059209
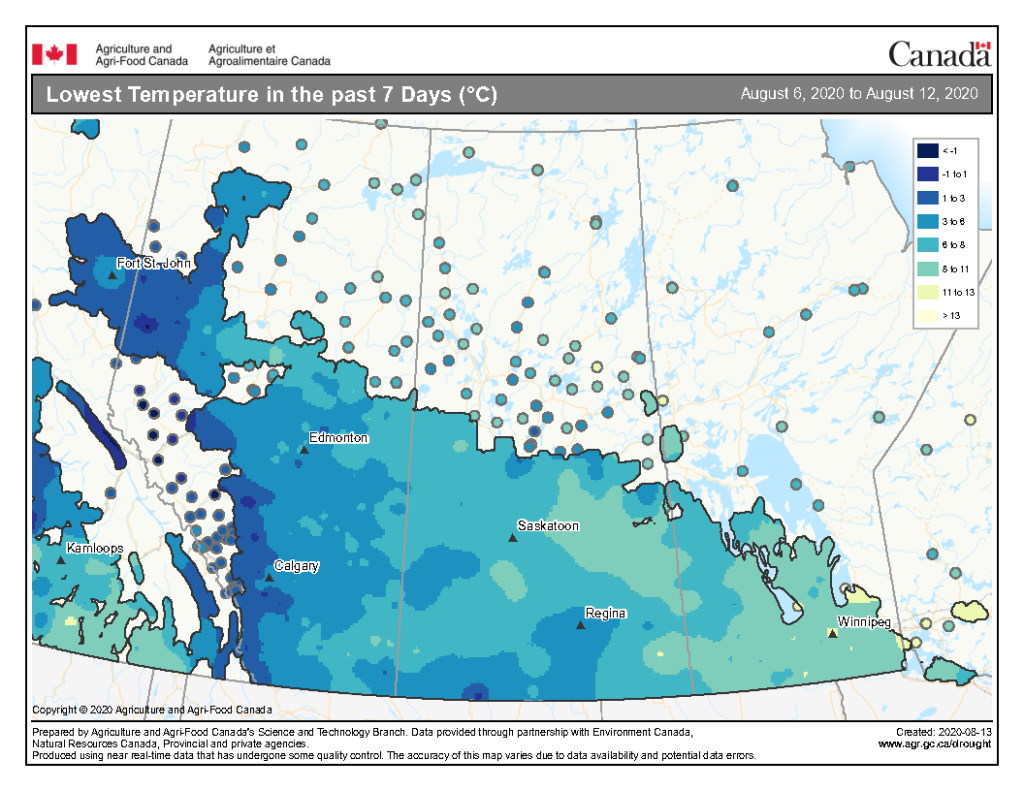
Image has not been reproduced in affiliation with, or with the endorsement of the Government of Canada and was retrieved (13Aug2020). Access the full map at http://www.agr.gc.ca/DW-GS/current-actuelles.jspx?lang=eng&jsEnabled=true&reset=1588297059209
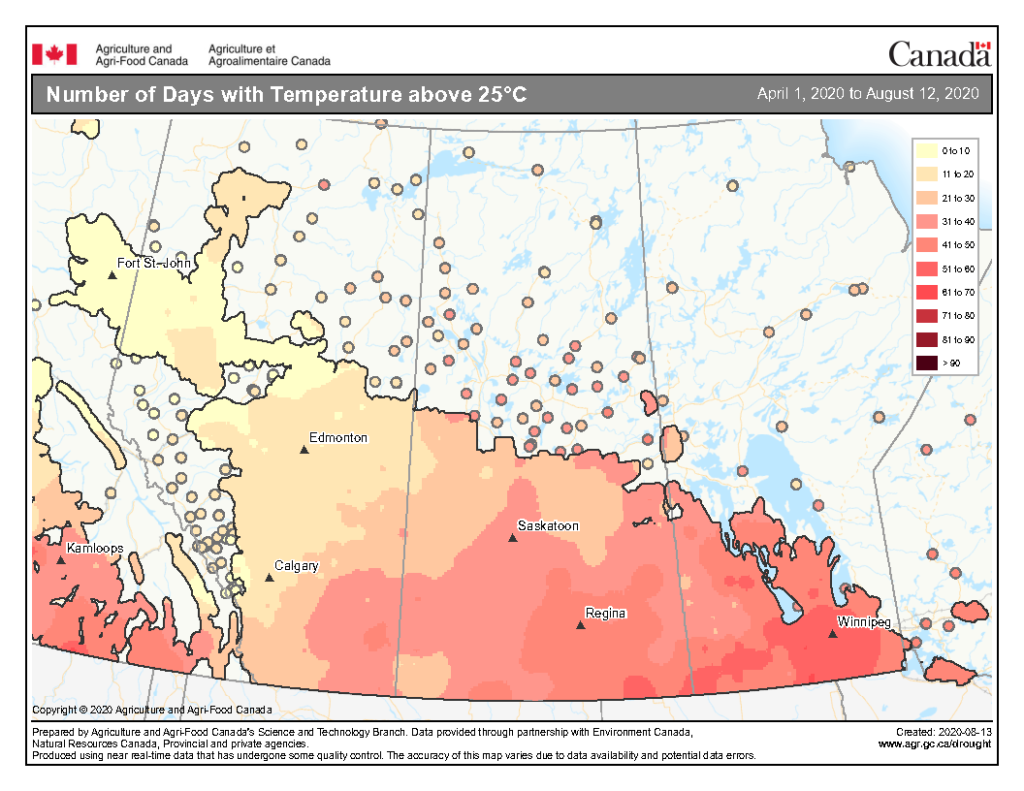
Image has not been reproduced in affiliation with, or with the endorsement of the Government of Canada and was retrieved (13Aug2020). Access the full map at http://www.agr.gc.ca/DW-GS/current-actuelles.jspx?lang=eng&jsEnabled=true&reset=1588297059209
The maps above are all produced by Agriculture and Agri-Food Canada. Growers can bookmark the AAFC Current Conditions Drought Watch Maps for the growing season. Historical weather data can be access at the AAFC Drought Watch website, Environment Canada’s Historical Data website, or your provincial weather network.