Weekly Update

Jennifer Otani, Ross Weiss, David Giffen, Serge Trudel, Kelly Turkington, Erl Svendsen, Jean-Philippe Parent, Julia Mlynarek, Owen Olfert and Meghan Vankosky
Categories
Week 8

Greetings!

Access the complete Weekly Update either as a series of Posts for Week 08 (May 30, 2019) OR a downloadable PDF. Check out the Insect of the Week.

Questions or problems accessing the contents of this Weekly Update?  Please e-mail either Dr. Meghan Vankosky or Jennifer Otani.  Past “Weekly Updates” can be accessed on our Weekly Update page.

Subscribe to the Blog by following these easy steps!

SHARE THIS POST

Weather Synopsis

Ross Weiss and Meghan Vankosky
Categories
Week 8

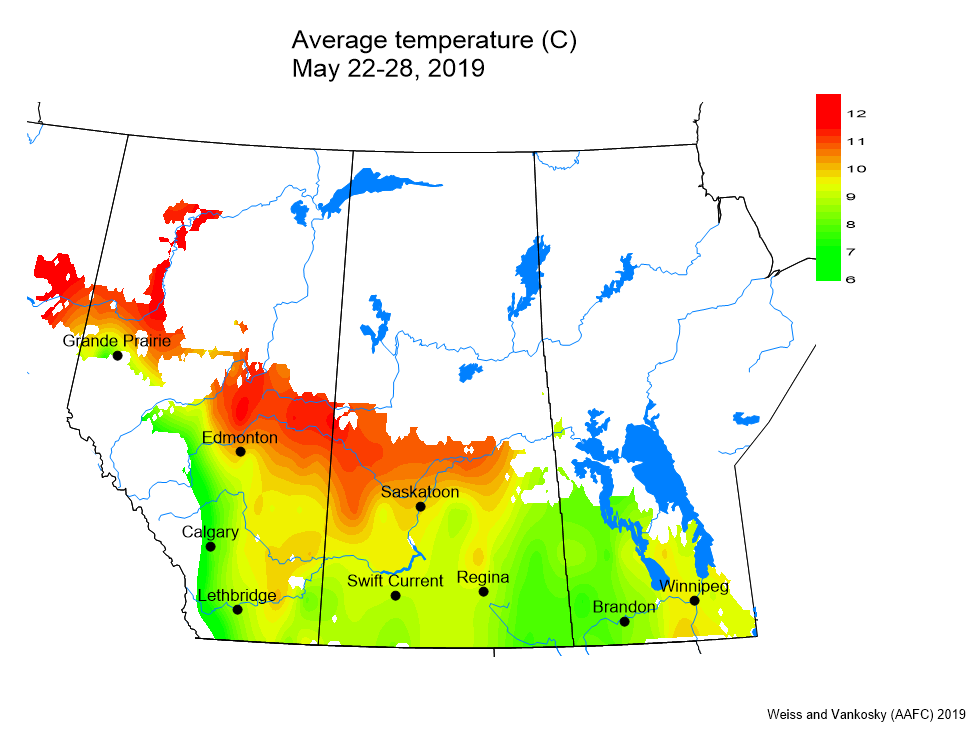
Weather synopsis – This week (May 21-28, 2019) cool, dry conditions continued to occur across the prairies. Though temperatures are warming up, early growing season daily average temperatures continue to be cooler than normal. 

Throughout this past week, the average temperature was approximately 1 °C cooler than normal (Fig. 1).  Compared to last week, the prairie-wide average daily temperature was 3 °C warmer. The warmest temperatures were observed across the Parkland region of the prairies.

Figure 1. Average temperature (°C) across the Canadian prairies the past seven days (May 22-28, 2019).

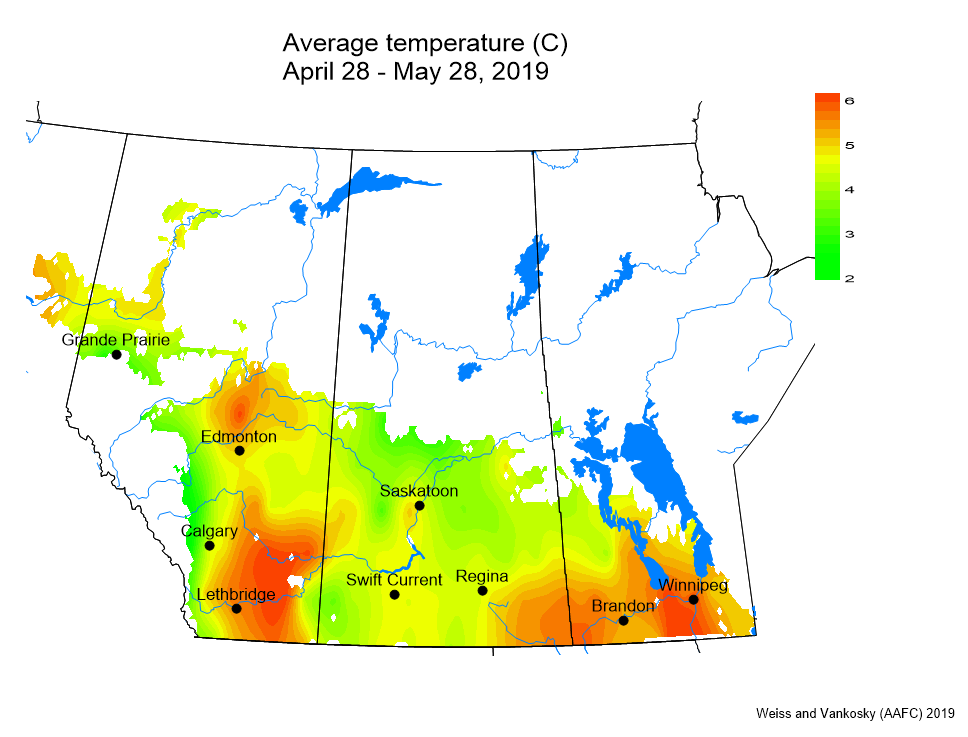
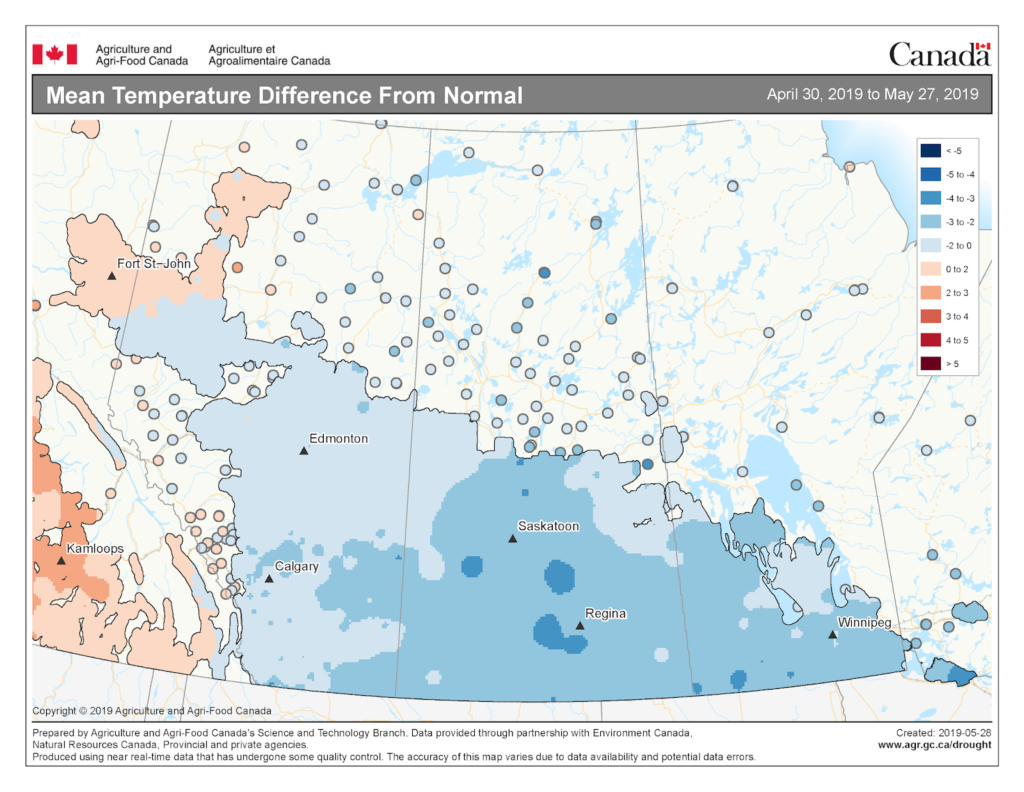
The average 30-day temperatures were approximately 3 °C cooler than average (Fig. 2). 

Figure 2. Average temperature (°C) across the Canadian prairies the past 30 days (April 28-May 28, 2019).

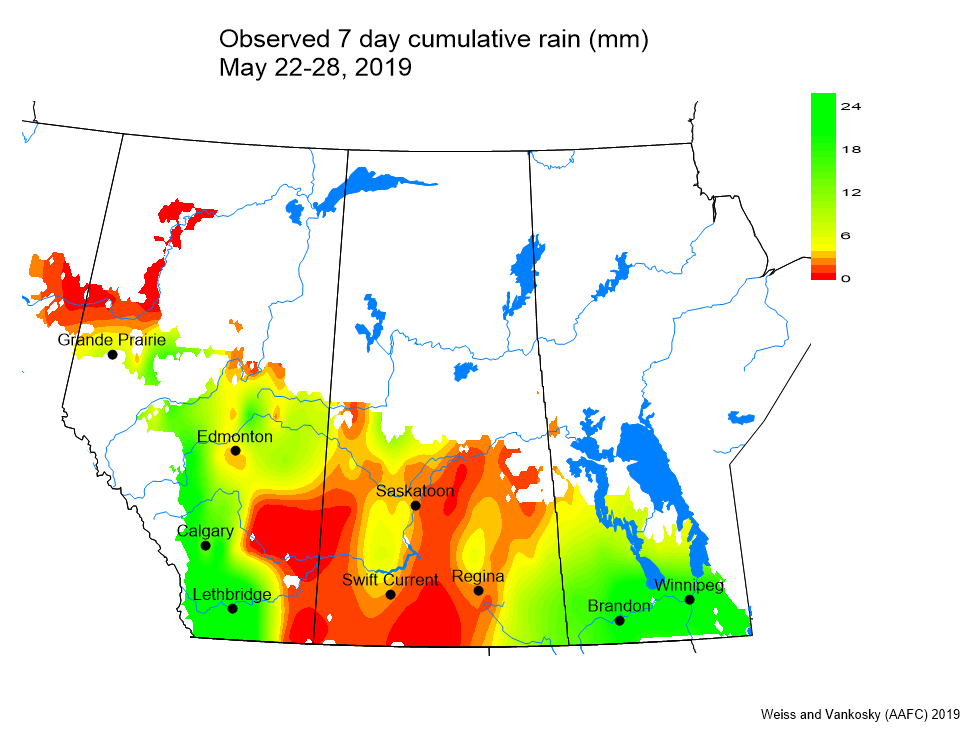
Seven-day cumulative rainfall (Fig. 3) indicated that minimal rain was observed across large areas of SK. Most locations reported less than 5 mm.  Wetter conditions were reported in a corridor between Lethbridge and Calgary AB. Most of MB and southeast SK had rainfall amounts that were greater than 10 mm (Fig. 3). 

Figure 3. Cumulative precipitation observed the past seven days across the Canadian prairies (May 22-28, 2019).
Figure 4. Mean temperature differences from Normal across the Canadian prairies from April 30-May 27, 2019.
Image has not been reproduced in affiliation with, or with the endorsement of the Government of Canada and was retrieved (30May2019). Access the full map at http://www.agr.gc.ca/DW-GS/current-actuelles.jspx?lang=eng&jsEnabled=true

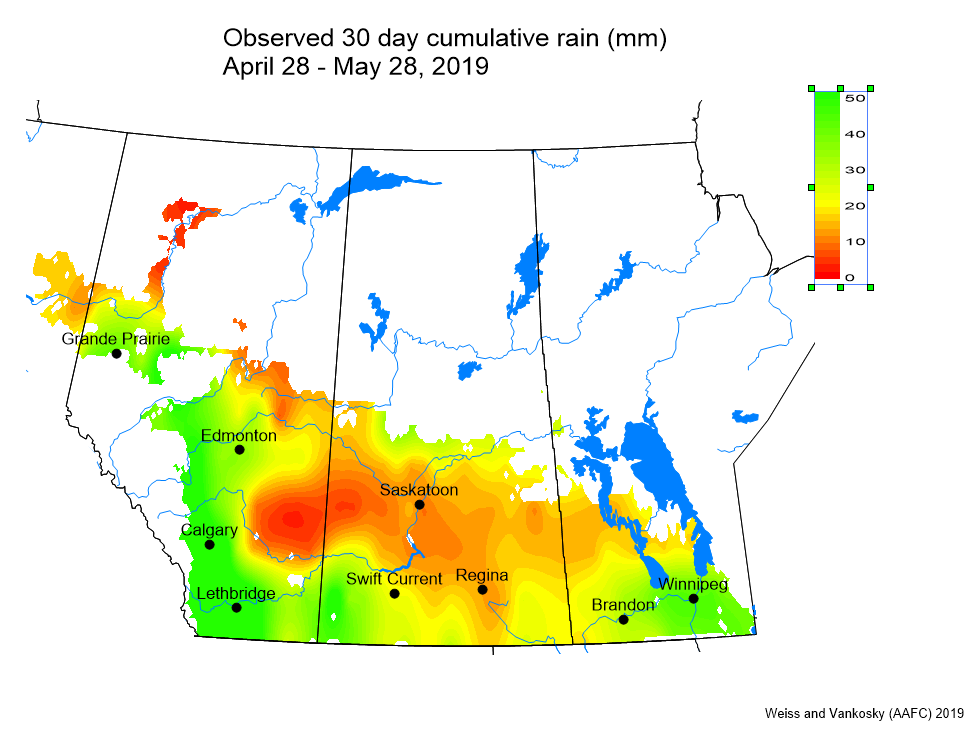
Across the prairies, rainfall amounts for the past 30 days (April 28-May 28, 2019) have been approximately 50% of normal (Fig. 6).  The 30-day rainfall totals have improved in MB and southwest SK.  

Figure 5. Cumulative precipitation observed the past 30 days across the Canadian prairies (April 28-May 28, 2019).

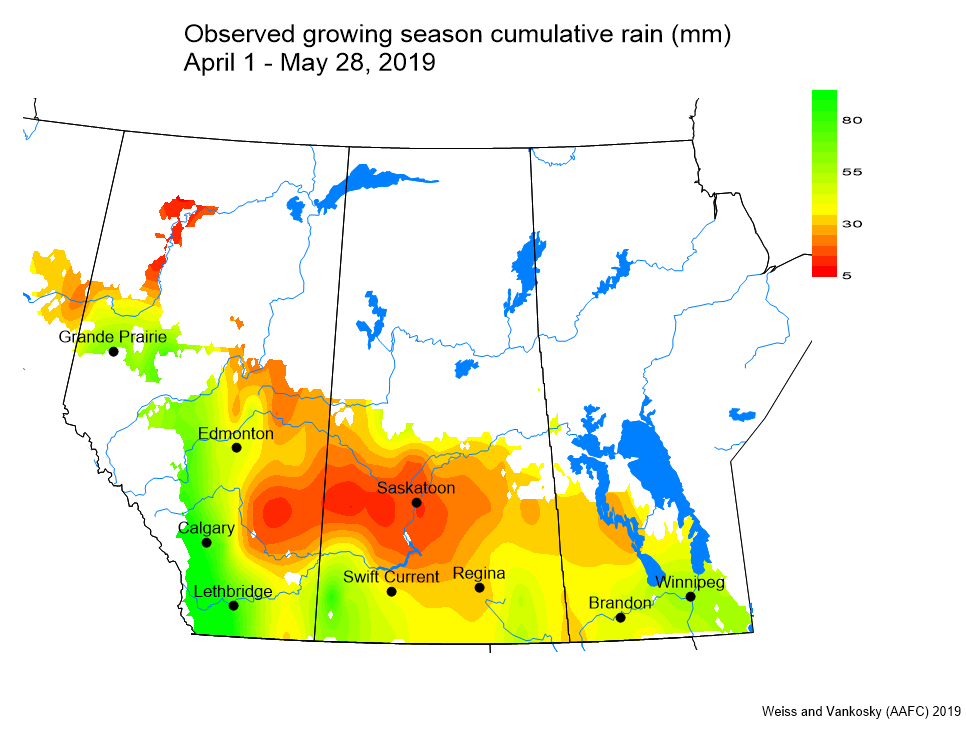
Growing season rainfall (April 1 – May 28) amounts have been well below average for most of the prairies, particularly in west central SK and eastern regions of AB (Fig. 6). 

Figure 6. Cumulative precipitation observed for the growing season across the Canadian prairies (April 1-May 28, 2019).

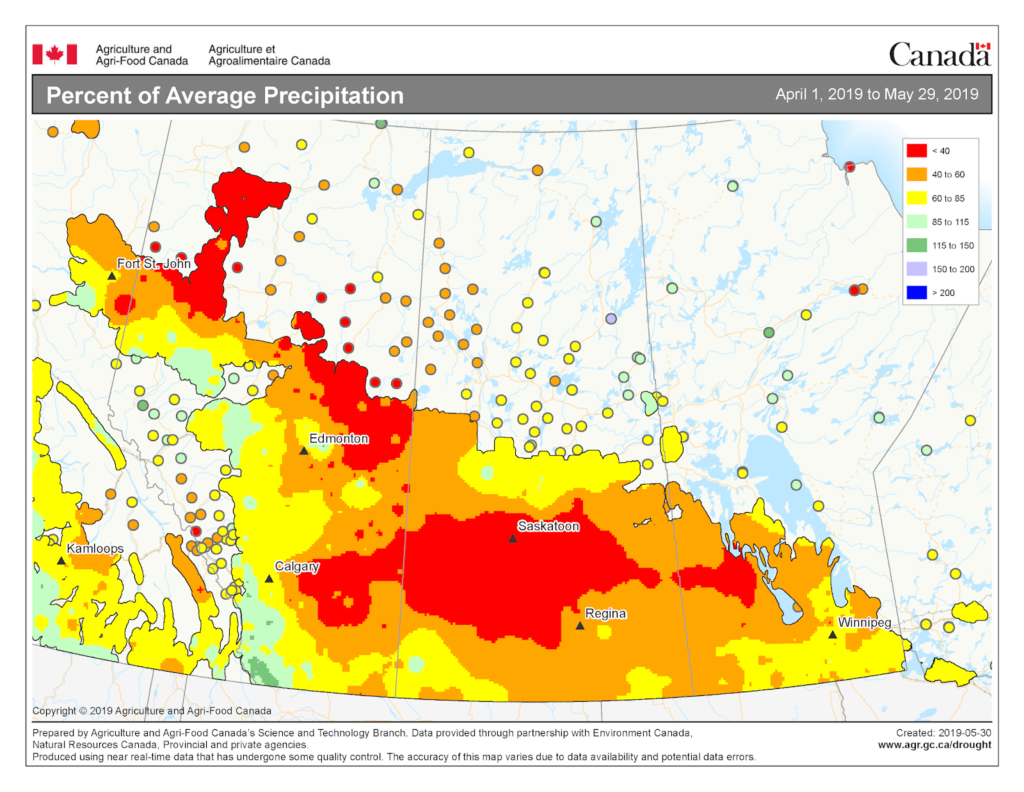
Almost all of the prairies has had growing season rainfall amounting to 85 %, or less, than average. 

Figure 6. Percent of Average precipitation across the Canadian prairies for the growing season (April 1-May 28, 2019).
Image has not been reproduced in affiliation with, or with the endorsement of the Government of Canada and was retrieved (30May2019).  
Access the full map at http://www.agr.gc.ca/DW-GS/current-actuelles.jspx?lang=eng&jsEnabled=true

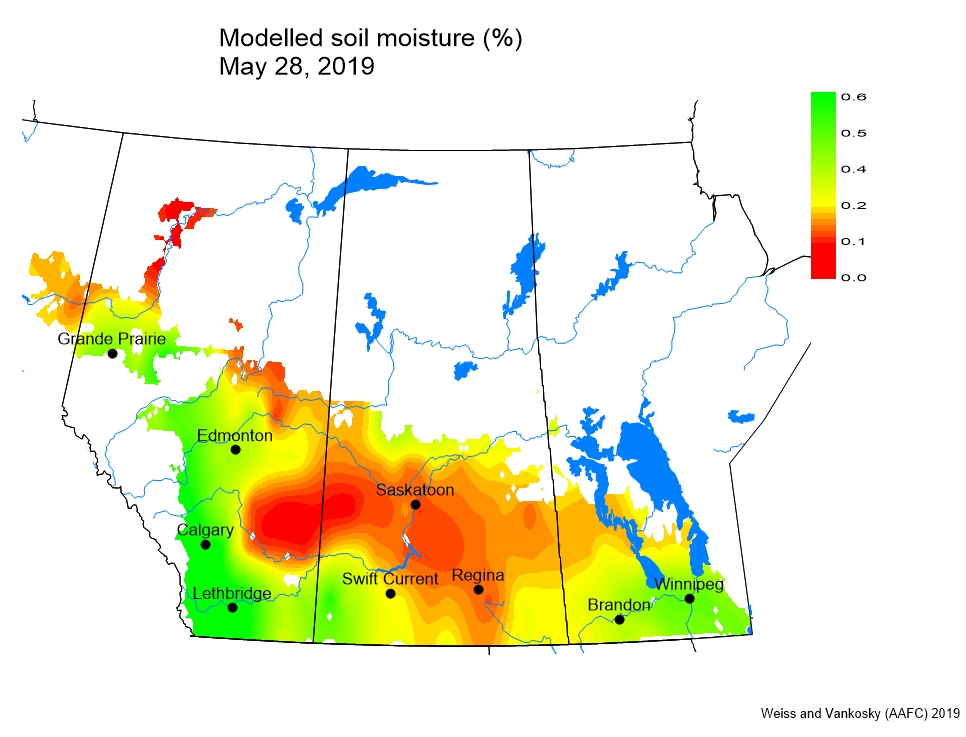
Soil moisture values are low across most of the prairies. 

Figure 7. Modeled soil moisture (%) across the Canadian prairies (up to May 28, 2019).

The two week forecast is not predicting significant rainfall for the prairies. The Agroclimate National Risk Report for May 7 to May 22, 2019 reports that there is less than a 30% chance of rainfall amounting to >25 mm (May 29-June 4, 2019). The report states that “No rain is expected in the week ahead in areas currently experiencing drought conditions such as southwestern Saskatchewan”.

Figure 8. Forecast probability of total precipitation >25 mm for the period of May 29 to June 4, 2019.
Image has not been reproduced in affiliation with, or with the endorsement of the Government of Canada and  was retrieved (30May2019).  
Access the full map at http://www.agr.gc.ca/eng/programs-and-services/drought-watch/agroclimate-national-risk-report-may-7-to-may-22-2019/?id=1556301780170

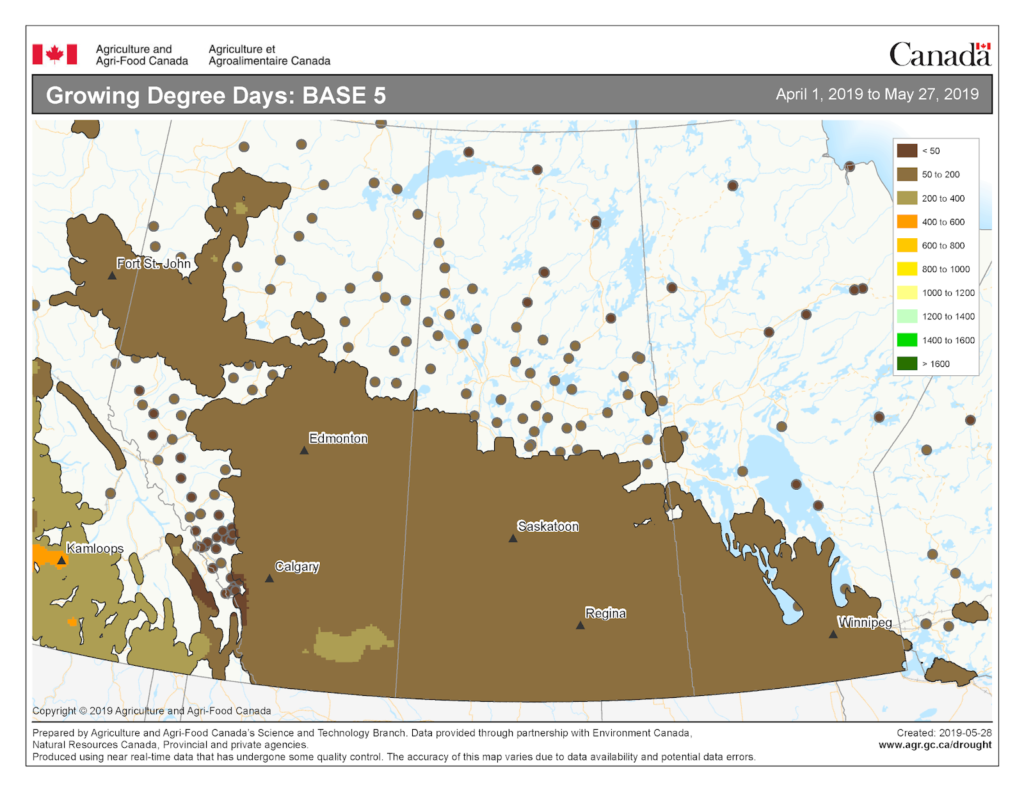
The growing degree day map (GDD) (Base 5 ºC, April 1-May 27, 2019) is below (Fig. 9):

Figure 9. Growing degree day (Base 5 ºC) across the Canadian prairies for the growing season (April 1-May 27, 2019).
Image has not been reproduced in affiliation with, or with the endorsement of the Government of Canada and was retrieved (30May2019).  
Access the full map at http://www.agr.gc.ca/DW-GS/current-actuelles.jspx?lang=eng&jsEnabled=true

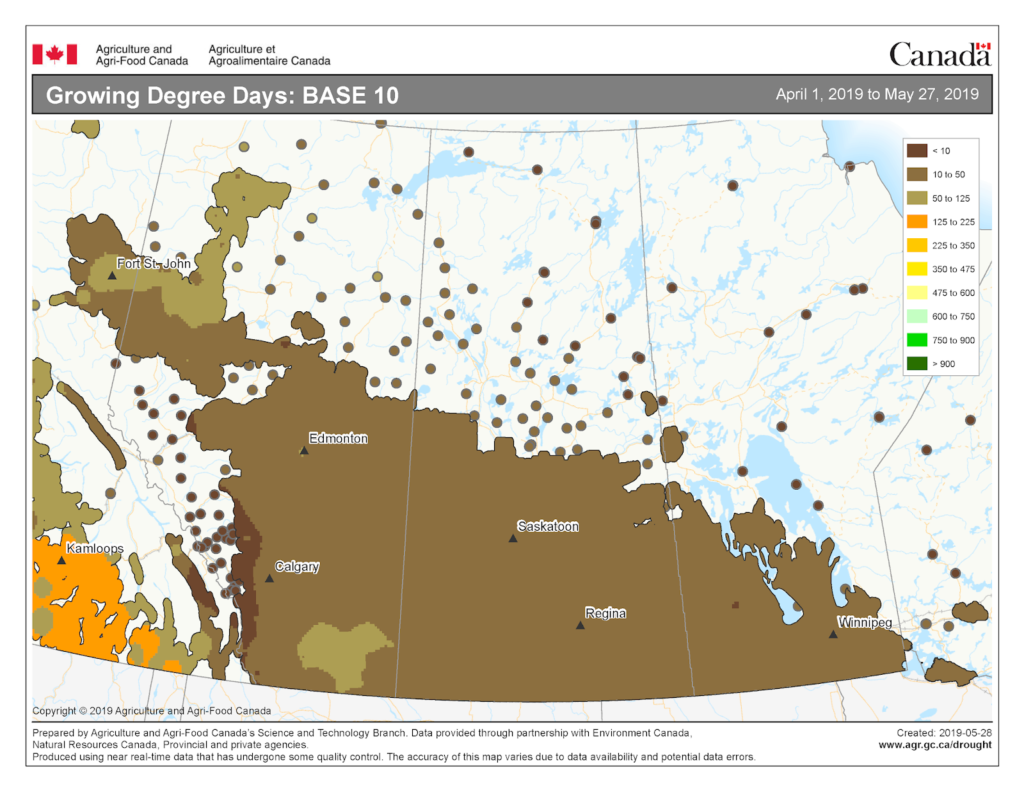
The growing degree day map (GDD) (Base 10 ºC, April 1-May 15, 2019) is below (Fig. 10):

Figure 10. Growing degree day (Base 10 ºC) across the Canadian prairies for the growing season (April 1-May 27, 2019).
Image has not been reproduced in affiliation with, or with the endorsement of the Government of Canada and was retrieved (30May2019).  
Access the full map at http://www.agr.gc.ca/DW-GS/current-actuelles.jspx?lang=eng&jsEnabled=true

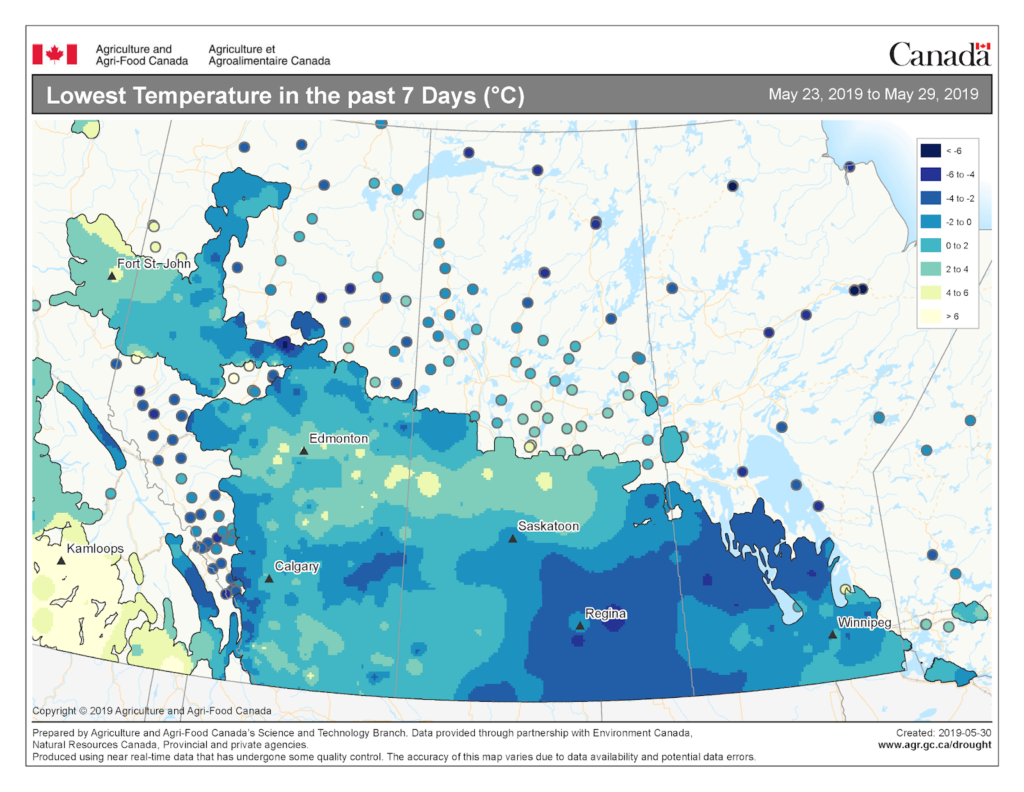
The lowest temperatures (°C) observed the past seven days range from -6 to 6 °C in the map below (Fig. 11).

Figure 11. Lowest temperatures (°C) observed across the Canadian prairies the past seven days (May 23-29, 2019).
Image has not been reproduced in affiliation with, or with the endorsement of the Government of Canada and was retrieved (30May2019).  Access the full map at http://www.agr.gc.ca/DW-GS/current-actuelles.jspx?lang=eng&jsEnabled=true

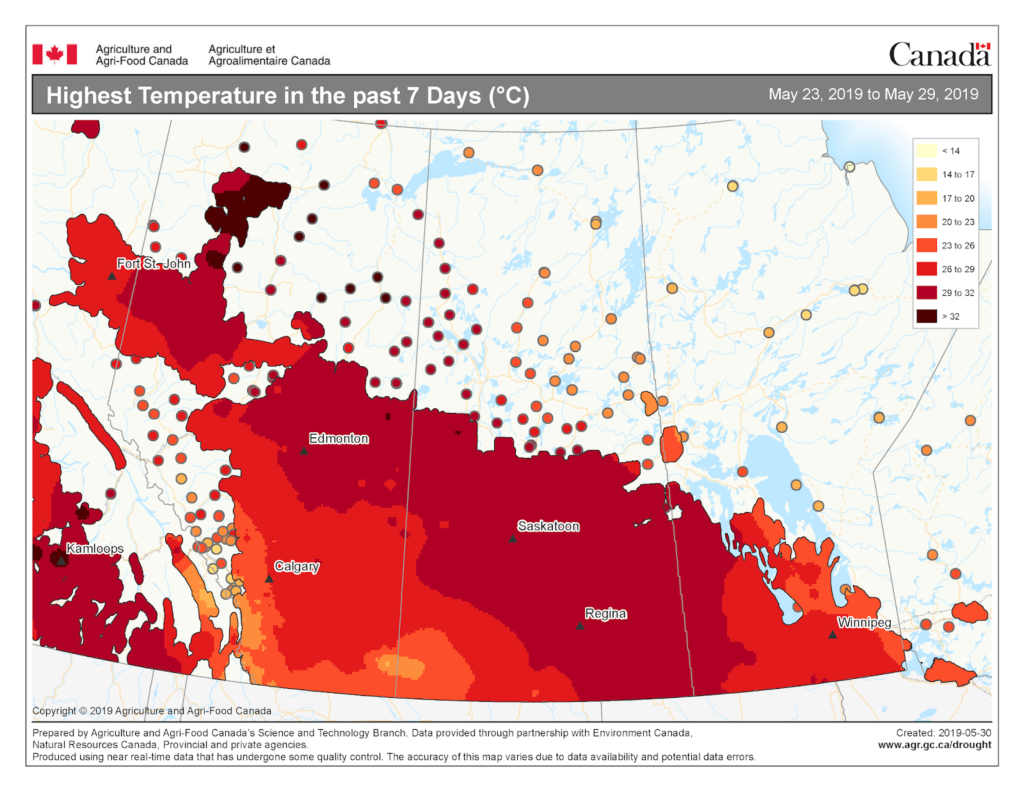
The highest temperatures (°C) observed the past seven days range from 14 to at least 32 °C in the map below (Fig. 12).

Figure 12. Highest temperatures (°C) observed across the Canadian prairies the past seven days (May 23-29, 2019).
Image has not been reproduced in affiliation with, or with the endorsement of the Government of Canada and was retrieved (30May2019).  Access the full map at http://www.agr.gc.ca/DW-GS/current-actuelles.jspx?lang=eng&jsEnabled=true

The maps above are all produced by Agriculture and Agri-Food Canada.  Growers can bookmark the AAFC Drought Watch Maps for the growing season.

SHARE THIS POST

Active Wildfires – Natural Resources Canada

Ross Weiss and prairiepest_admin
Categories
Week 8

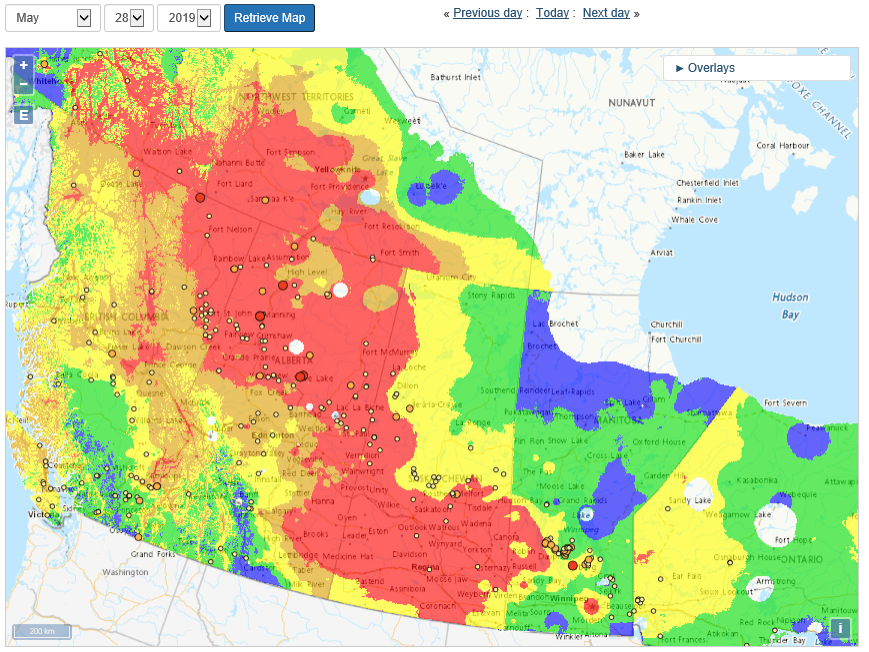
Active Wildfires – Natural Resources Canada posts live interactive maps like the one below (Fig. 1). Access their webpage for more information and to stay current on the various active wildfires burning across Canada.

Figure 1.  Natural Resources Canada’s Canadian Wildland Fire InformationSystem’s Interactive Map (retrieved on 28May2019 from http://cwfis.cfs.nrcan.gc.ca/interactive-map )

Access the following wildfire maps:

SHARE THIS POST

Wind Trajectories

Ross Weiss, Serge Trudel, David Giffen and Meghan Vankosky
Categories
Week 8

Agriculture and Agri-Food Canada (AAFC) and Environment and Climate Change Canada (ECCC) have been working together to study the potential of trajectories for monitoring insect movements since the late 1990s.

In a continuing effort to produce timely information, the wind trajectory reports are available in two forms:

SHARE THIS POST

Prairie Crop Disease Monitoring Network

Kelly Turkington and prairiepest_admin
Categories
Week 8

The Prairie Crop Disease Monitoring Network (PCDMN) represents the combined effort of our prairie pathologists who work together to support in-field disease management in field crops.  

In 2019, the PCDMN will release a series of weekly Cereal Rust Risk Reports throughout May and June.  Information related to trajectory events based on forecast and diagnostic wind fields and cereal rust risk is experimental, and is OFFERED TO THE PUBLIC FOR INFORMATIONAL PURPOSES ONLY. 

Background:  Agriculture and AgriFood Canada (AAFC) and Environment and Climate Change Canada (ECCC) have been working together to study the potential of trajectories for monitoring insect movements since the late 1990s. Trajectory models are used to deliver an early-warning system for the origin and destination of migratory invasive species, such as diamondback moth. In addition, plant pathologists have shown that trajectories can assist with the prediction of plant disease infestations and are also beginning to utilize these same data. An introduction will be presented of efforts to identify wind trajectory events that may bring rust urediniospores into Western Canada from epidemic areas in the central and Pacific northwest (PNW) regions of the USA. Identification of potential events as well as an assessment of epidemic severity from source locations, and prairie weather conditions, will be used to assess the need for prompt targeted crop scouting for at-risk regions of the Canadian Prairies.

This week, two documents are available from the PCDMN:

Synopsis of May 21-27, 2019, Weekly Cereal Rust Risk Report: 

1. Pacific Northwest – Given limited stripe rust development in the PNW, a low number of recent wind trajectories from the PNW, cool and relatively dry Prairie weather conditions, and generally early stages of Prairie crop development, as of May 27, 2019, the risk of stripe rust appearance from the PNW is limited and scouting for this disease is not urgent.

2. Texas-Oklahoma corridor – Although leaf and stripe rust development continues in this corridor, especially Oklahoma, the disease is mainly affecting the lower canopy at generally low levels.  In addition, crops are advancing towards maturity and thus will become less of a source of rust inoculum.  There have been a low number of recent wind trajectories from this area, cool and relatively dry Prairie weather conditions, and generally early stages of Prairie crop development.  Thus, as of May 27, 2019 the risk of leaf and stripe rust appearance from the Texas-Oklahoma corridor is low and scouting for these diseases is not urgent.

3. Kansas-Nebraska corridor – Although leaf and stripe rust development continues in Kansas, it is at low-moderate levels and mainly in the middle portions of crop canopies.  There have been a low-moderate number of recent wind trajectories from this area, cool and relatively dry Prairie weather conditions, and generally early stages of Prairie crop development.  Thus, as of May 27, 2019 the risk of leaf and stripe rust appearance from the Kansas-Nebraska corridor is low and scouting for these diseases is not urgent, but further development of rust in these regions may increase the risk. 

4. Where farmers or consultants noticed stripe rust development on winter wheat in the fall of 2018, it is recommended to scout winter wheat fields that have resumed growth this spring.  Scouting is especially critical where the variety being grown is susceptible to stripe rust.  Currently, there are no early spring reports of stripe rust on winter wheat.

5.  Access the full downloadable report.

SHARE THIS POST

Predicted grasshopper development

Ross Weiss and Meghan Vankosky
Categories
Week 8

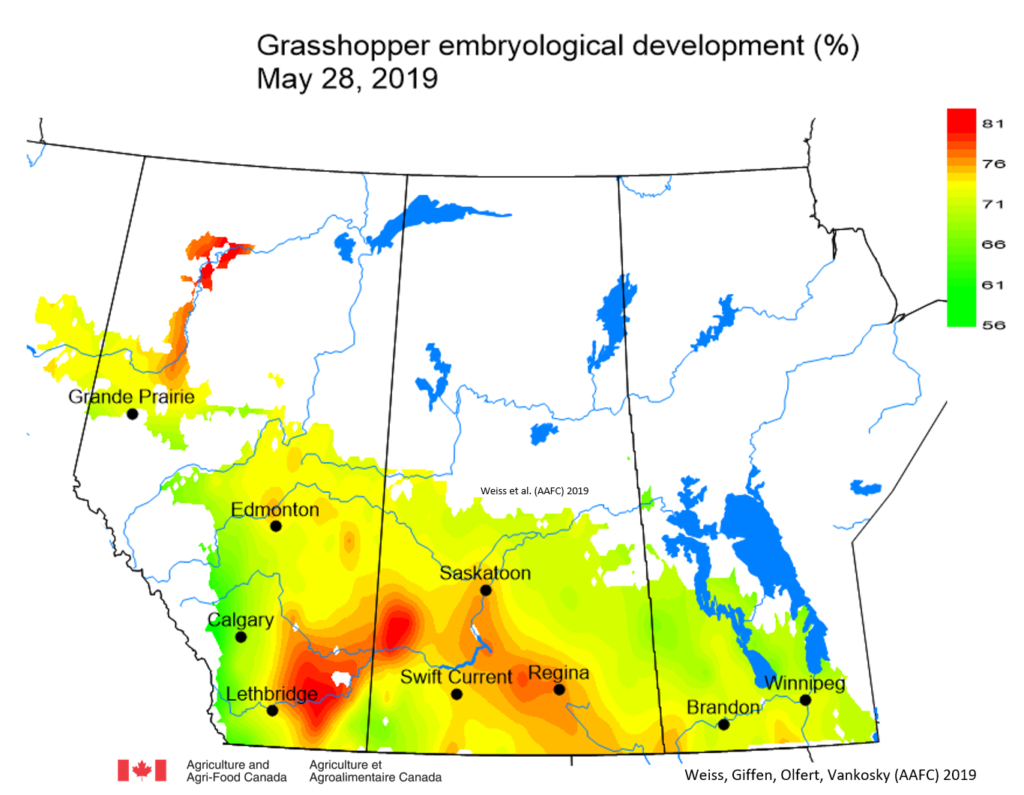
Grasshopper Simulation Model Output – The grasshopper simulation model will be used to monitor grasshopper development across the prairies. Weekly temperature data collected across the prairies is incorporated into the simulation model which calculates estimates of grasshopper development stages based on biological parameters for Melanoplus sanguinipes (Migratory grasshopper).  

As of May 28, 2019, predicted grasshopper egg development was 72% (66% last week) and is similar to long term average values (75%) (Fig. 1).  Across the prairies, the grasshopper hatch is just beginning with most locations having less than 5% hatch. 

Figure 1. Predicted grasshopper (Melanoplus sanguinipes) embryological development across the Canadian prairies as of May 28, 2019. 
Figure 2. Predicted percent of grasshopper (Melanoplus sanguinipes) population at first instar stage across the Canadian prairies (as of May 28, 2019). 

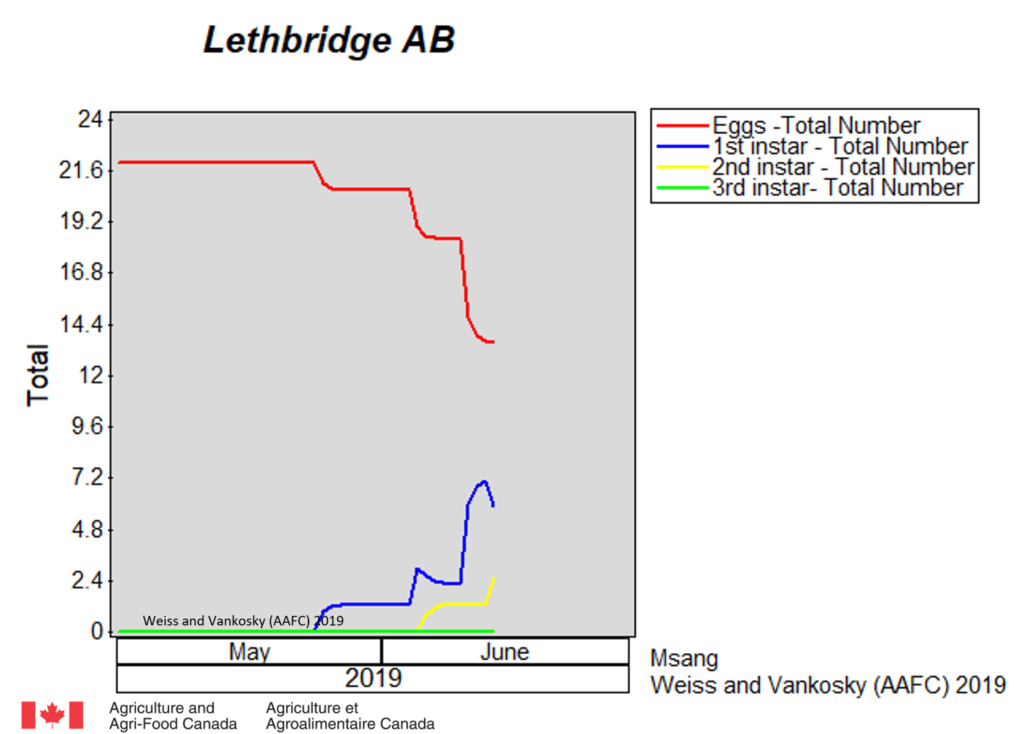
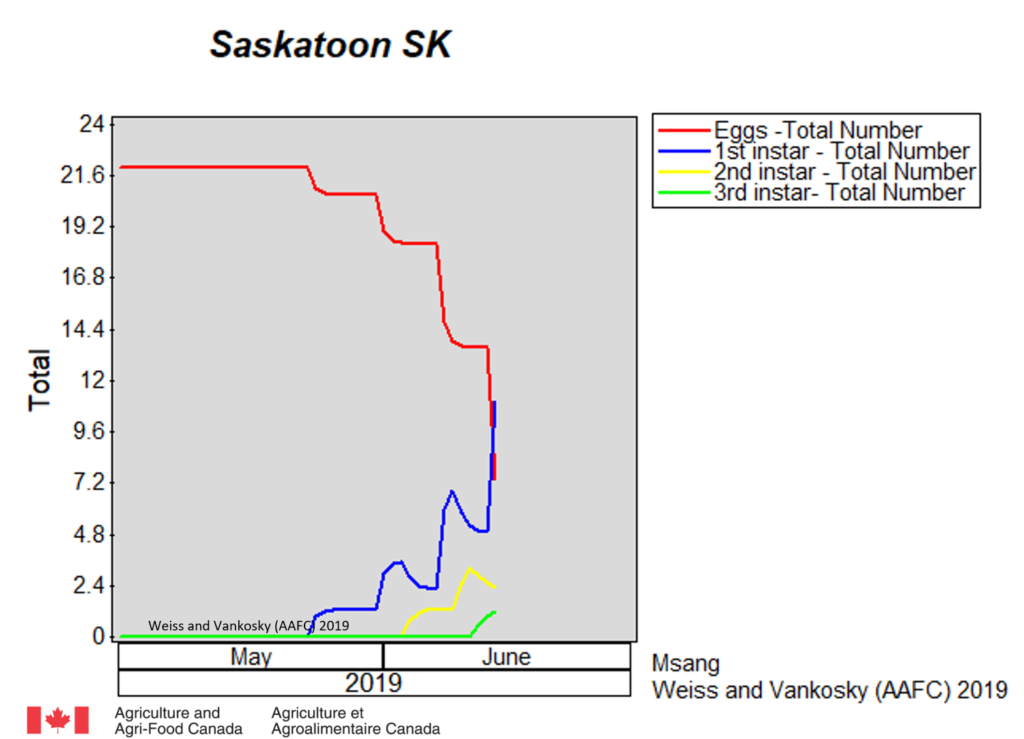
Model runs for Grande Prairie (Fig. 3), Lethbridge (Fig. 4) and Saskatoon (Fig. 5) were projected to June 15, 2019. Results for Lethbridge and Saskatoon indicated that second instars will begin to appear next week. Hatch in near Grande Prairie is  predicted to be approximately one week later.  Development is predicted to be more advanced in northern areas of the Peace River region. 

Figure 3. Predicted status of Melanoplus sanguinipes populations near Grande Prairie AB as of  May 28, 2019.  
Figure 4. Predicted status of Melanoplus sanguinipes populations near Lethbridge AB as of  May 28, 2019.  
Figure 5. Predicted status of Melanoplus sanguinipes populations near Saskatoon SK as of  May 28, 2019.  

This week we surveyed roadsides south of Saskatoon. Though counts were low, melanoplines were primarily first with a few second instars. Slant faced grasshoppers were most abundant, particularly Aeropedellus clavatus.

Biological and monitoring information related to grasshoppers in field crops is posted by Manitoba AgricultureSaskatchewan AgricultureAlberta Agriculture and Forestry, the BC Ministry of Agriculture and the Prairie Pest Monitoring Network.  Also refer to the grasshopper pages within the new “Field Crop and Forage Pests and their Natural Enemies in Western Canada: Identification and management field guide” as an English-enhanced or French-enhanced version.

SHARE THIS POST

Pea leaf weevil

Ross Weiss and Meghan Vankosky
Categories
Week 8

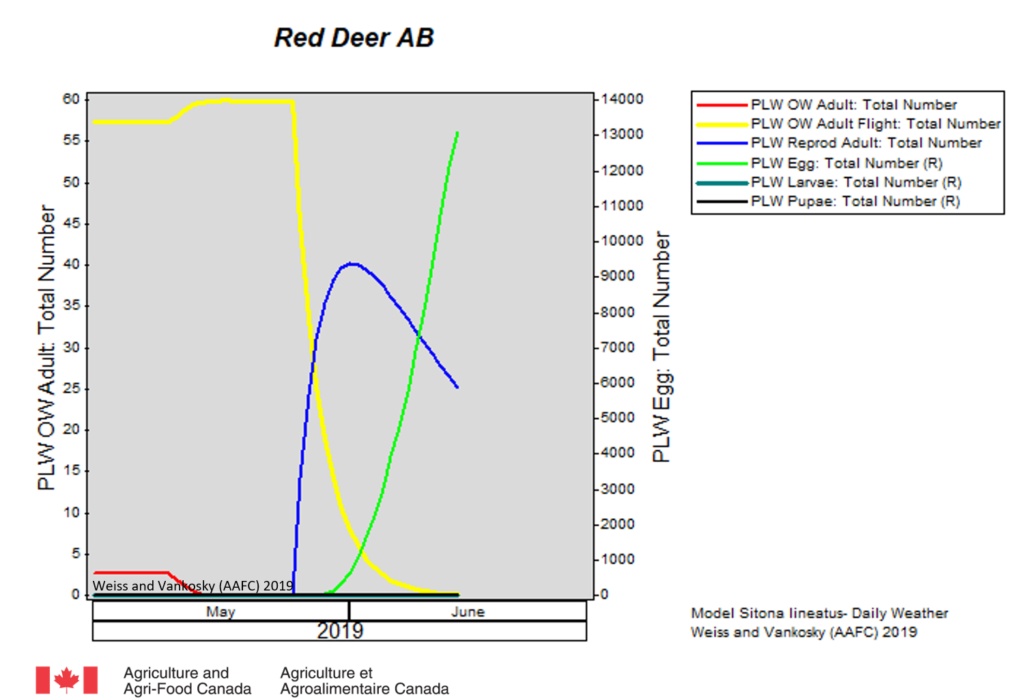
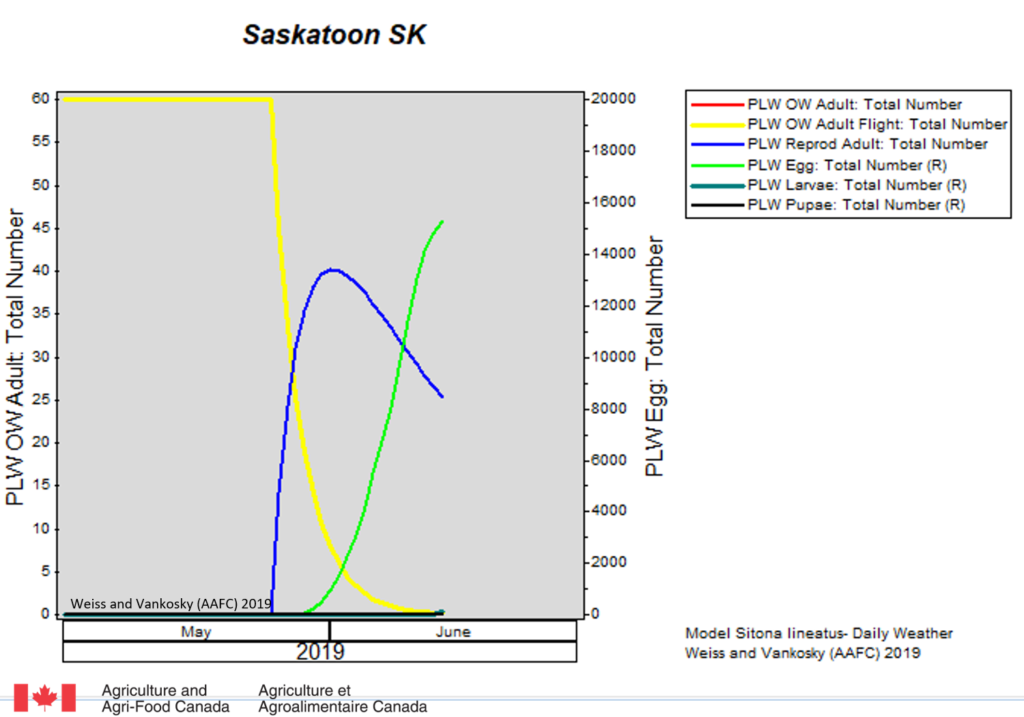
Pea Leaf Weevil (Sitona lineatus– Model runs for Red Deer AB (Fig. 1) and Swift Current SK (Fig. 2) were projected to June 15, 2019. Results indicated that oviposition should begin early next week. Model predictions, based on long term normal weather data predict that initial hatch near Saskatoon should occur on May 29th.

Figure 1. Projected predicted status of pea leaf weevil populations near Red Deer AB to
June 15, 2019 using long term average temperatures.
Figure 2. Projected predicted status of pea leaf weevil populations near Swift Current SK to
June 15, 2019 using long term average temperatures.

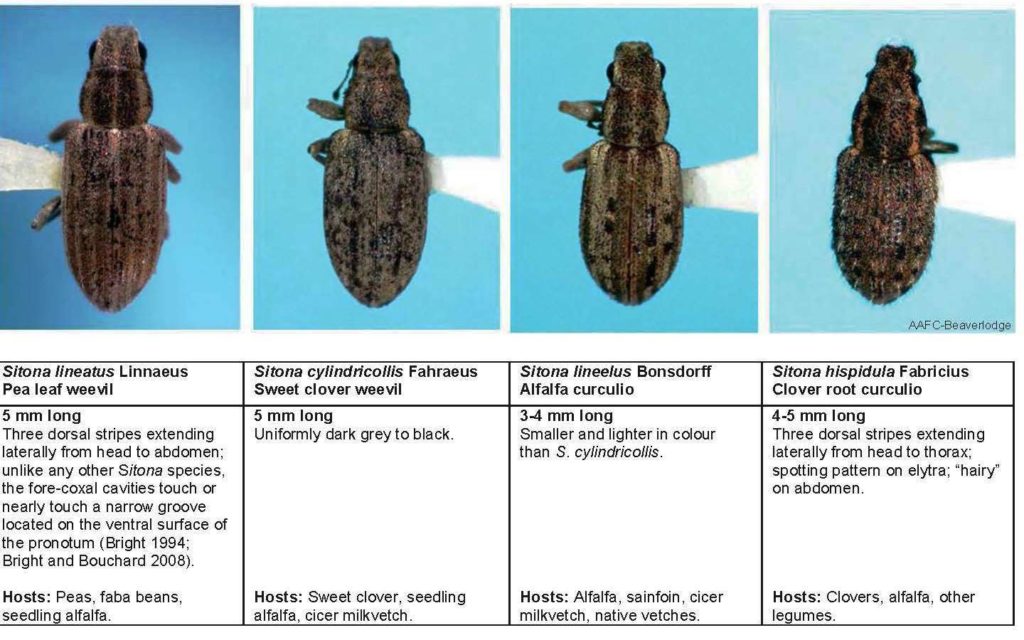
Pea leaf weevils emerge in the spring primarily by flying (at temperatures above 17ºC) or they may walk short distances. Pea leaf weevil movement into peas and faba beans is achieved primarily through flight.  Adults are slender, greyish-brown measuring approximately 5 mm in length (Fig. 3, Left).  
The pea leaf weevil resembles the sweet clover weevil (Sitona cylindricollis) but the former is distinguished by three light-coloured stripes extending length-wise down thorax and sometimes the abdomen.  All species of Sitona, including the pea leaf weevil, have a short snout.  

Figure 3.  Comparison images and descriptions of four Sitona species adults including pea leaf weevil (Left).

Adults will feed upon the leaf margins and growing points of legume seedlings (alfalfa, clover, dry beans, faba beans, peas) and produce a characteristic, scalloped (notched) edge.  Females lay 1000 to 1500 eggs in the soil either near or on developing pea or faba bean plants from May to June.

Biological and monitoring information related to pea leaf weevil in field crops is posted by the province of Alberta and in the PPMN monitoring protocol.

Also refer to the pea leaf weevil page within the “Field Crop and Forage Pests and their Natural Enemies in Western Canada: Identification and management field guide” – both English-enhanced or French-enhanced versions are available.  A review of this insect was published in 2011 in Prairie Soils and Crops by Carcamo and Vankosky.

SHARE THIS POST

Cereal leaf beetle

Ross Weiss and Meghan Vankosky
Categories
Week 8

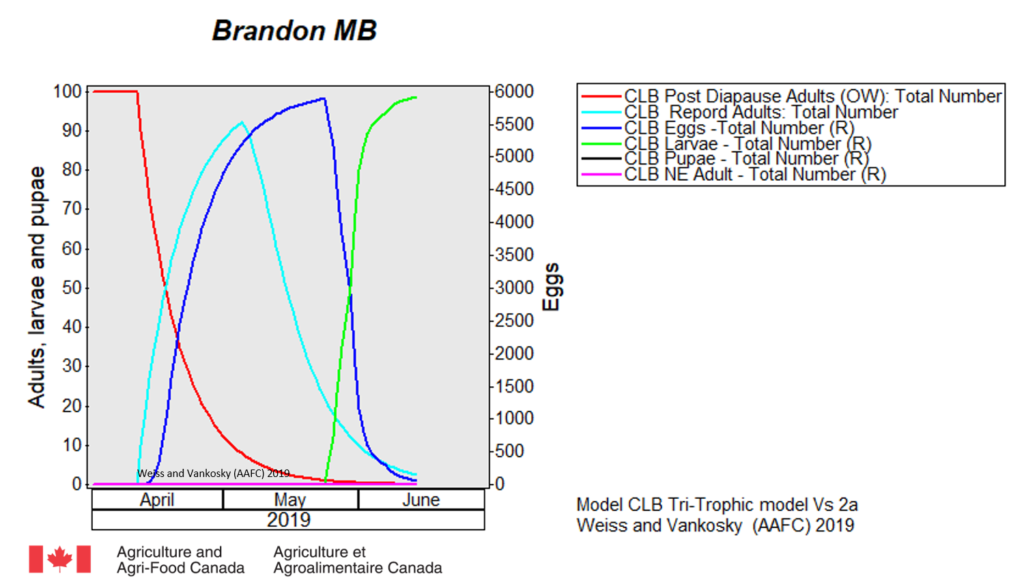
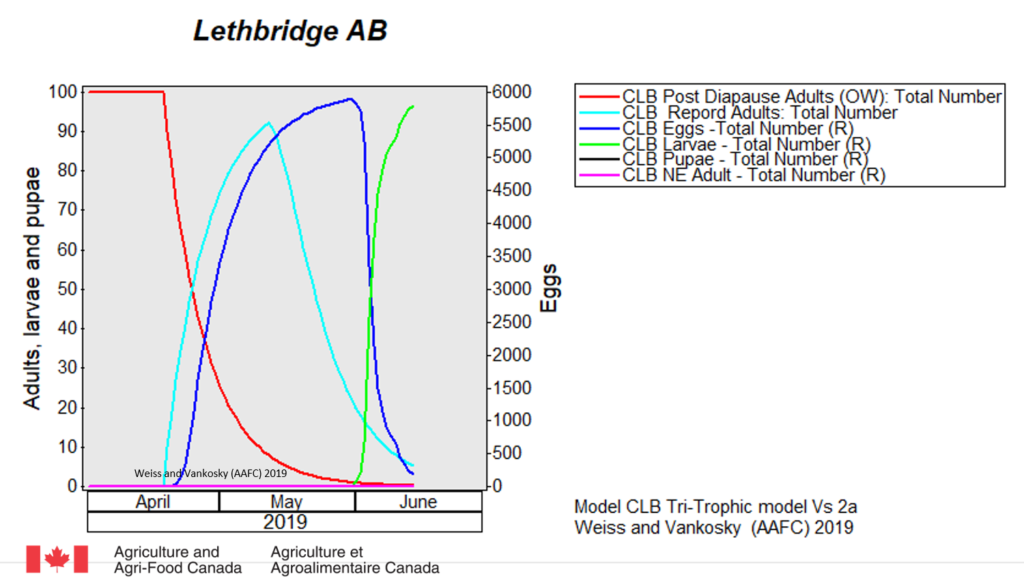
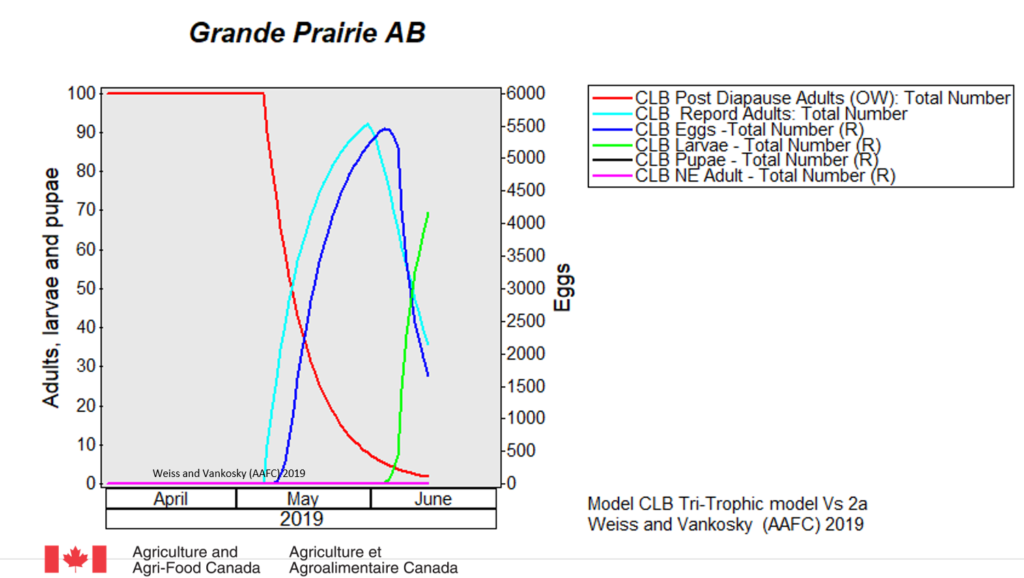
Cereal leaf beetle (Oulema melanopus) – The CLB model was run for Brandon MB (Fig. 1), Lethbridge AB (Fig. 2), Grande Prairie AB (Fig. 3) and projected to June 15, 2019.  The cereal leaf beetle model indicates that eggs may begin to hatch later next week in Brandon (Fig. 1) and Lethbridge (Fig. 3). Hatch is predicted to be 4-7 days later in the Peace River region (Fig. 3).

Figure 1. Projected predicted status of cereal leaf beetle populations near Lethbridge AB to June 15, 2019,generated using long term average temperatures.
Figure 2. Projected predicted status of cereal leaf beetle populations near Brandon MB to June 15, 2019,generated using long term average temperatures.
Figure 3. Projected predicted status of cereal leaf beetle populations near Grande Prairie AB to June 15, 2019, generated using long term average temperatures.
 

Lifecycle and Damage:

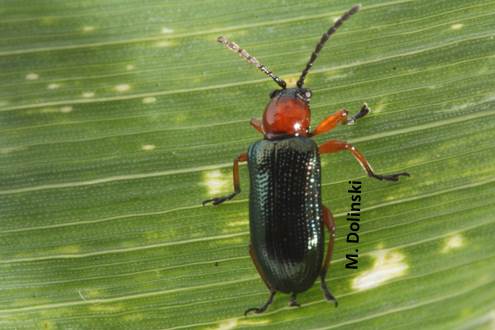
Adult: Adult cereal leaf beetles (CLB) have shiny bluish-black wing-covers (Fig. 2). The thorax and legs are light orange-brown. Females (4.9 to 5.5 mm) are slightly larger than the males (4.4 to 5 mm). Adult beetles overwinter in and along the margins of grain fields in protected places such as in straw stubble, under crop and leaf litter, and in the crevices of tree bark. They favour sites adjacent to shelter belts, deciduous and conifer forests. They emerge in the spring once temperature reaches 10-15 ºC and are active for about 6 weeks. They usually begin feeding on grasses, then move into winter cereals and later into spring cereals.  

Figure 2. Adult Oulema melanopus measure 4.4-5.5 mm long (Photo: M. Dolinski).

Egg: Eggs are laid approximately 14 days following the emergence of the adults. Eggs are laid singly or in pairs along the mid vein on the upper side of the leaf and are cylindrical, measuring 0.9 mm by 0.4 mm, and yellowish in colour. Eggs darken to black just before hatching.  

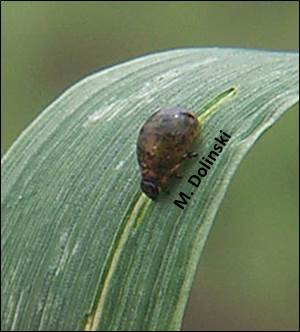
Larva: The larvae hatch in about 5 days and feed for about 3 weeks, passing through 4 growth stages (instars). The head and legs are brownish-black; the body is yellowish. Larvae are usually covered with a secretion of mucus and fecal material, giving them a shiny black, wet appearance (Fig. 3).  When the larva completes its growth, it drops to the ground and pupates in the soil. 

Figure 3.  Larval stage of Oulema melanopus with characteristic feeding damage visible on leaf (Photo: M. Dolinski).

Pupa: Pupal colour varies from a bright yellow when it is first formed, to the colour of the adult just before emergence. The pupal stage lasts 2 – 3 weeks. Adult beetles emerge and feed for a couple of weeks before seeking overwintering sites. There is one generation per year.

Fact sheets for CLB are published by the province of Alberta and available from the Prairie Pest Monitoring Network. Also access the Oulema melanopus page from the new “Field crop and forage pests and their natural enemies in western Canada – Identification and management field guide”.

SHARE THIS POST

Alfalfa weevil

Ross Weiss and Meghan Vankosky
Categories
Week 8

Alfalfa Weevil (Hypera postica) – Degree-day maps of base 9°C are produced using the Harcourt/North Dakota models (Soroka et al. 2015).  Models predicting the development of Alfalfa weevil (AAW) across the prairies are updated weekly to help growers time their in-field scouting for second-instar larvae. 

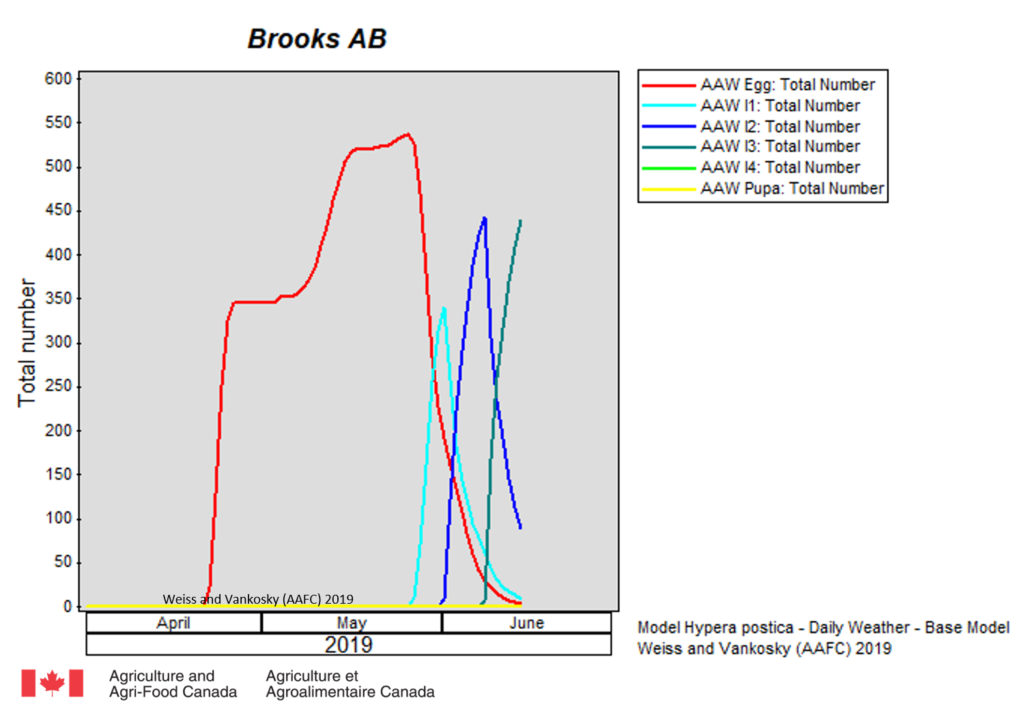
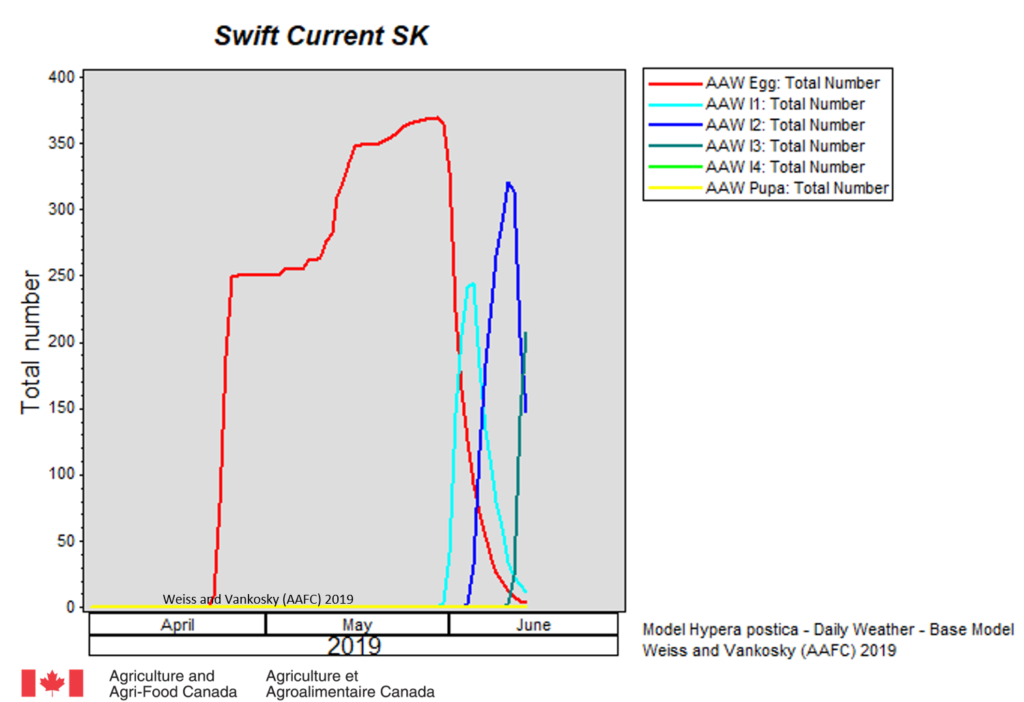
Model runs for Brooks AB and Swift Current SK were projected to June 15, 2019.  The model runs indicate that second instar AAW should begin to appear over the next few days.  Third instar larvae are predicted to occur one week later. The warm weather over the next few days may speed up development.

Figure 1. Projected predicted status of alfalfa weevil populations near Brooks AB to June 15, 2019,using long term average temperatures.
Figure 2. Projected predicted status of alfalfa weevil populations near Swift Current SK to June 15, 2019,using long term average temperatures.

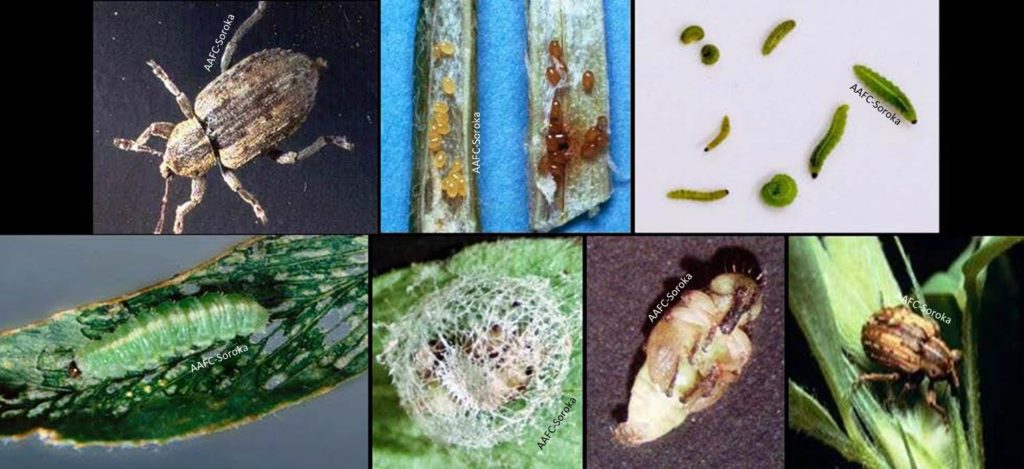
The larval stage of this weevil feeds on alfalfa leaves in a manner that characterizes the pest as a “skeletonizer”.  The green larva featuring a dorsal, white line down the length of its body has a dark brown head capsule and will grow to 9mm long.  

Alfalfa growers are encouraged to check the Alfalfa Weevil Fact Sheet prepared by Dr. Julie Soroka (AAFC-Saskatoon).  Additional information can be accessed by reviewing the Alfalfa Weevil Page extracted from the “Field crop and forage pests and their natural enemies in western Canada – Identification and management field guide” (Philip et al. 2015). The guide is available in both a free English-enhanced or French-enhanced version.

SHARE THIS POST

Predicted bertha armyworm development

Ross Weiss, David Giffen, Owen Olfert and Meghan Vankosky
Categories
Week 8

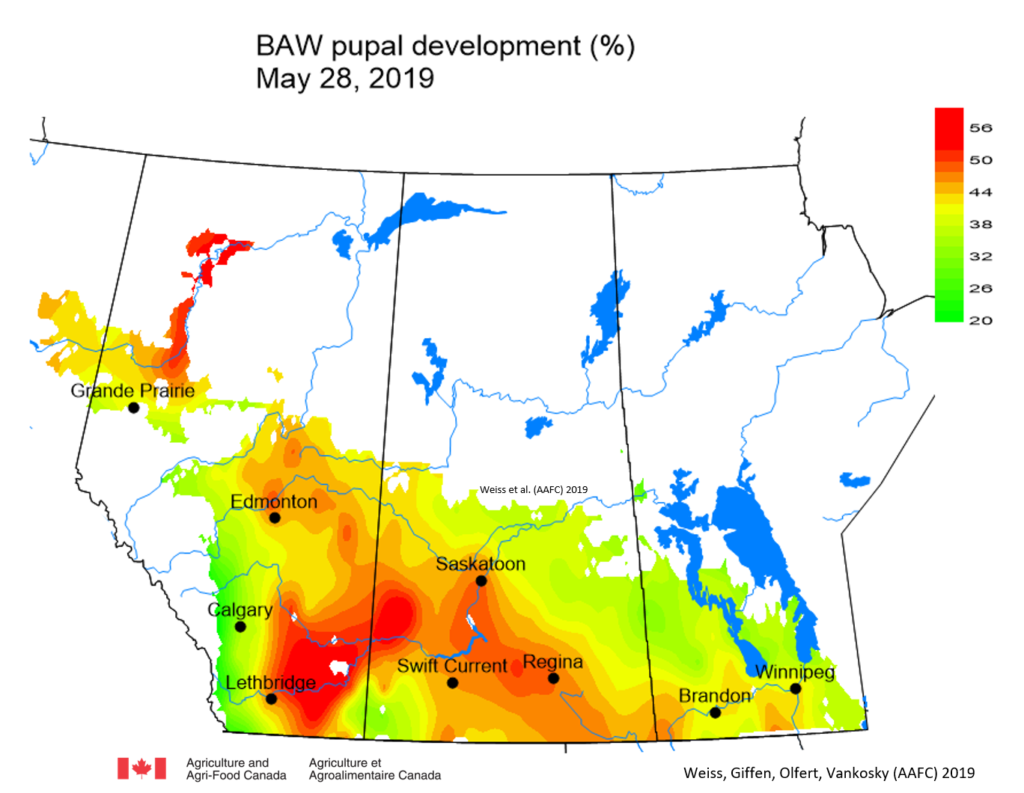
Bertha armyworm (Lepidoptera: Mamestra configurata– Pupal development is approximately 40%. Average development is 48% (Fig. 1). 

Figure 1. Predicted bertha armyworm (Mamestra configurata) pupal development acrossthe Canadian prairies as of May 28, 2019. 

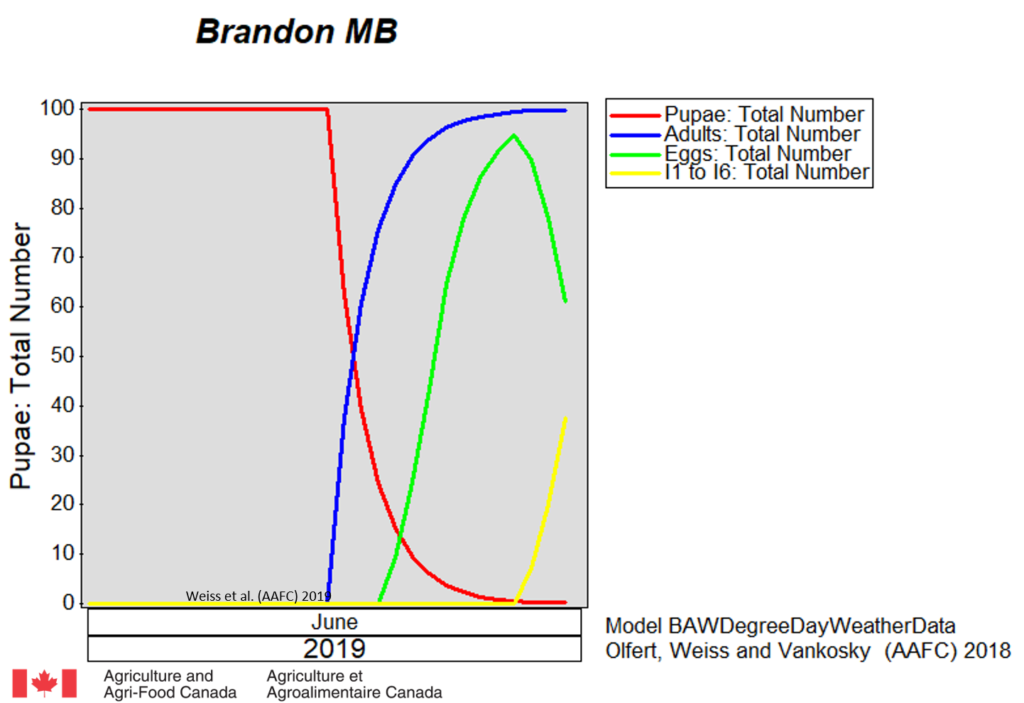
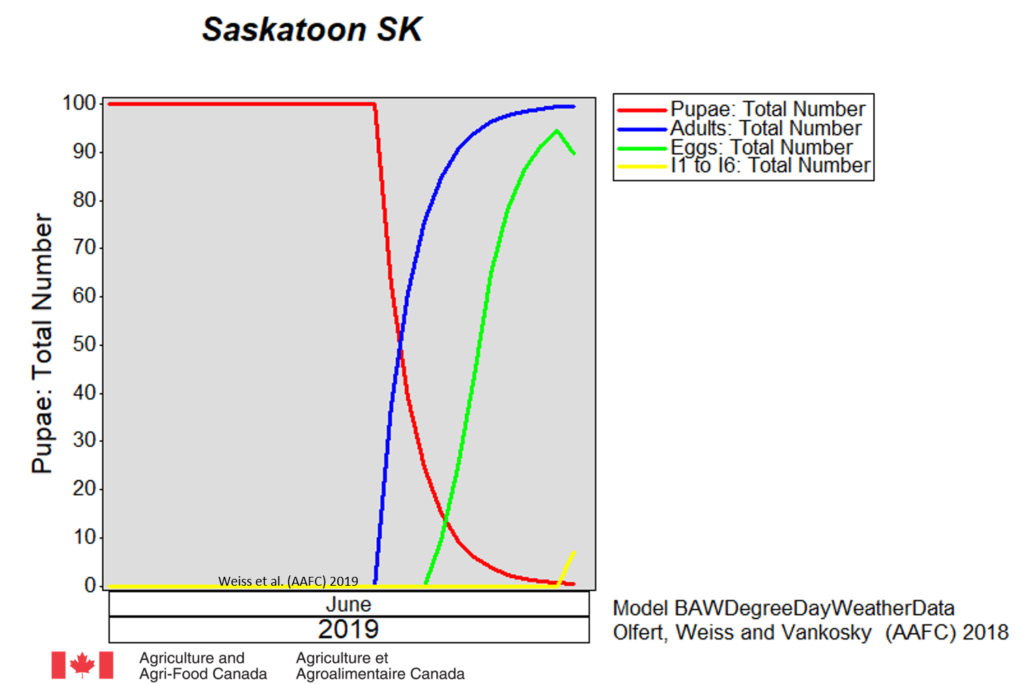
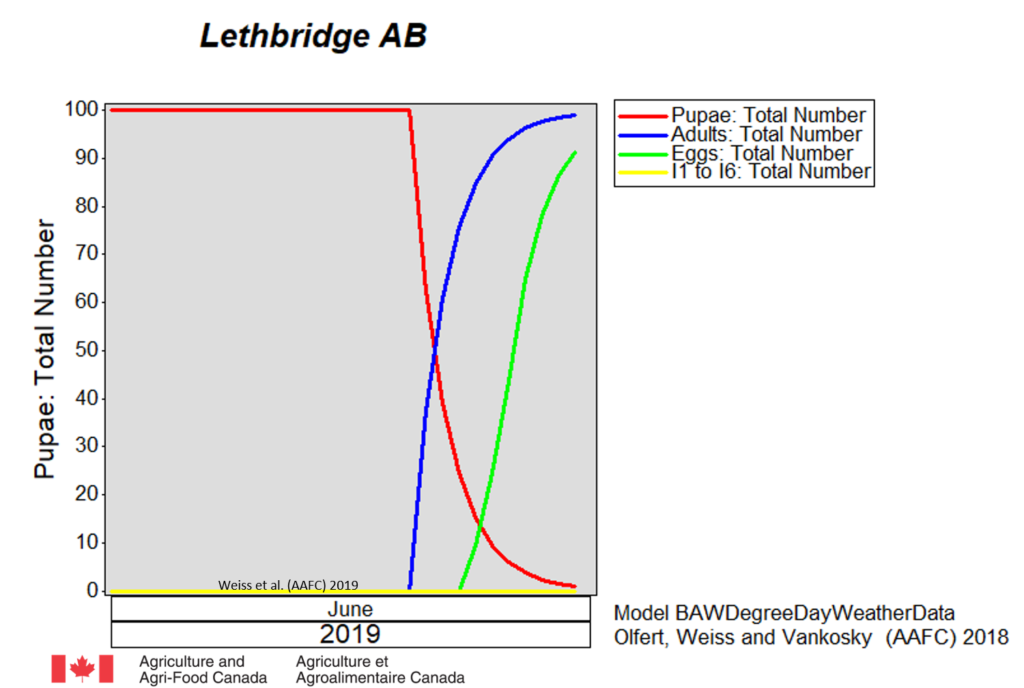
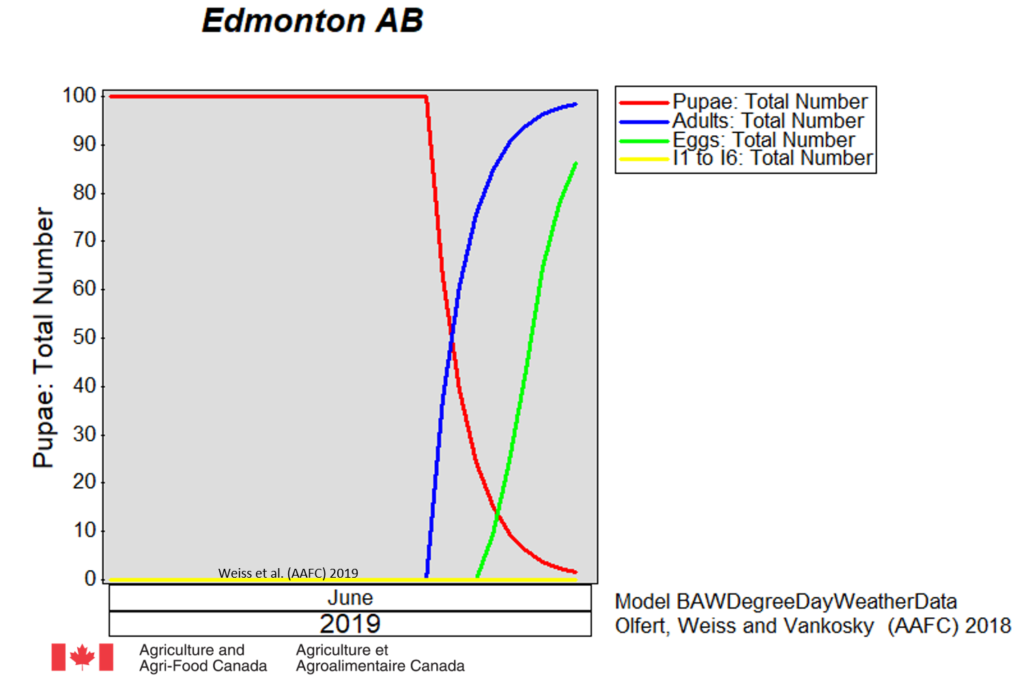
In order to determine when adults may emerge, the BAW model was run for Brandon MB (Fig. 2), Saskatoon SK (Fig. 3), Lethbridge AB (Fig. 4) and Edmonton AB (Fig. 5) and projected to June 30, 2019. Model projections indicate that adults will begin to emerge in mid June. Recent heat will advance development of pupae. Traps should be placed in fields when pupal development reaches 80%. Based on model projections, it is advisable that traps be placed in fields on or before June 7. 

Figure 2. Predicted development of bertha armyworm populations near Brandon MB projected to June 30, 2019.  
Figure 3. Predicted development of bertha armyworm populations near Saskatoon SK projected to June 30, 2019.   
Figure 4. Predicted development of bertha armyworm populations near Lethbridge AB projected to June 30, 2019.  
Figure 5. Predicted development of bertha armyworm populations near Edmonton AB projected to June 30, 2019.   

Biological and monitoring information related to bertha armyworm in field crops is posted by the provinces of ManitobaSaskatchewanAlberta and the Prairie Pest Monitoring Network. Also refer to the bertha armyworm pages within the new “Field Crop and Forage Pests and their Natural Enemies in Western Canada: Identification and management field guide” as an English-enhanced or French-enhanced version.

SHARE THIS POST

Painted Lady Butterfly

Jennifer Otani
Categories
Week 8

This week, Alberta Agriculture & Forestry’s Scott Meers noted painted lady butterfly larvae (Vanessa cardui).  The larvae are important to scout for because this species feeds on a wide range of host plants including soybean (Action threshold=>25% defoliation), sunflowers, borage and dry beans in addition to several species of thistles (including Canada thistle) and mallow. 

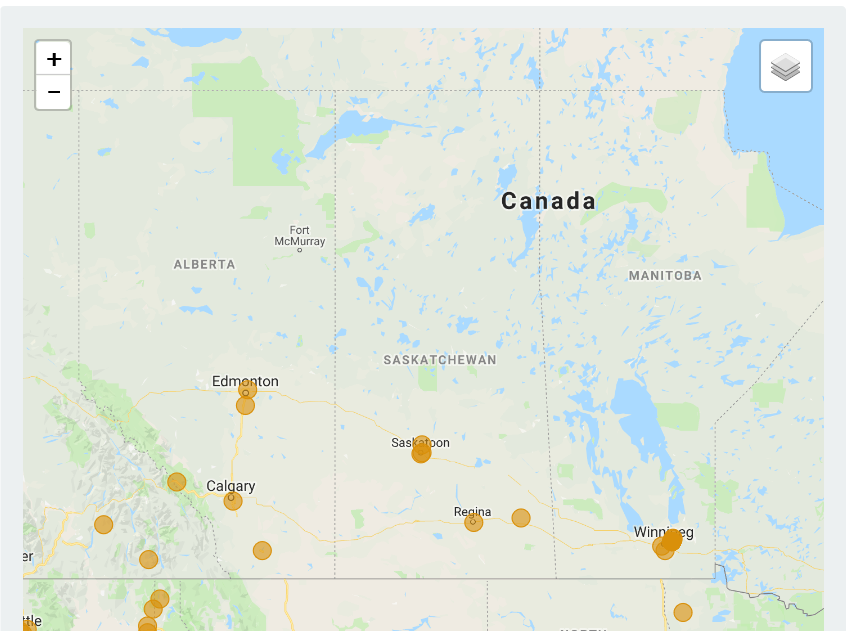
The “Field Crop and Forage Pests and their Natural Enemies in Western Canada: Identification and management field guide” includes photos of both the larvae and adult.  The guide is available as an English-enhanced or French-enhanced version.  The Butterflies and Moths of North America website tracks confirmed sightings of V. cardui (screenshot provided below; retrieved 30May2019).

SHARE THIS POST

Provincial Insect Pest Reports

James Tansey, John Gavloski and Scott Meers
Categories
Week 8

Provincial entomologists provide insect pest updates throughout the growing season so we link to their most recent information: 

Manitoba‘s Insect and Disease Updates for 2019 are posted here and includes an update posted May 29, 2019.

Saskatchewan‘s Crops Blog Posts includes a segment on “Early season scouting of cutworms” by Sara Doerksen posted in April 2019 and “Economic thresholds” by Kaeley Kindrachuk posted in May 2019.

•  Alberta Agriculture and Forestry’s Call of the Land regularly includes insect pest updates from Mr. Scott Meers. The most recent Call of the Land was posted March 18-22, 2019 but did not include an insect update.

SHARE THIS POST

Crop report links

Jennifer Otani
Categories
Week 8

Crop reports are produced by:

The following crop reports are also available:

SHARE THIS POST

Invasive species: Japanese beetle (Popillia japonica)

Jennifer Otani
Categories
Week 8
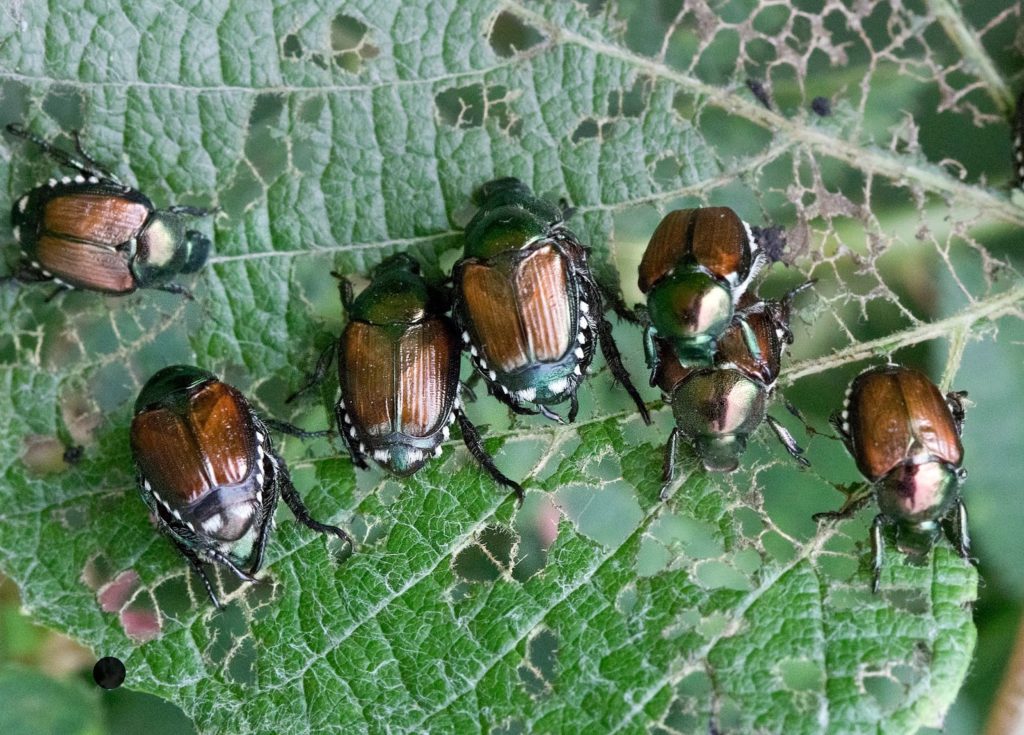
Japanese beetle (Popillia japonica) adults
CC-BY 2.0 – C. Watts

The Japanese beetle (Popillia japonica) is an invasive pest that has been making steady inroads from the east since being first discovered in North America in 1916 (New Jersey) and in Canada in 1939 (Nova Scotia, Quebec). It has not reached the Prairies yet, but it is found in southern Ontario, Quebec, New Brunswick, Prince Edward Island and Nova Scotia. It has been detected in Vancouver,British Columbia and CFIA is leading a coordinated eradication program and has implemented efforts to prevent the pest’s spread outside Vancouver. The rest of British Columbia is still considered free of Japanese Beetle. In the USA, Minnesota and to the south and east is infested and North Dakota and south is partially infested. Montana and several other western USA states have implemented quarantine and phytosanitary regulations to protect their agriculture sector.

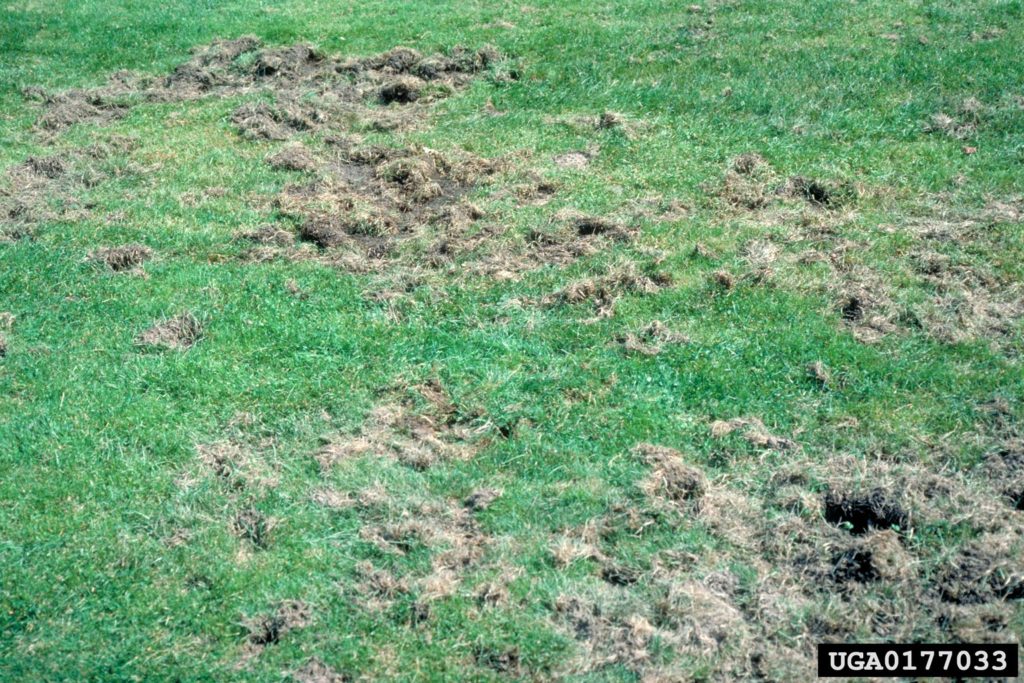
From late June to August, the adult Japanese beetle can attack the leaves and fruit of more than 300 species including ornamentals (birch, elm, maple, mountain ash, rose, zinnia), fruit and vegetables (apple, apricot, asparagus, blueberry, cherry, grape vine, plum, raspberry) and field crops (corn, soybean). The soil-dwelling larvae feed on roots of many species but prefer grass roots, damaging lawns, turf farms, golf courses and pastures.

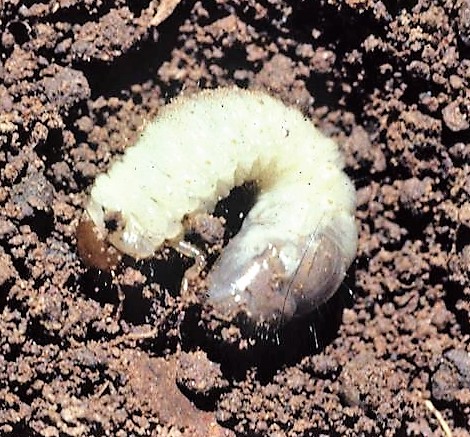
The adult beetle is oval: 10-12 millimeters (0.5 inches) long by half as wide. It is metallic green with a brown head and metallic bronze wing coverings (elytra). Twelve white hair tufts are arranged along the outside edge of the back-half of the abdomen. Larvae are less than 25 millimetres (1 inch) at maturity and are a typical C-shaped white grub with a yellowish-brown head.

For more information see Canadian Food InspectionAgency (CFIA), United States Department of Agriculture (USDA) and Ontario Ministry of Agriculture, Food and Rural Affairs (OMAFRA) websites.

For information about previous featured insects, please visit our Insect of the Week page. For even more information on crop pests and their natural enemies, be sure to check out our newly updated Field Guide and Cutworm Guide, available for free download on our Insect Field Guide and Cutworm Field Guide pages.

Japanese beetle (Popillia japonica) larva
CC-BY-NC 3.0 – Jim Baker, North Carolina University
Japanese beetle (Popillia japonica) larval damage in turf
CC-BY-NC 3.0 – MG Kelin, USDA-ARS
SHARE THIS POST

SHARE THIS POST