Jennifer Otani, Ross Weiss, David Giffen, Serge Trudel, Erl Svendsen, Owen Olfert and Meghan Vankosky
Categories
Week 13
Greetings!
Lucky Week 13 and another busy week of in-field monitoring, data collection, and field tour events for all our Staff! Please bookmark the Blog or subscribe to receive the latest growing season information!
This week, special thanks to all those field cooperators who continue to check and report their weekly in-field data! Your efforts support agriculture in your province and ultimately the Prairie Pest Monitoring Network pulls the combined prairie-wide effort into the Annual Risk and Forecast Maps. These are important research and grower resources so Thank you!!
Ross Weiss, David Giffen, Owen Olfert and Meghan Vankosky
Categories
Week 13
Prairie temperatures continue to be cooler than average. Though temperatures this week were approximately 1 °C warmer than last week, temperatures were cooler than normal (Fig. 1). The warmest temperatures were observed across MB while temperatures were cooler in western SK and across AB.
Figure 1. Average temperature (°C) across the Canadian prairies the past seven days (June 24-July 1, 2019).
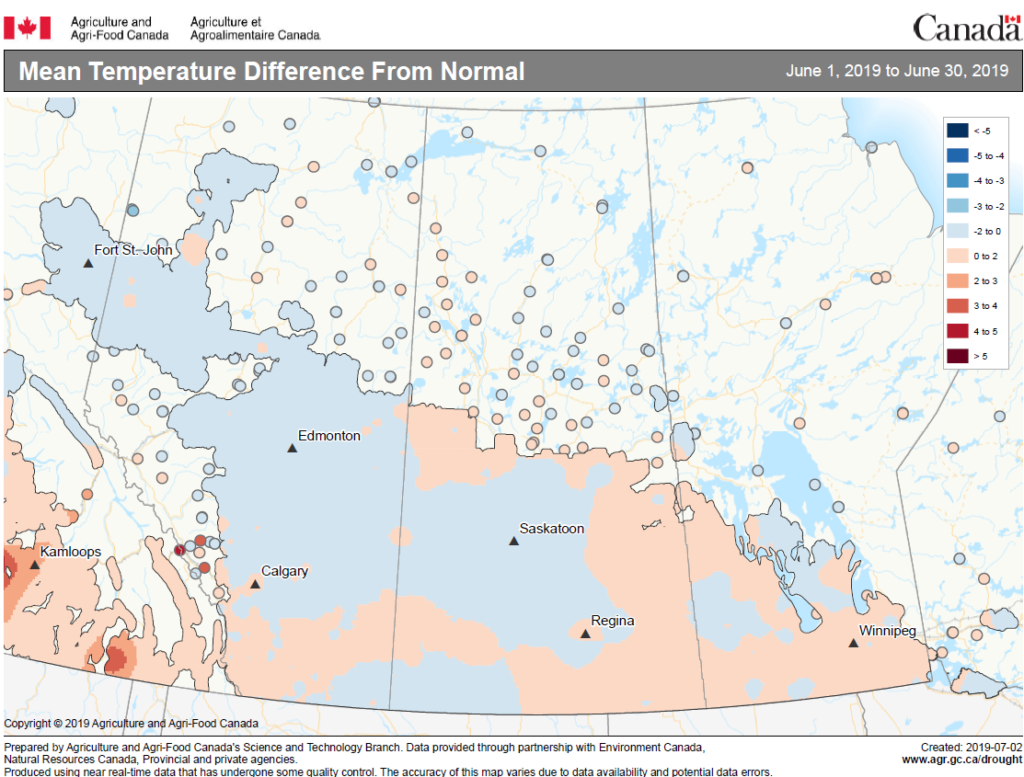
Across the prairies, 30-day average temperatures were approximately 1 °C cooler than normal (Fig. 2). Average 30-day temperatures were warmest across southern MB and SK. Cooler temperatures were reported across eastern and northern AB. The mean temperature differences from normal (June 1 – 30, 2019) were zero to two degrees Celsius cooler than for AB and western SK while temperatures in eastern SK and MB have been zero to two degrees Celsius warmer than normal (Fig. 3).
Figure 2. Average temperature (°C) across the Canadian prairies the past 30 days (June 2-July 1, 2019). Figure 3. Mean temperature difference from Normal across the Canadian prairies over the past 30 days (June 1-30, 2019). Image has not been reproduced in affiliation with, or with the endorsement of the Government of Canada and was retrieved (04Jul2019). Access the full map at http://www.agr.gc.ca/DW-GS/current-actuelles.jspx?lang=eng&jsEnabled=true
Growing season temperatures (April 1-July 1, 2019) have been warmest across the southern prairies. Across the prairies, the average growing season temperature has been 1.2 °C below normal (Fig. 4).
Figure 4. Average temperature (°C) across the Canadian prairies for the growing season (April 1-July 1 2019).
This past week significant rainfall amounts were reported for southern SK and the Peace River region. Minimal rainfall was reported across MB and southern AB (Fig. 5).
Figure 5. Cumulative precipitation observed the past seven days across the Canadian prairies (June 24-July 1, 2019).
Across the prairies, rainfall amounts for the past 30 days have been near normal (Fig. 6). The Edmonton AB region has been the wettest. Growing season rainfall amounts have been below average for most of the prairies, particularly across southern regions of AB and eastern MB (Fig. 7).
Figure 6. Cumulative precipitation observed the past 30 days across the Canadian prairies (June 2-July 1, 2019). Figure 7. Cumulative precipitation observed for the growing season (April 1-July 1, 2019) across the Canadian prairies.
Based on modelled soil moisture, recent rains have improved soil moisture values across a large area of SK. Predicted soil moisture continues to be low across large regions of eastern MB and southern AB.
Figure 8. Modeled soil moisture (%) across the Canadian prairies as of July 1, 2019.
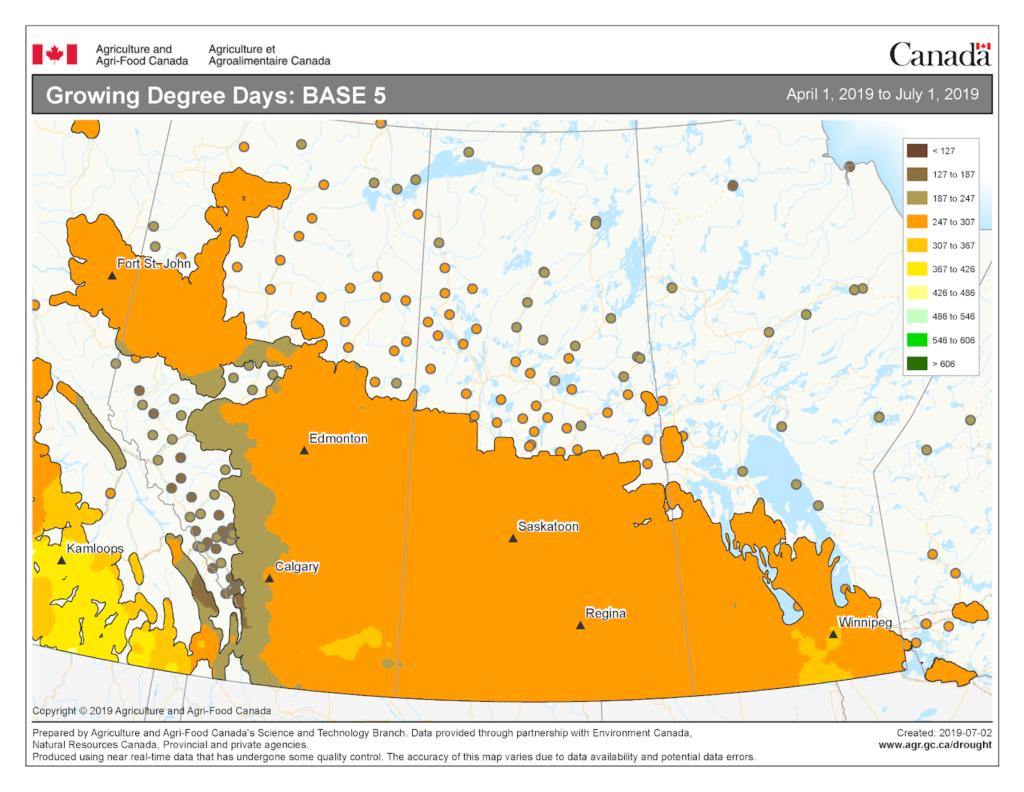
The growing degree day map (GDD) (Base 5 ºC, April 1-June 24, 2019) is below (Fig. 9):
Figure 9. Growing degree day (Base 5 ºC) across the Canadian prairies for the growing season (April 1-July 1, 2019). Image has not been reproduced in affiliation with, or with the endorsement of the Government of Canada and was retrieved (04Jul2019). Access the full map at http://www.agr.gc.ca/DW-GS/current-actuelles.jspx?lang=eng&jsEnabled=true
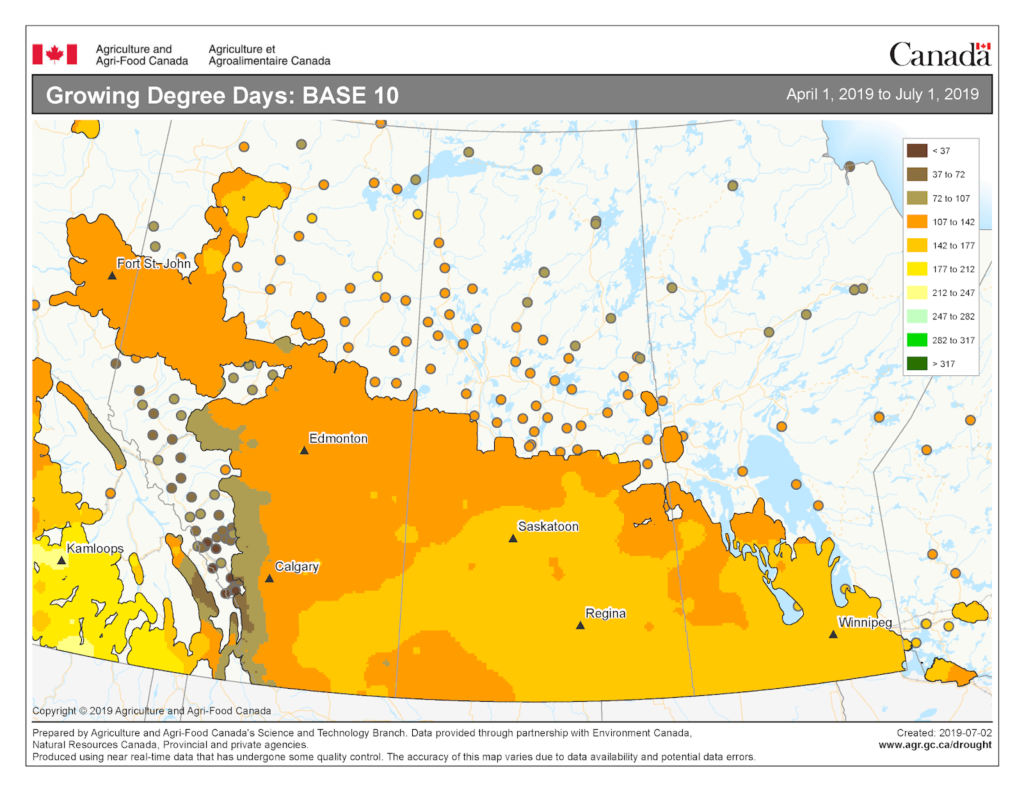
The growing degree day map (GDD) (Base 10 ºC, April 1-June 24, 2019) is below (Fig. 10):
Figure 10. Growing degree day (Base 10 ºC) across the Canadian prairies for the growing season (April 1-July 1, 2019). Image has not been reproduced in affiliation with, or with the endorsement of the Government of Canada and was retrieved (04Jul2019). Access the full map at http://www.agr.gc.ca/DW-GS/current-actuelles.jspx?lang=eng&jsEnabled=true
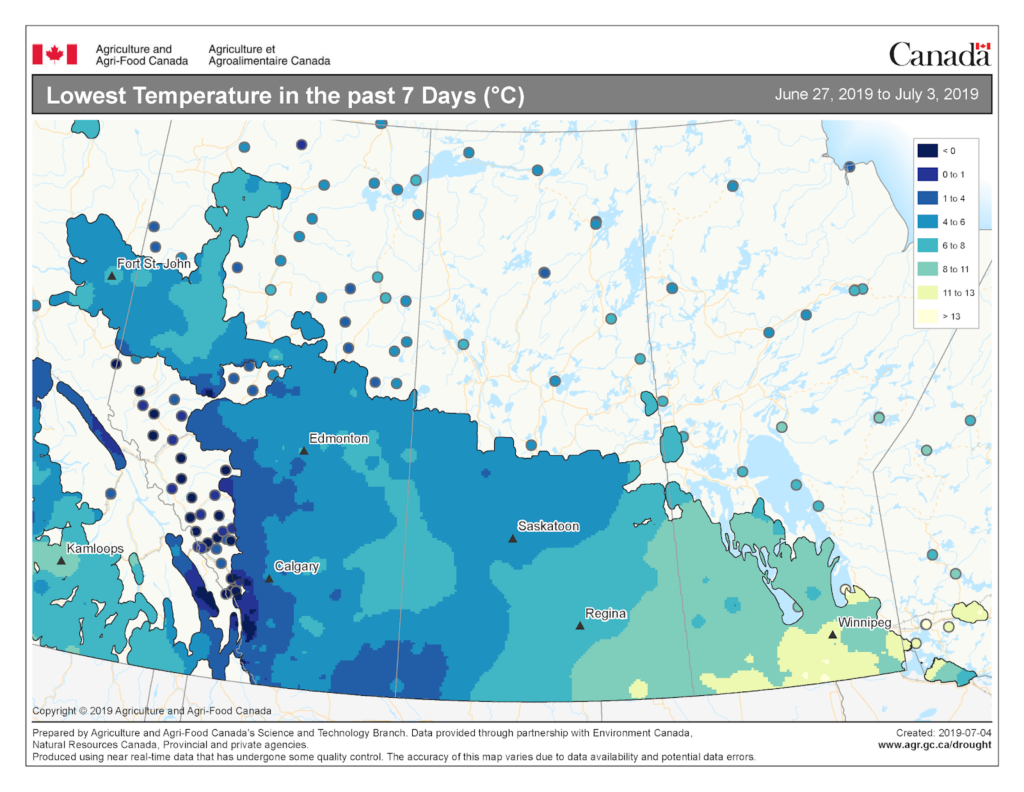
The lowest temperatures (°C) observed the past seven days ranged from at least 13 to at least 0 °C in the map below (Fig. 11).
Figure 11. Lowest temperatures (°C) observed across the Canadian prairies the past seven days (to July 1, 2019). Image has not been reproduced in affiliation with, or with the endorsement of the Government of Canada and was retrieved (04Jul2019). Access the full map at http://www.agr.gc.ca/DW-GS/current-actuelles.jspx?lang=eng&jsEnabled=true
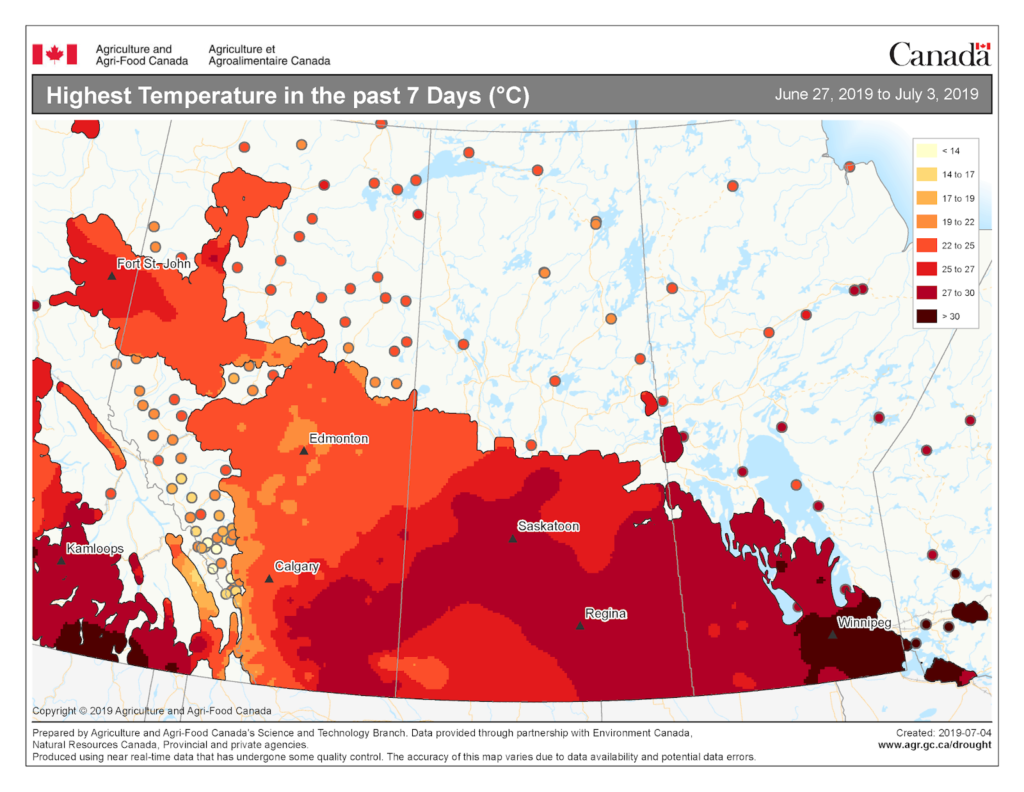
The highest temperatures (°C) observed the past seven days ranged from less than 14 to at least 30 °C in the map below (Fig. 12).
Figure 12. Highest temperatures (°C) observed across the Canadian prairies the past seven days (to July 1, 2019). Image has not been reproduced in affiliation with, or with the endorsement of the Government of Canada and was retrieved (04Jul2019). Access the full map at http://www.agr.gc.ca/DW-GS/current-actuelles.jspx?lang=eng&jsEnabled=true
The maps above are all produced by Agriculture and Agri-Food Canada. Growers can bookmark the AAFC Drought Watch Maps for the growing season.
Ross Weiss, David Giffen, Owen Olfert and Meghan Vankosky
Categories
Week 13
Grasshopper Simulation Model Output – The grasshopper simulation model will be used to monitor grasshopper development across the prairies. Weekly temperature data collected across the prairies is incorporated into the simulation model which calculates estimates of grasshopper development stages based on biological parameters for Melanoplus sanguinipes (Migratory grasshopper).
Recent cool conditions have resulted in reduced grasshopper development rates. Based on model runs, approximately 22% (33% last week) of the population is in the first instar, 29% (26% last week) is predicted to be in the second instar, and 27% (11% last week) in the third instar, 8.2% (1.5% last week) are predicted to be in the fourth instar and less than 1% may be in the fifth instar (Fig. 1). Grasshopper development this season has been similar to long term average development. The following map indicates that grasshopper populations across the southern prairie are mostly in the second instar with some areas having populations that are mostly third instars.
Figure 1. Predicted development stages of grasshopper (Melanoplus sanguinipes) populations across the Canadian prairies (as of July 1, 2019).
Ross Weiss, David Giffen, Owen Olfert and Meghan Vankosky
Categories
Week 13
Wheat Midge (Sitodiplosis mosellana) – Wheat midge adults generally emerge during the first week of July. Compared to long term normal values for temperature and rainfall, May and June in the Saskatoon region has been approximately 1 °C cooler and rainfall is 40-60% less than normal. Dry conditions in May and June can have significant impact on wheat midge emergence. Insufficient rainfall in May and June can result in delayed movement of larvae to the soil surface. Elliott et al (2009) reported that wheat midge emergence was delayed or erratic if rainfall did not exceed 20-30 mm during May. Olfert et al. 2016 ran model simulations to demonstrate how rainfall impacts wheat midge population density. Our wheat midge model indicates that dry conditions may result in:
Delayed adult emergence and oviposition
Reduced numbers of adults and eggs
The wheat midge model indicates that 54% (70% last week) of the population are in the larval cocoon stage and 42% (29% last week) of the population is predicted to have moved to the soil surface. This week 3.4% (less than 1% last week) is predicted to be in the pupal stage. Adults may begin to emerge later this week, or earlier next week.
The first map indicates the percent of the population that is in the larval stage, at the soil surface. The second map indicates that pupae may be present in some fields in southern AB and MB. It should be noted that, based on fall surveys in 2018, wheat midge populations were expected to be low across most of AB and SK.
Figure 1. Percent of larval population at the soil surface (as of July 1, 2019) across the Canadian prairies. Figure 2. Percent of population AT PUPAL STAGE (as of June 24, 2019) across the Canadian prairies.
Monitoring: When monitoring wheat fields, pay attention to the synchrony between flying midge and anthesis.
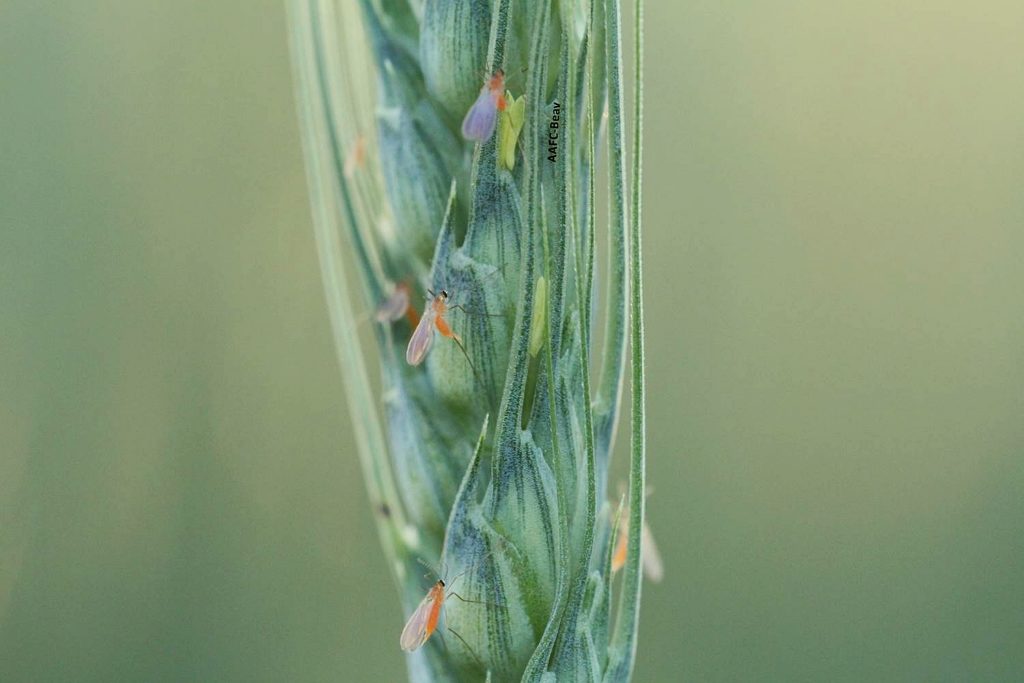
In-field monitoring for wheat midge should be carried out in the evening (preferably after 8:30 pm or later) when the female midges are most active. On warm (at least 15ºC), calm evenings, the midge can be observed in the field, laying their eggs on the wheat heads (photographed by AAFC-Beav-S. Dufton & A. Jorgensen below). Midge populations can be estimated by counting the number of adults present on 4 or 5 wheat heads. Inspect the field daily in at least 3 or 4 locations during the evening.
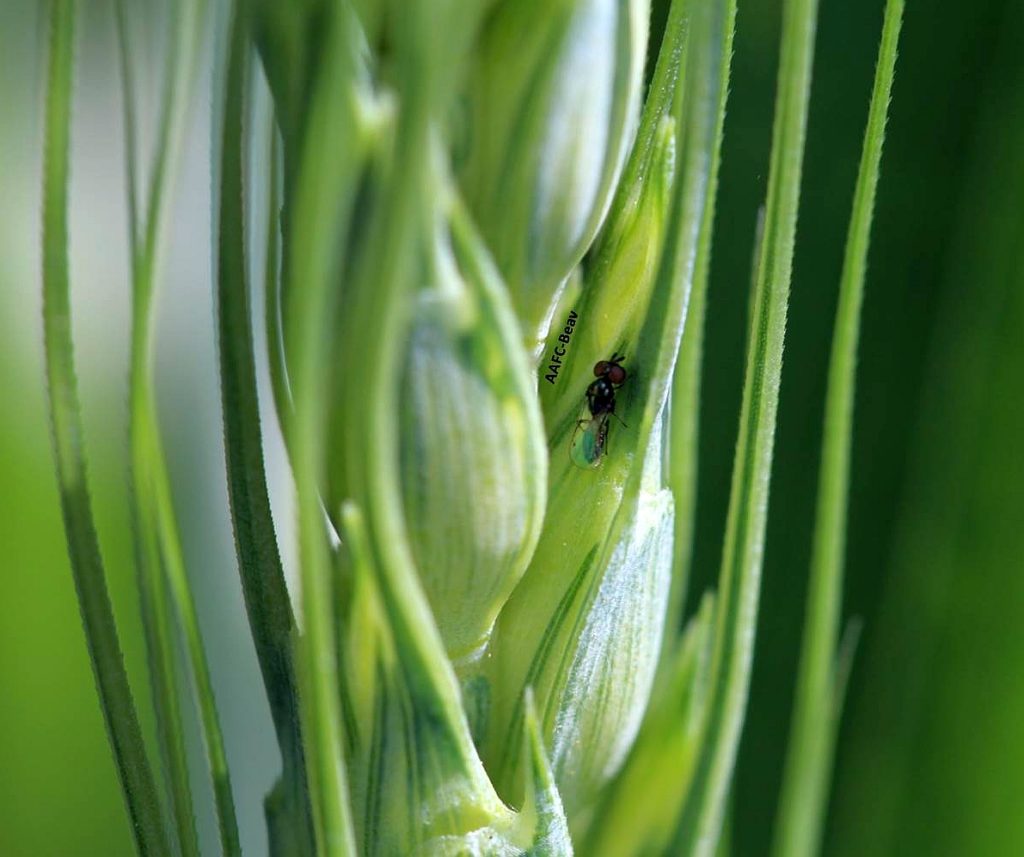
REMEMBER that in-field counts of wheat midge per head remain the basis of economic threshold decision. Also remember that the parasitoid, Macroglenes penetrans (photographed by AAFC-Beav-S. Dufton below), is actively searching for wheat midge at the same time. Preserve this parasitoid whenever possible and remember your insecticide control options for wheat midge also kill these beneficial insects which help reduce midge populations.
Economic Thresholds for Wheat Midge: a) To maintain optimum grade: 1 adult midge per 8 to 10 wheat heads during the susceptible stage. b) For yield only: 1 adult midge per 4 to 5 heads. At this level of infestation, wheat yields will be reduced by approximately 15% if the midge is not controlled.
Inspect the developing kernels for the presence of larvae and the larval damage.
Wheat midge and its doppelganger, the lauxanid fly, were featured as the Insect of the Week (for Wk10). Check that post for help with in-field scouting for this economic pest of wheat! The differences between midges and parasitoid wasps are featured as the current Insect of the Week (for Wk11). Not all flying insects are mosquitoes nor are they pests – many are important parasitoid wasps that actually regulate insect pest species in our field crops.
More information about Wheat midge can be found by accessing the pages from the new “Field Crop and Forage Pests and their Natural Enemies in Western Canada: Identification and Field Guide”. View ONLY the Wheat midge pages but remember the guide is available as a free downloadable document as both an English-enhanced or French-enhanced version.
Ross Weiss, David Giffen, Owen Olfert and Meghan Vankosky
Categories
Week 13
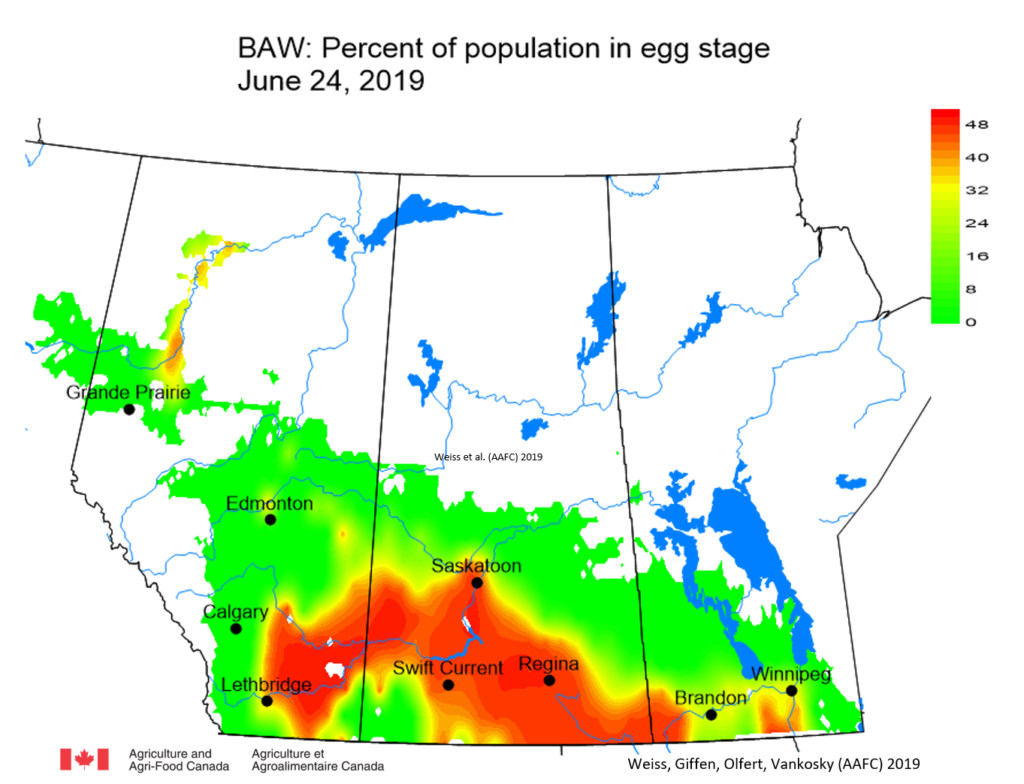
Bertha armyworm (Lepidoptera: Mamestra configurata) – Last week (Fig. 1), bertha armyworm adults were emerging across the prairies and oviposition began across most of the southern prairie regions of SK, AB and MB. That means it’s time to start check the undersides of canola leaves for egg masses and newly hatched larvae!
Figure 1. Predicted precent of bertha armyworm (Mamestra configurata) populations at EGG STAGE across the Canadian prairies as of June 24 2019.
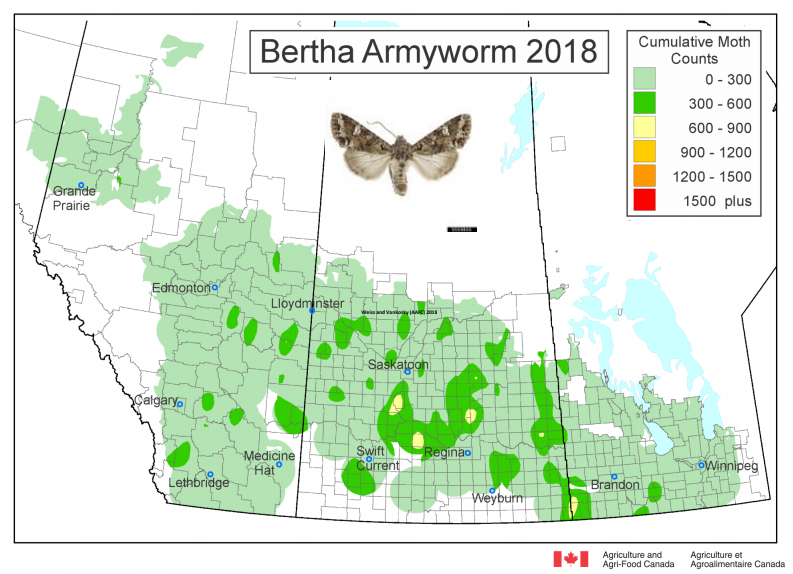
Here’s where bertha armyworm moths were intercepted last year (Fig. 2) so areas previously highlighted in yellow, gold, orange or red should be on the lookout in 2019 for larvae. Also watch your provincial monitoring networks who are weekly recording cumulative pheromone-baited traps in Alberta, Saskatchewan (table on Left of webpage), and Manitoba (pg 7).
Figure 2. Cumulative moth counts from pheromone-baited unitraps deployed during the 2018 growing season.
Biological and monitoring information related to bertha armyworm in field crops is posted by the provinces of Manitoba, Saskatchewan, Alberta and the Prairie Pest Monitoring Network. Also refer to the bertha armyworm pages within the “Field Crop and Forage Pests and their Natural Enemies in Western Canada: Identification and management field guide” which is a free downloadable document as both an English-enhanced or French-enhanced version.
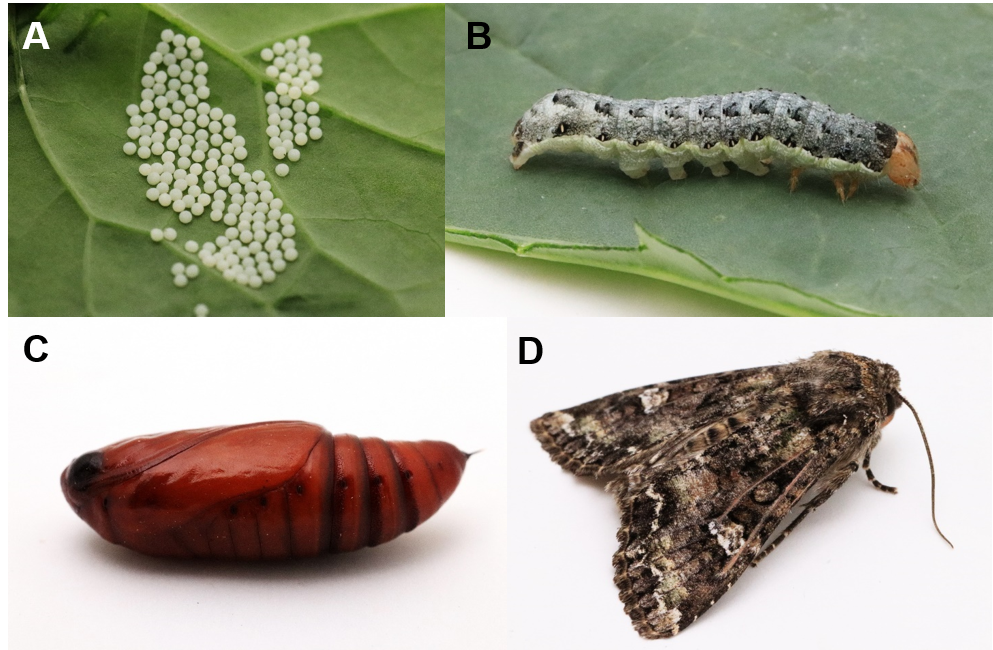
Again, thanks to John Gavloski (Manitoba Agriculture) who helped update the PPMN Bertha armyworm monitoring protocol. Use the images below (Fig. 3) to help identify moths from the by-catch that will be retained in phermone-baited unitraps.
Figure 3. Stages of bertha armyworm from egg (A), larva (B), pupa (C) to adult (D). Photos: J. Williams (Agriculture and Agri-Food Canada)
Also be sure to review the Insect of the Week which features bertha armyworm and its doppelganger, the clover cutworm!
Public summer field events – Coming to a field near you – Prairie field crop entomologists are already scheduled to be at these 2019 field tour events from May-August (be sure to re-confirm dates and details as events are finalized):
• July 9-12, July 16-18, 2019: Crop Diagnostic School. Held at the University of Manitoba Research Farm at Carman, Manitoba. An 2-week diagnostic school will complete units on entomology, plant pathology, weed science, soil fertility, pulse crop production, and oilseed production. View registration and event information. Entomologists participating: John Gavloski and Jordan Bannerman.
• July 9, 2019: CanolaPALOOZA Saskatoon, to be held at the SRDC Llewellyn Farm. Read more about this event. Entomologists presenting: Tyler Wist, James Tansey, Greg Sekulic, Meghan Vankosky
• July 22, 2019: Pulse grower gathering held near Three Hills AB. Check Alberta Pulse Growers Event Page for more information. Entomologists presenting: Graduate students from Dr. Maya Evenden’s (U of A) working on pea leaf weevil.
• July 23-24, 2019: Crop Diagnostic School, Scott Saskatchewan. Read more about this event. Entomologists presenting: Meghan Vankosky, Tyler Wist.
• July 24, 2019: Crops-a-Palooza. Held at Canada-Manitoba Crop Diversification Centre (CMCDC), Carberry, Manitoba. Read more about this event. Entomologist participating: John Gavloski, Vincent Hervet, Tharshi Nagalingam, Bryan Cassone.
• August 8, 2019: 2019 Wheatstalk to be held at Teepee Creek AB. View event info/registration details. Entomologists tentatively participating: Jennifer Otani, Amanda Jorgensen, Boyd Mori.
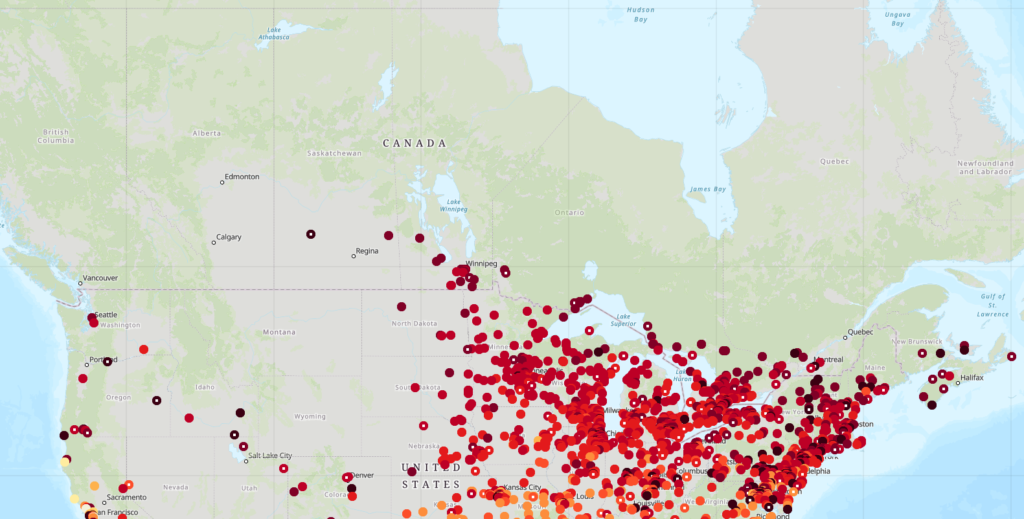
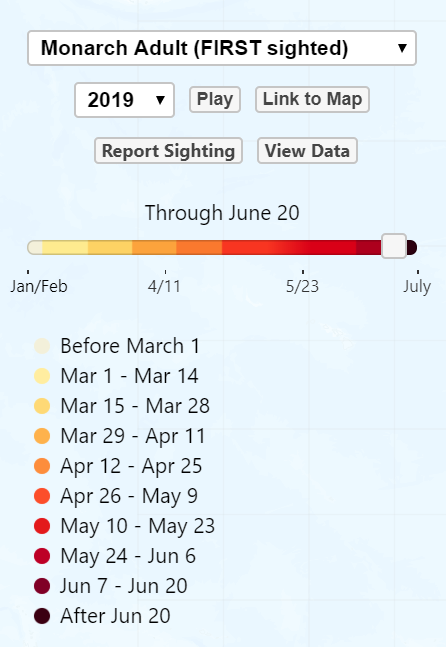
We continue to track the migration of the Monarch butterflies as they move north by checking the 2019 Monarch Migration Map! A screen shot of the map has been placed below as an example (retrieved 04Jul2019) but follow the hyperlink to check the interactive map. They are moving west and near Yorkton, Saskatchewan this week!
The case of the innocuous versus the evil twin: When making pest management decisions, be sure that the suspect is actually a pest. This can be challenge since insects often mimic each other or look very similar. An insect that looks, moves and acts like a pest may in fact be a look-alike or doppelganger.
Doppelgangers may be related (e.g. same genus) or may not be related, as in the case of monarch butterflies (Danaus plexippus) and viceroys (Limenitis achrippus). Doppelgangers are usually relatively harmless but sometimes the doppelganger is a pest yet their behaviour, lifecycle or hosts may be different.
Correctly identifying a pest enables selection of the most accurate scouting or monitoring protocol. Identification and monitoring enables the application of economic thresholds. It also enables a producer to select and apply the most effective control option(s) including method and timing of application. For the rest of the growing season, the Insect of the Week will feature insect crop pests and their doppelgangers.
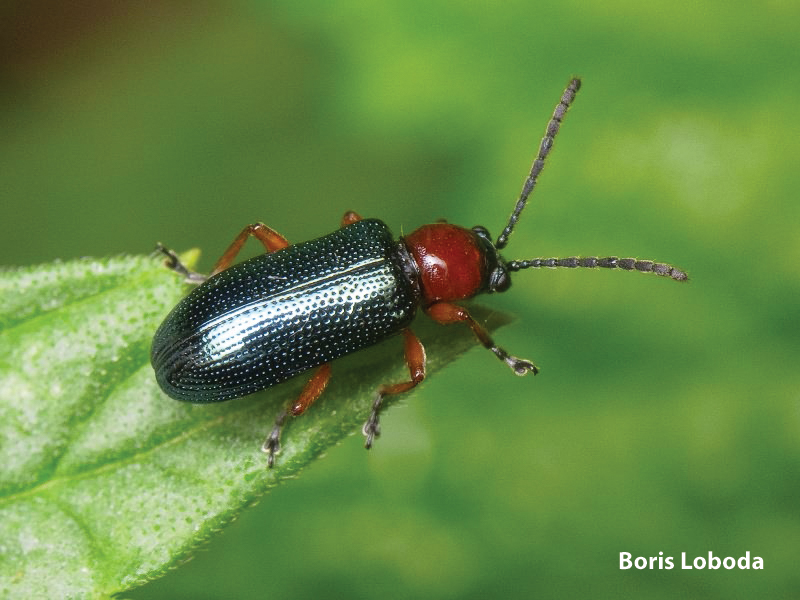
The case of the cereal leaf beetle versus Collops beetles:
Cereal leaf beetle, Boris Loboda
Cereal leaf beetles (Oulema melanopus), both adults and larva, feed on leaves (oat, barley, wheat, corn, etc), but it is the larval damage that can reduce yield and quality, especially if the flag leaf is stripped. Adults are 6-8 millimeters (.25-.31 inches) long with reddish legs and thorax (middle section between head and abdomen) and metallic bluish-black head and elytra (wing coverings).
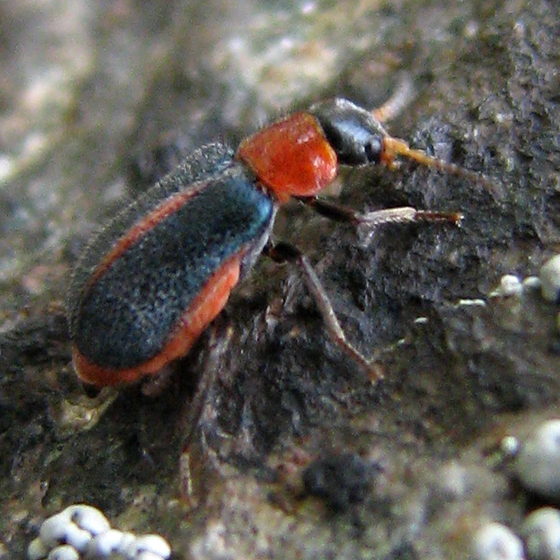
Collops beetle, cc-by-nd-nc 1.0 Ashley Bradford
They may be confused with beneficial beetles belonging to the Collops genus (adults feed on aphids, stink bug eggs, moth eggs, small caterpillars, spider mites, whiteflies). Roughly the same size, they may have a red or orange thorax with/without red markings on their elytra, depending on the species. One consistent feature that will help distinguish between the two species is that the cereal leaf beetle elytra are smooth and shiny whereas the Collops’ elytra are covered in hairs.